 |
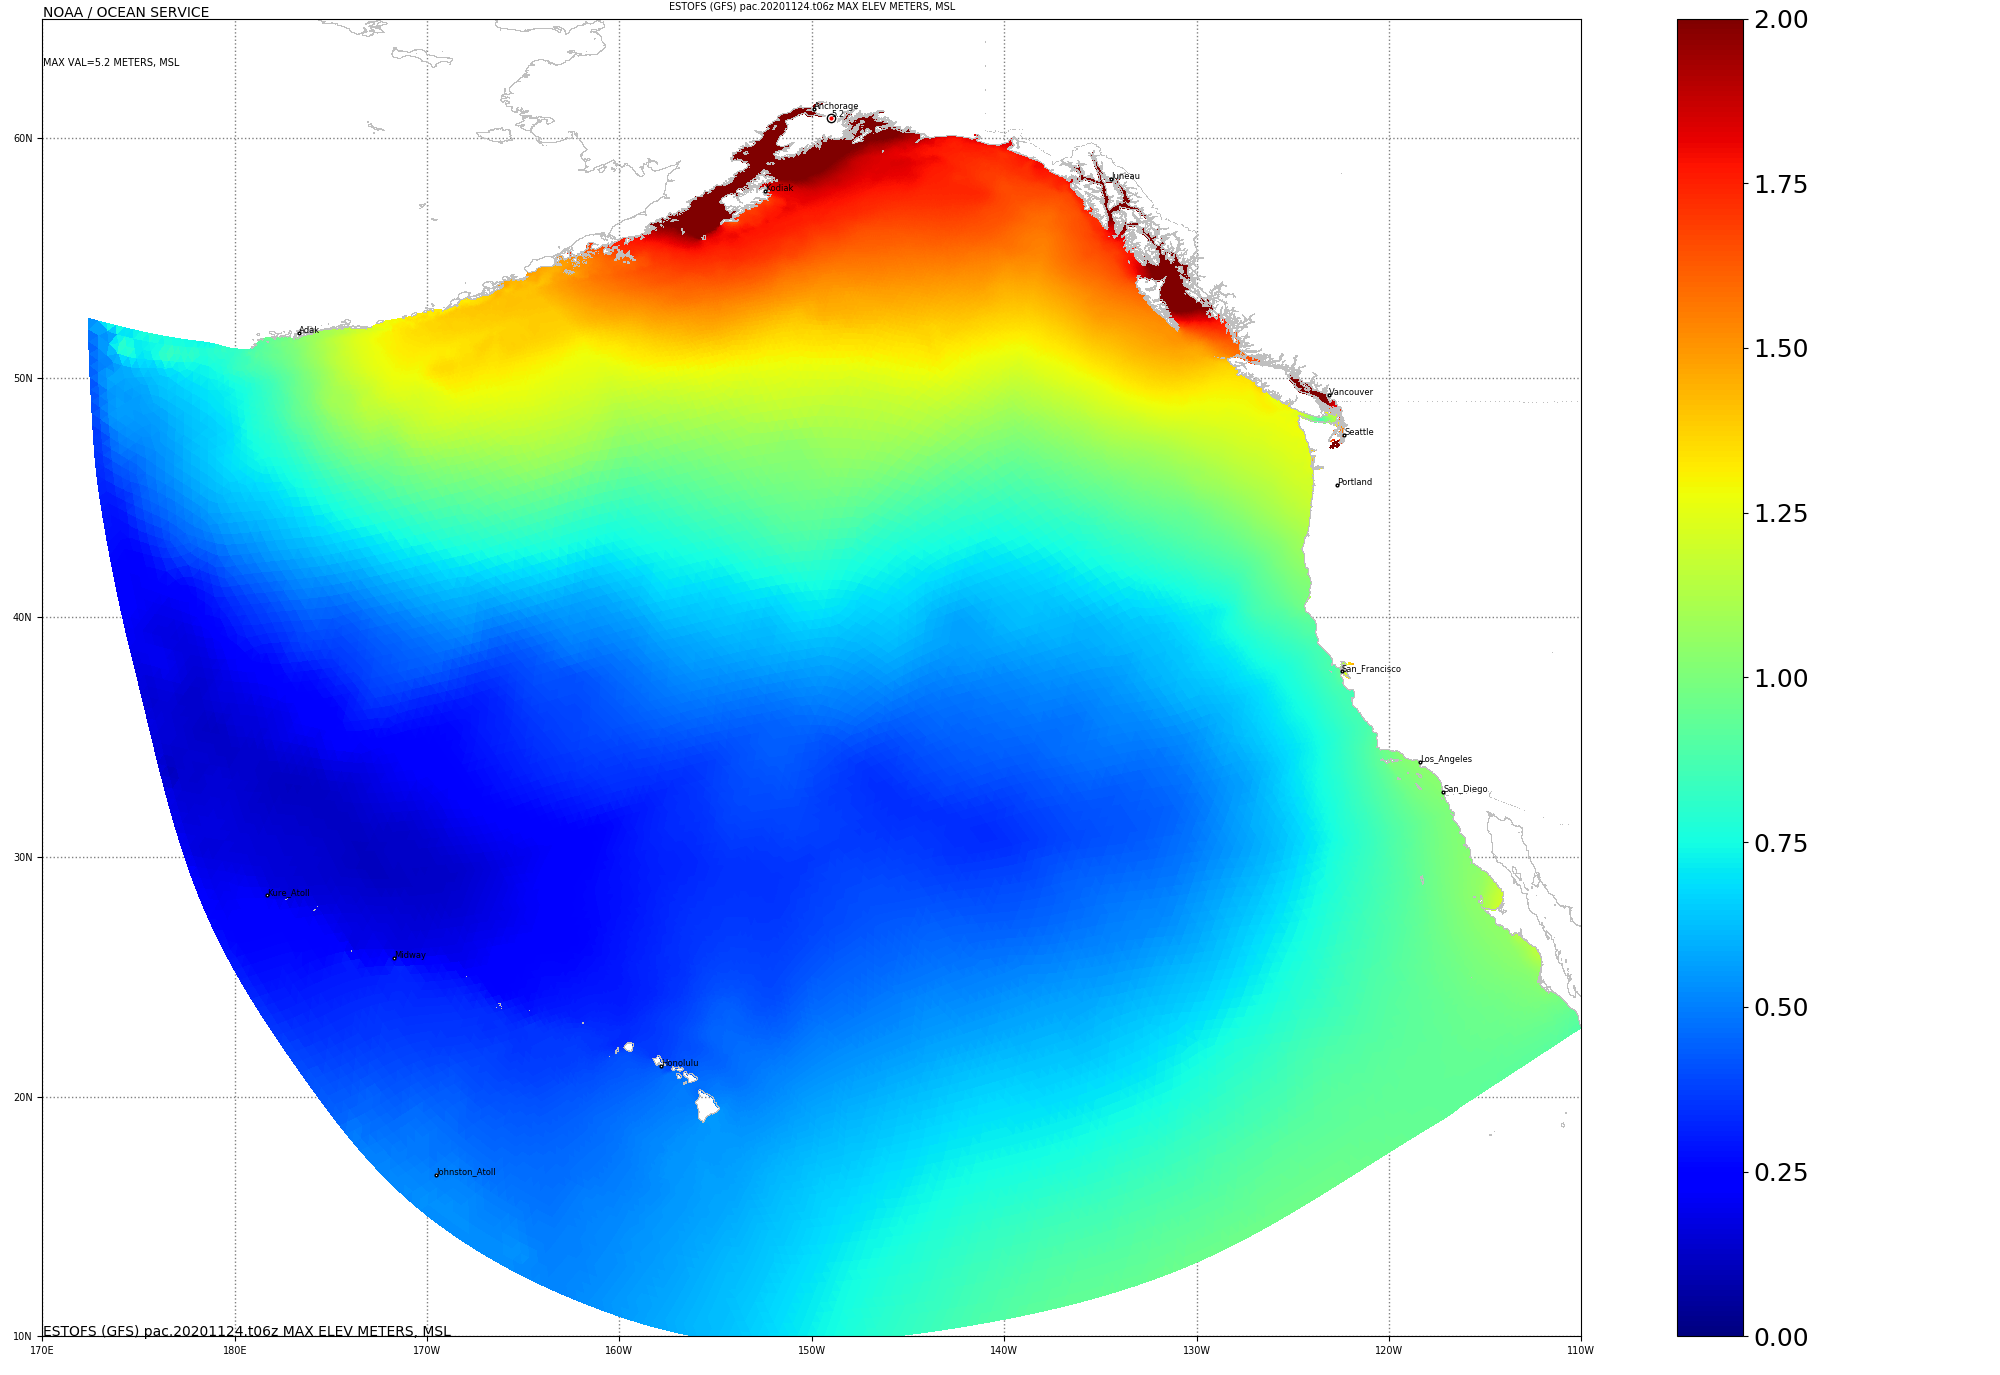
Maximal elevations computed by the model over 168 hours forecast cycle. Meters MSL. |
| Jump to CA :: OR :: WA :: AK :: HI & Midway :: IOOS Ocean Bouys |
Time Series of Water
Levels at CO-OPS stations. Green curve is OBS Blue curve is ESTOFS storm tide guidance Gray curve is post-corrected storm tide guidance (where obs are available) Cyan curve is ESTOFS tidal predictions Magenta curve is ESTOFS surge guidance |
| California |
Top |
                                    |
|
| Oregon |
Top |
                |
|
| Washington |
Top |
                |
|
| Alaska |
Top |
                     |
|
| Hawaii
& Midway |
Top |
       |
|
| IOOS
Ocean Bouys |
Top |
              |