| This is an experimental web
portal for graphic visualization of the operational and
experimental results from the storm surge and tide forecast
systems being developed and tested by the National Ocean
Service (NOS/OCS) and the National Weather Service's Model
Development Laboratory (NWS/STI). STOFS and ETSS model outputs are NOT total water level guidance. Actual water levels can be significantly higher than forecast due to waves, steric effect and other components not presently included in the models. Please check with your regional National Weather Service forecast office for the official water level forecast. |
|
|
|
ETSS in Atlantic
ETSS @ATLANTIC operational Latest Forecast Cycle: |
| Maximal storm tide (storm surge +
astronomical tide) as computed by the model over 102 hours forecast cycle. Meters MLLW. These graphics do NOT reflect total water level guidance, which can be much higher. For total water level guidance, please consult Weather Service. |
|
| Jump to ME :: NH :: MA :: RI :: CT :: NY :: NJ :: PA :: DE :: MD :: DC :: VA :: NC :: SC :: GA :: FL (Atl Coast) FL (Gulf Coast) :: AL :: MS :: LA :: TX |
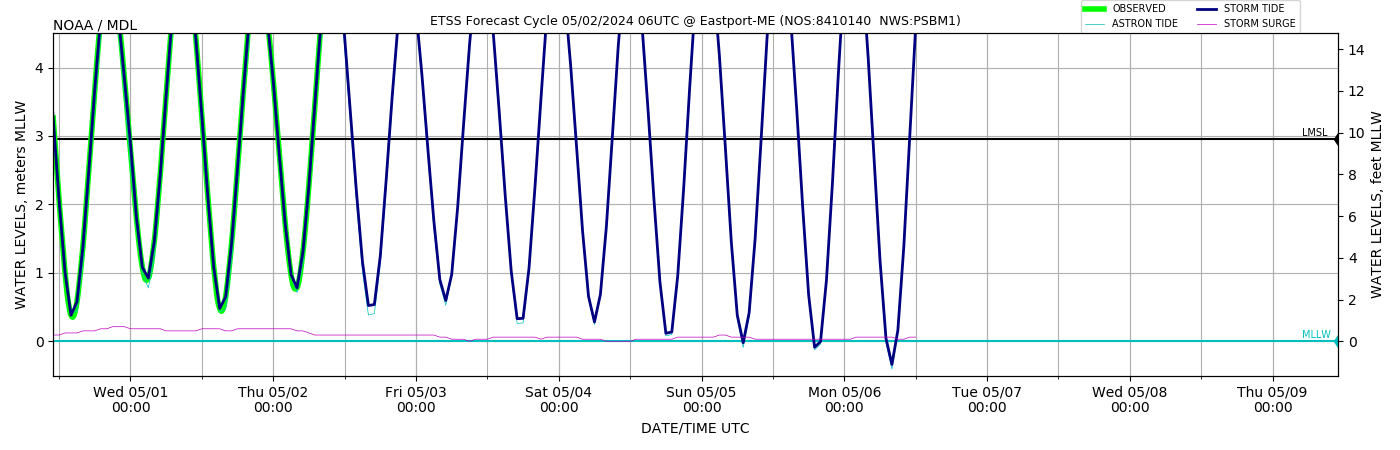
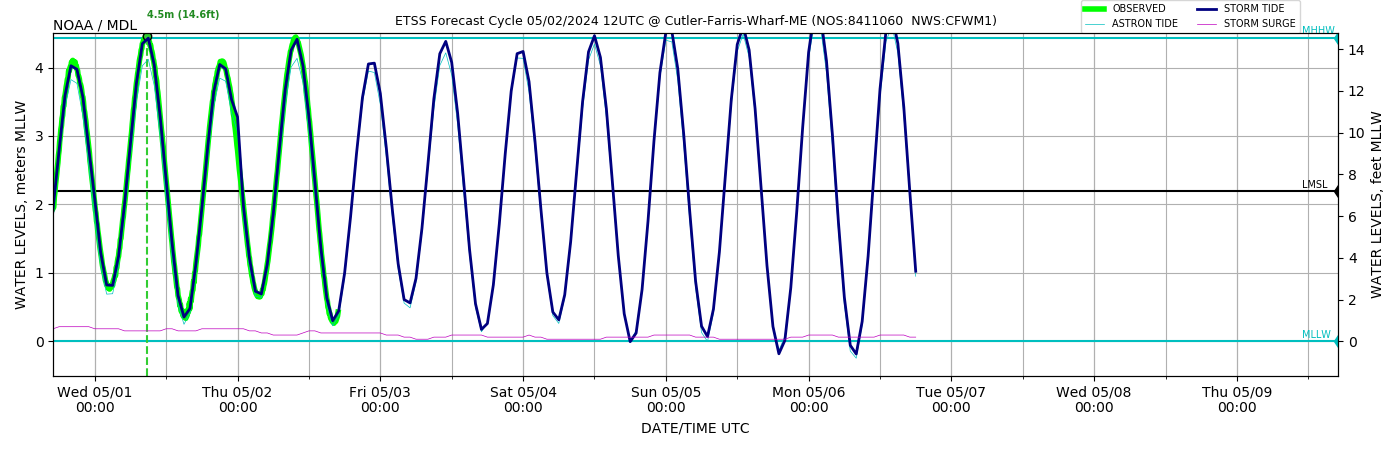
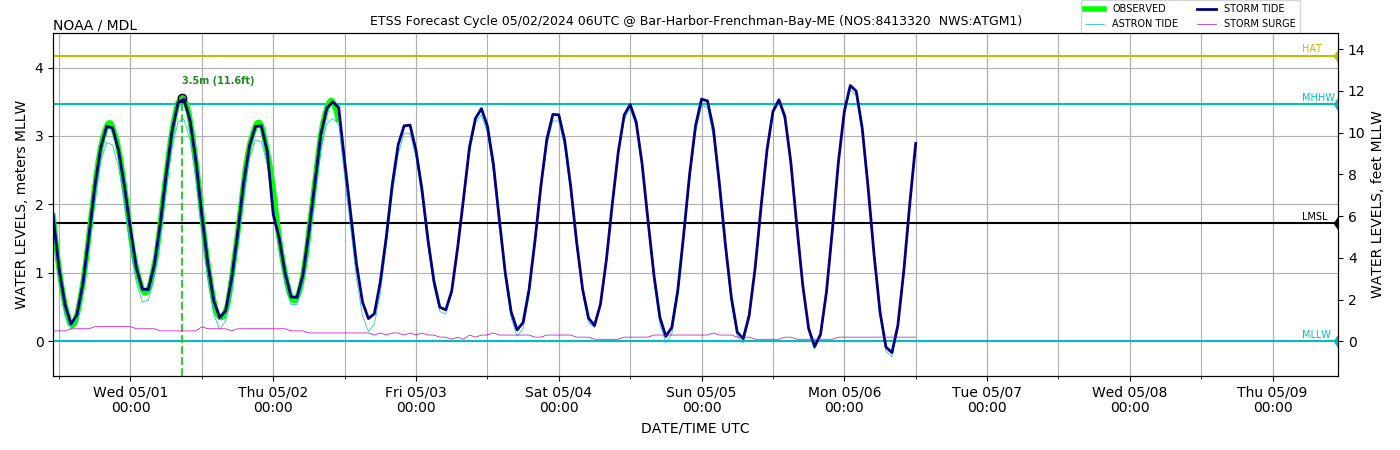
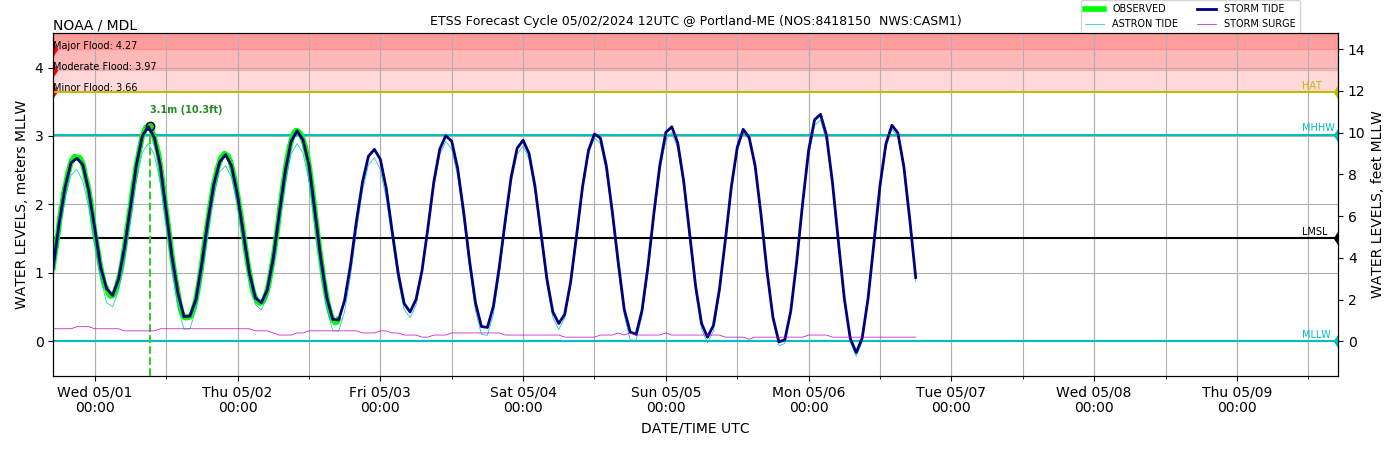
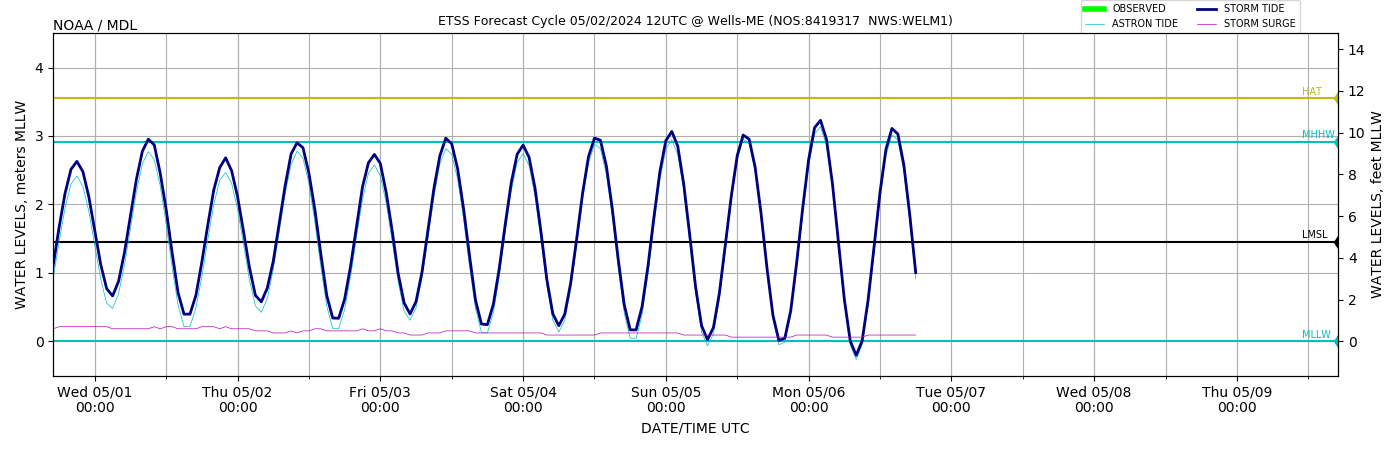
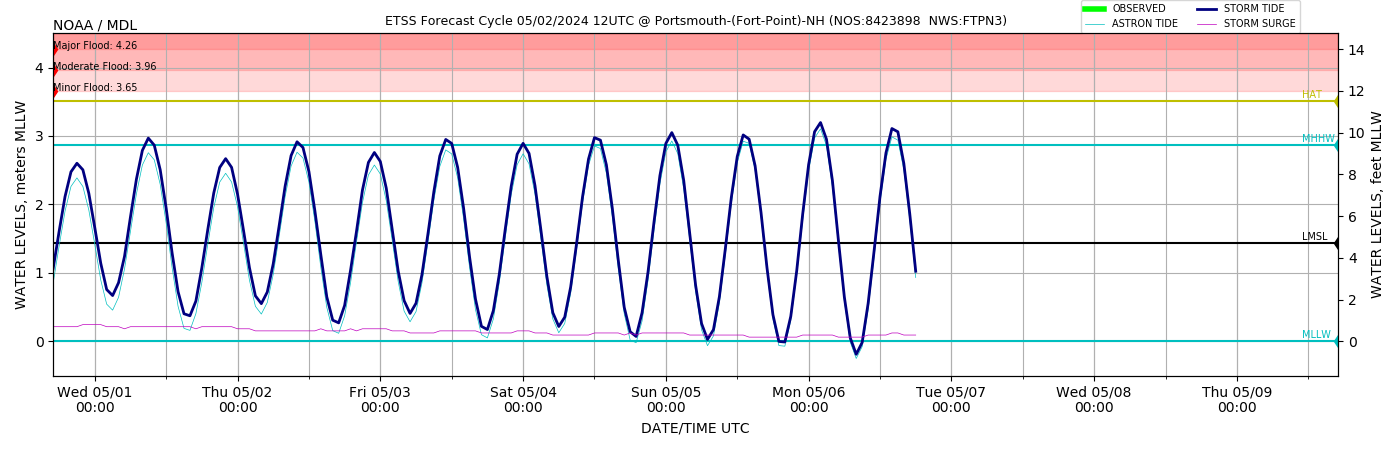
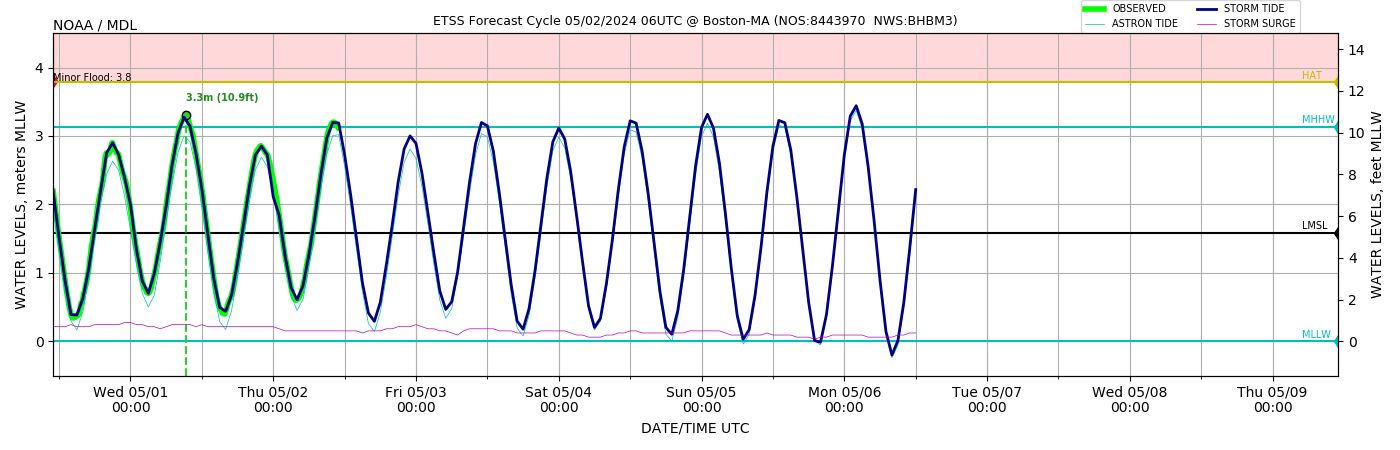
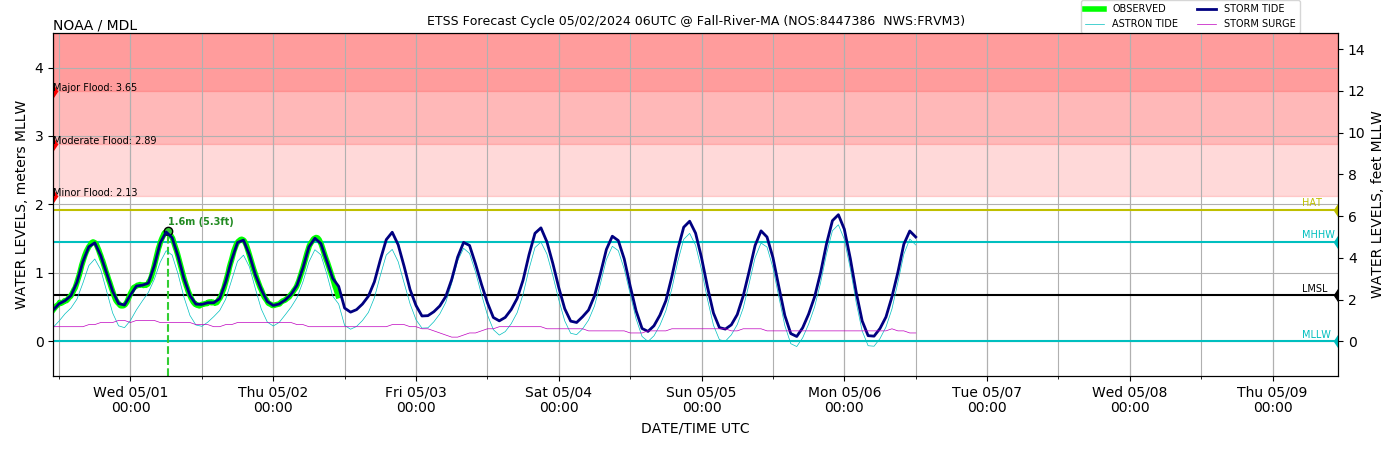
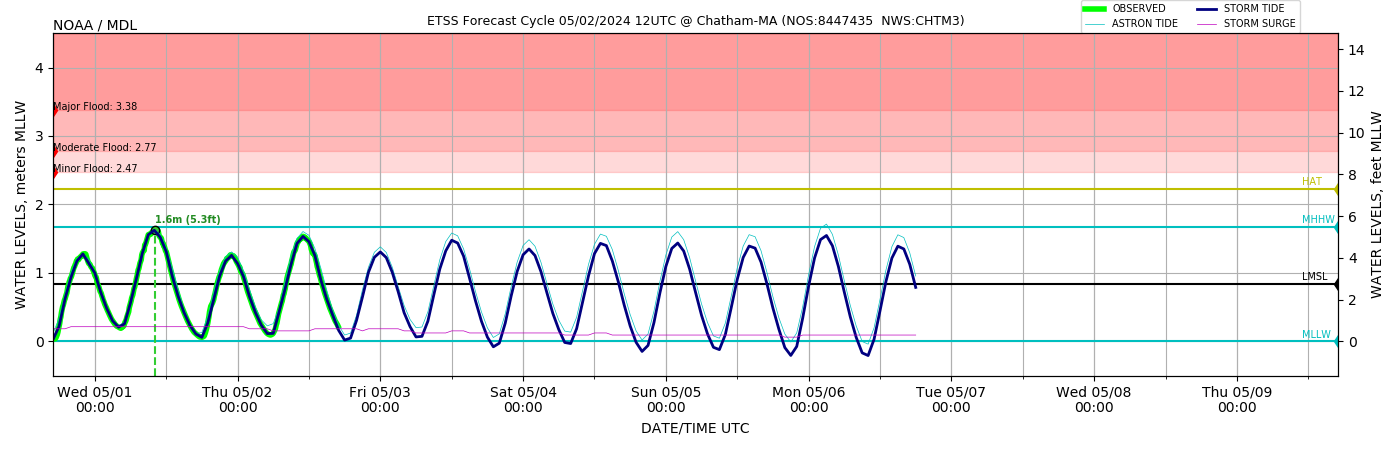
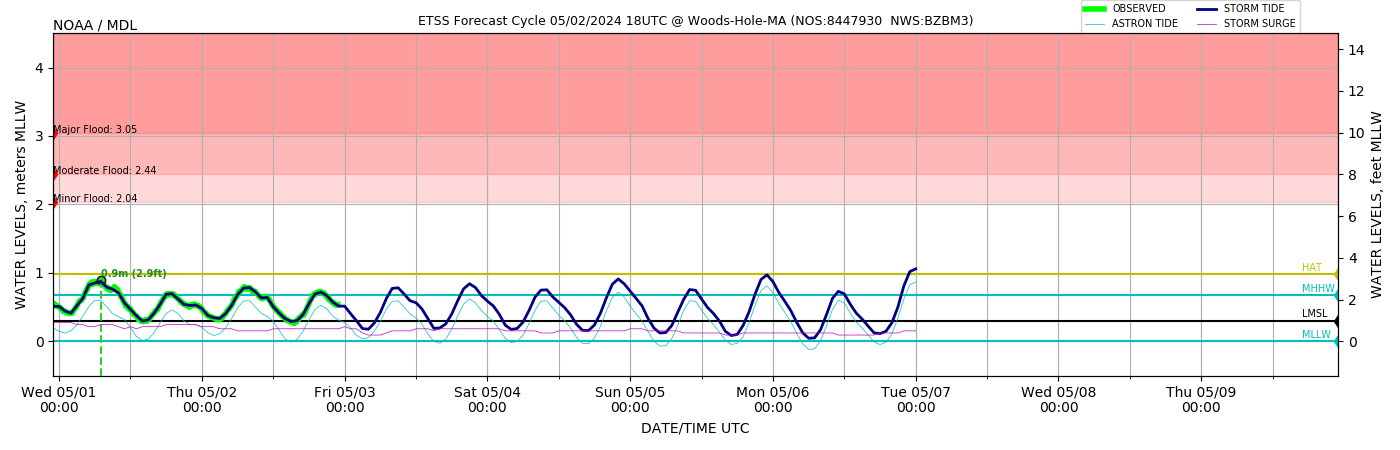
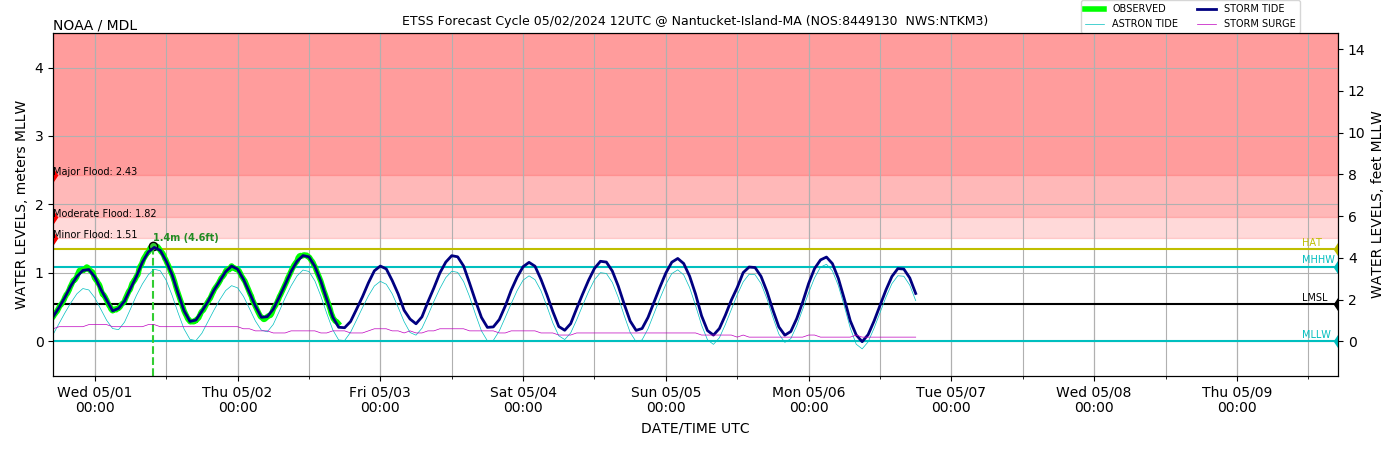
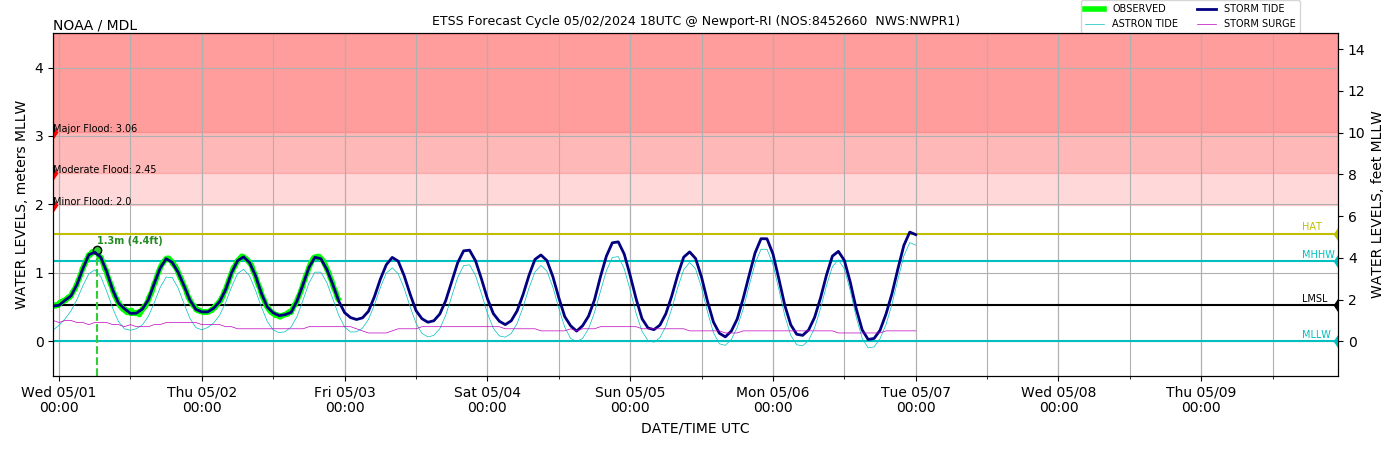
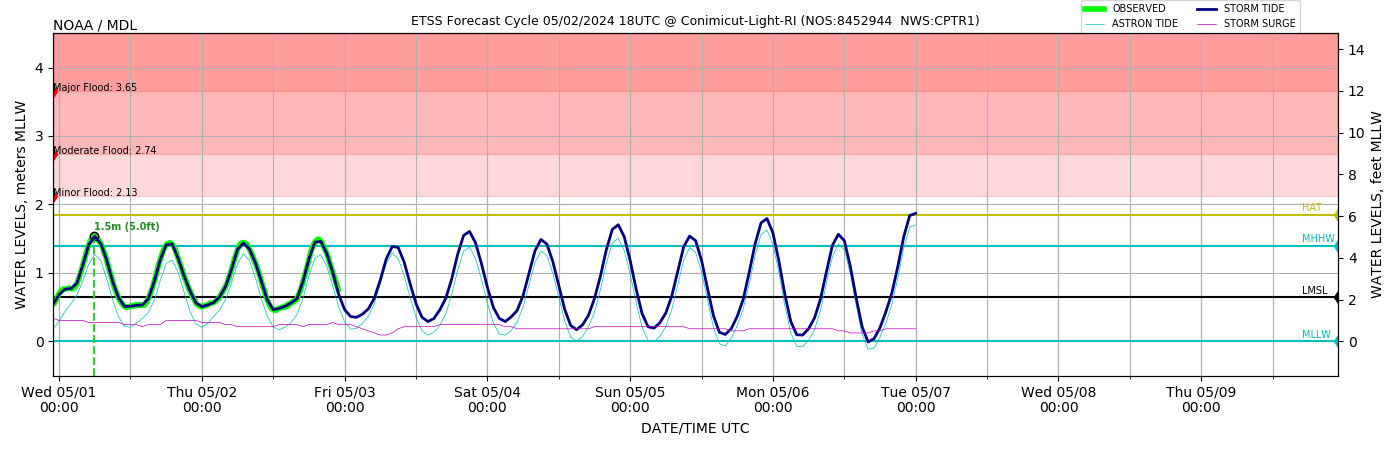
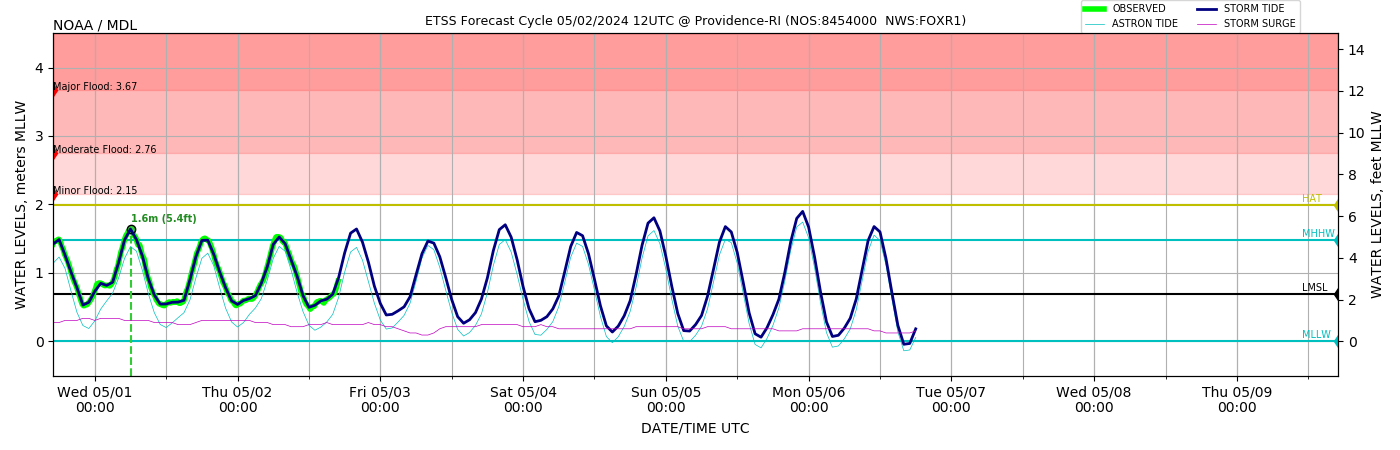
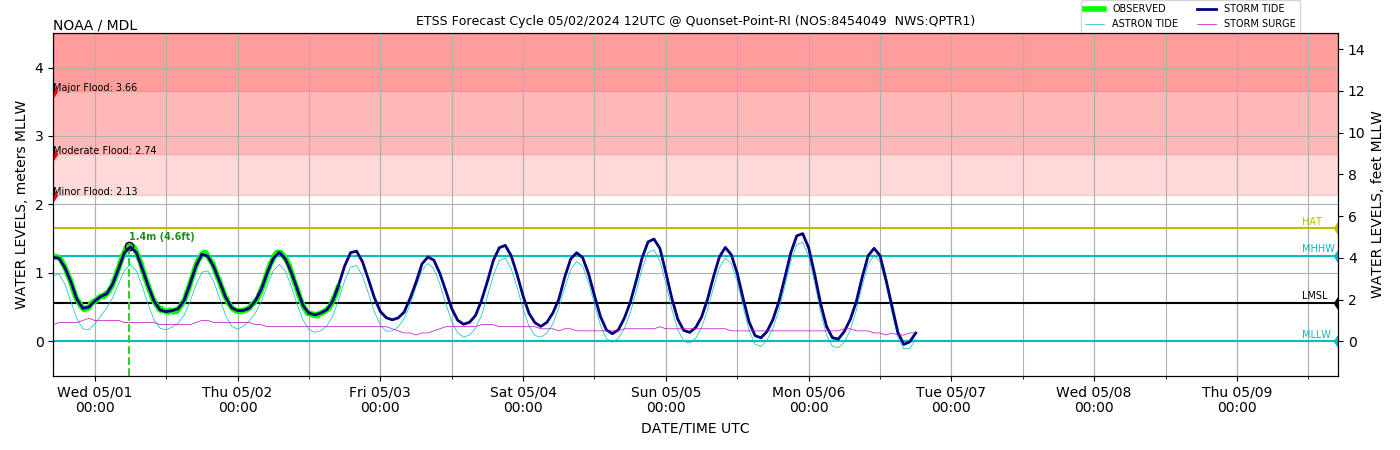
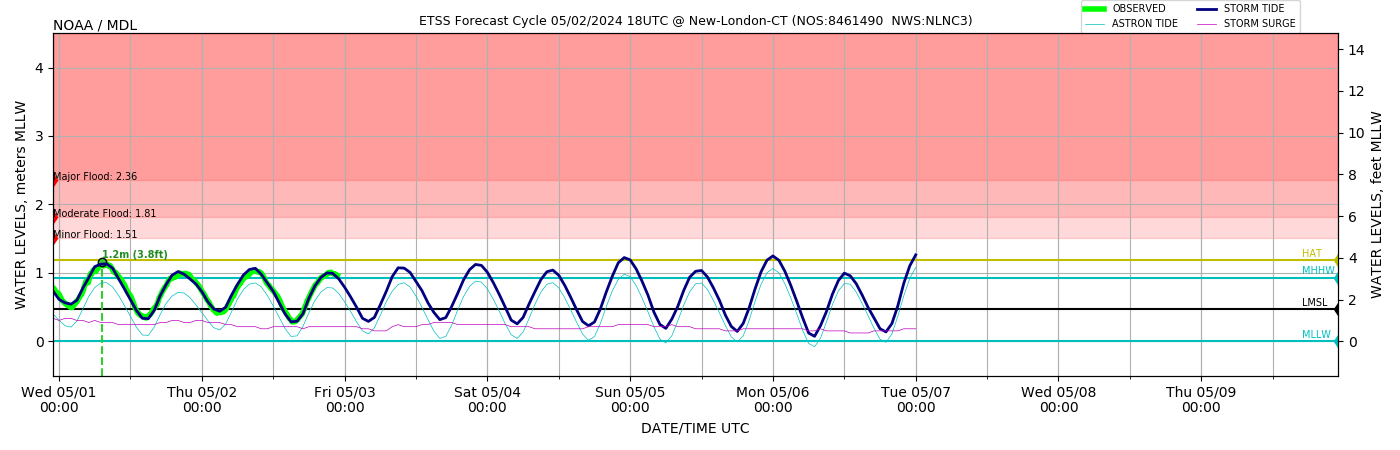
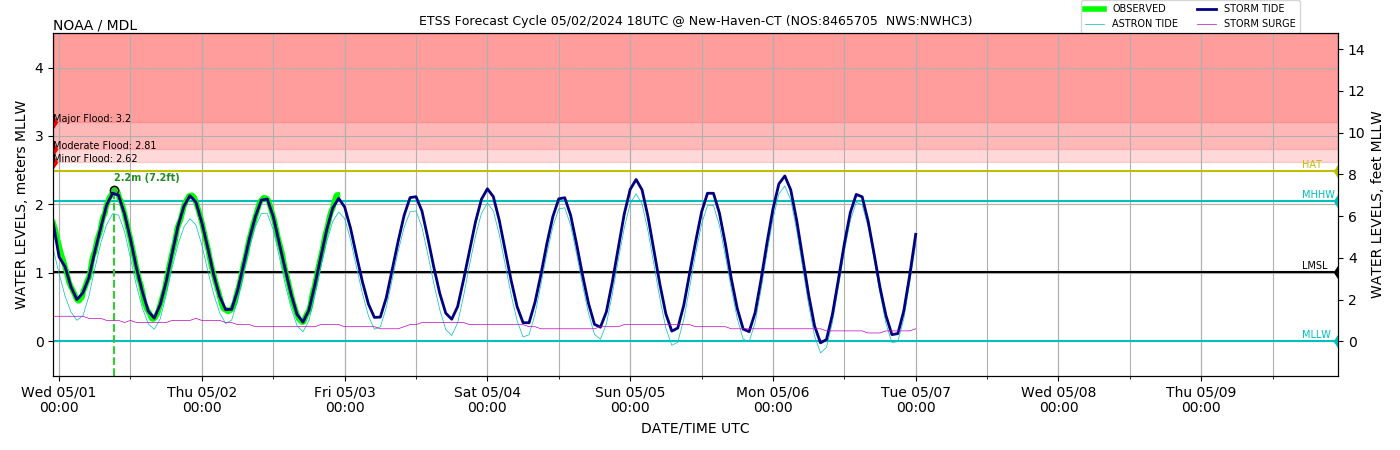
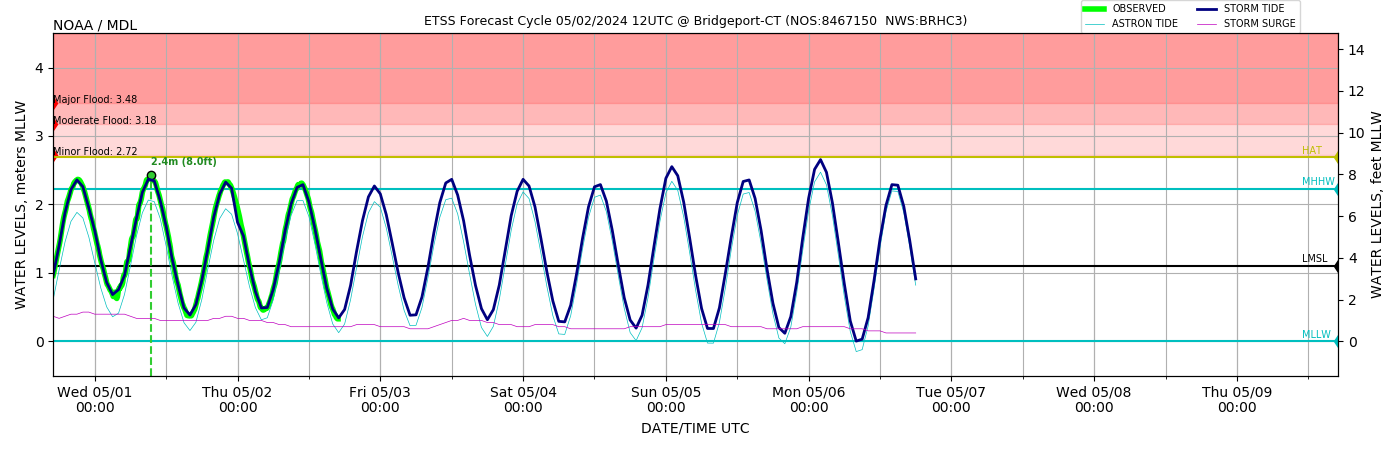
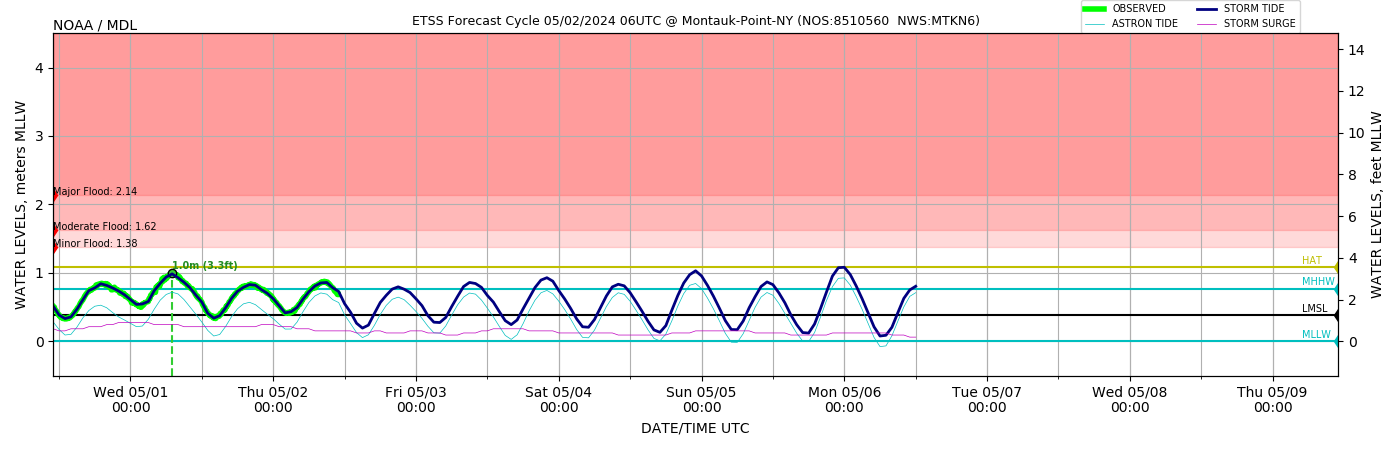
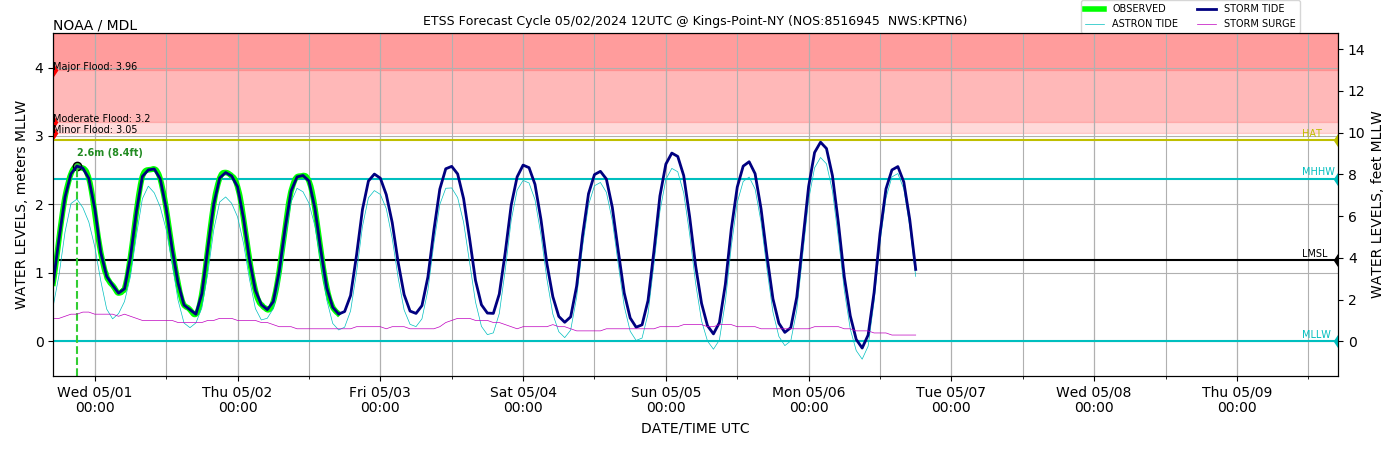
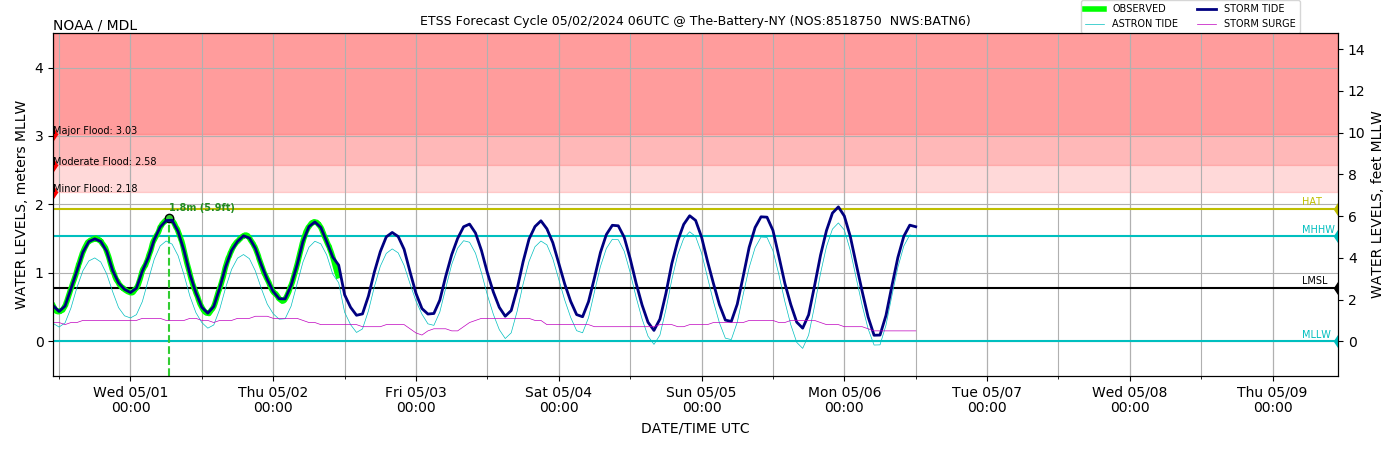
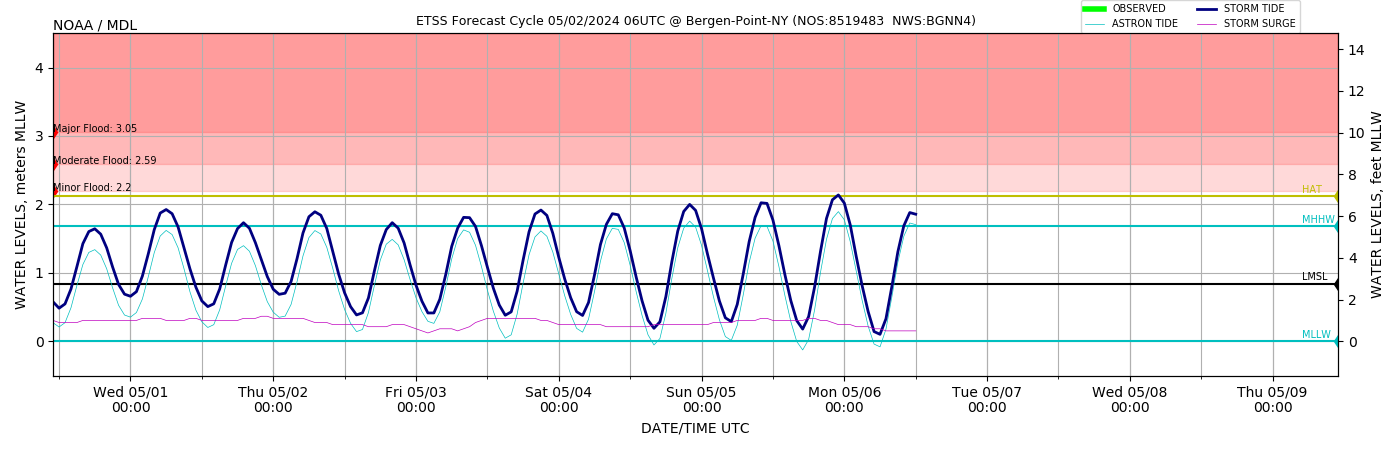
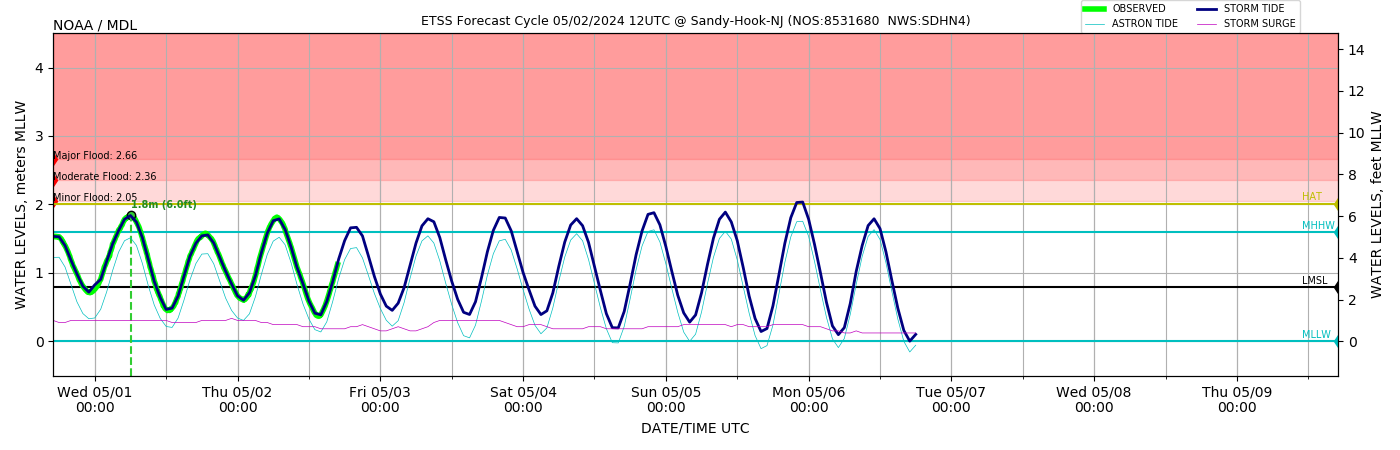
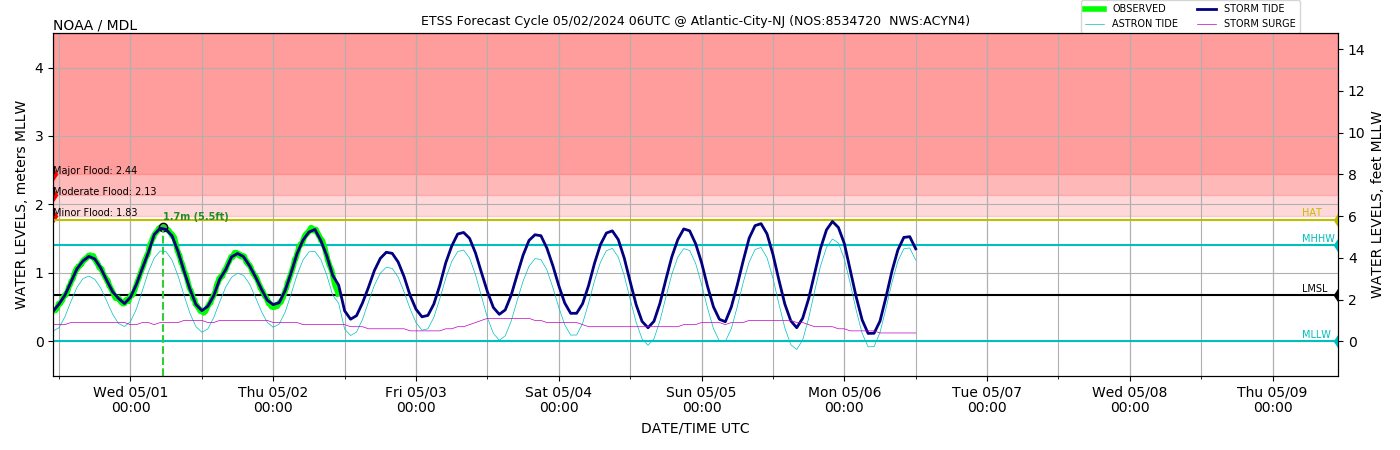
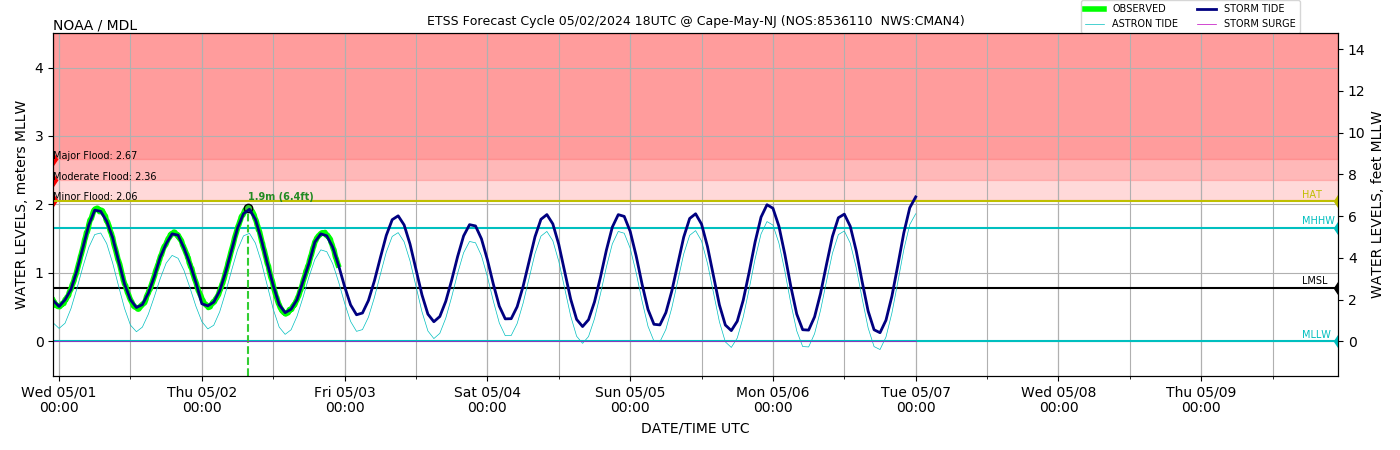
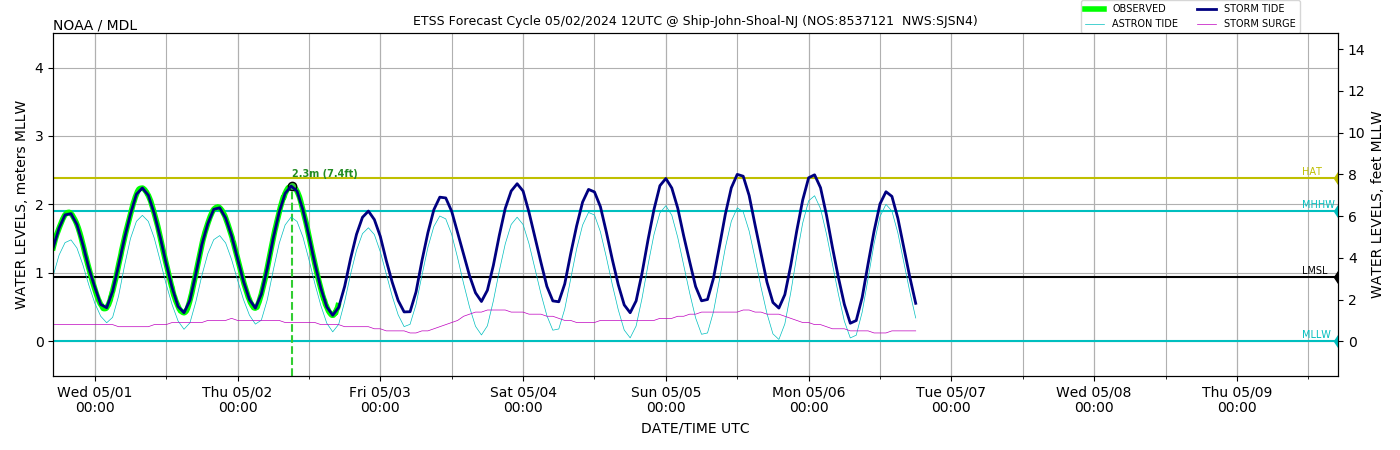
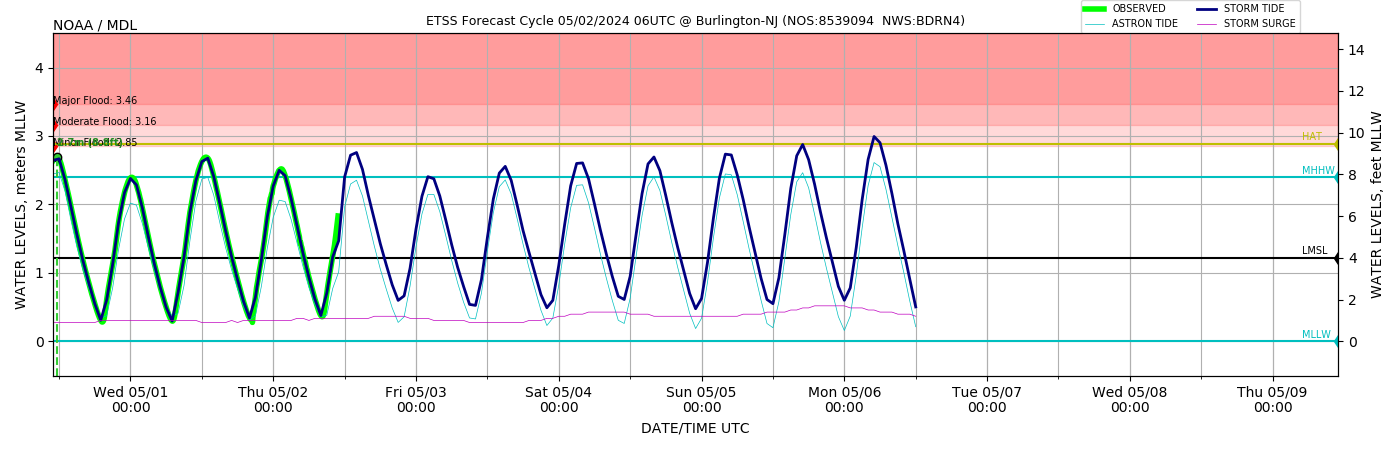
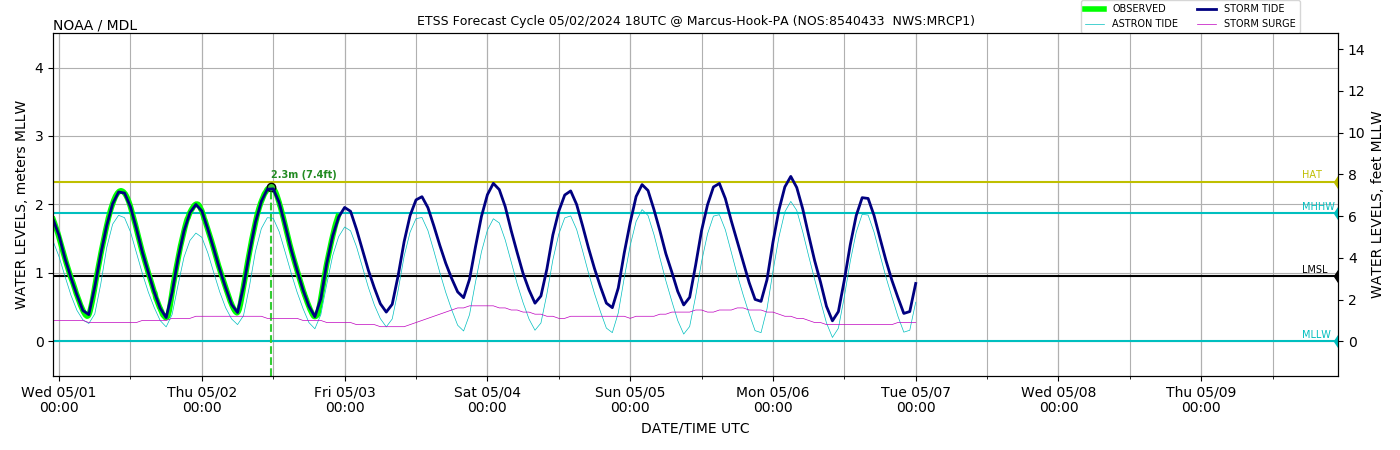
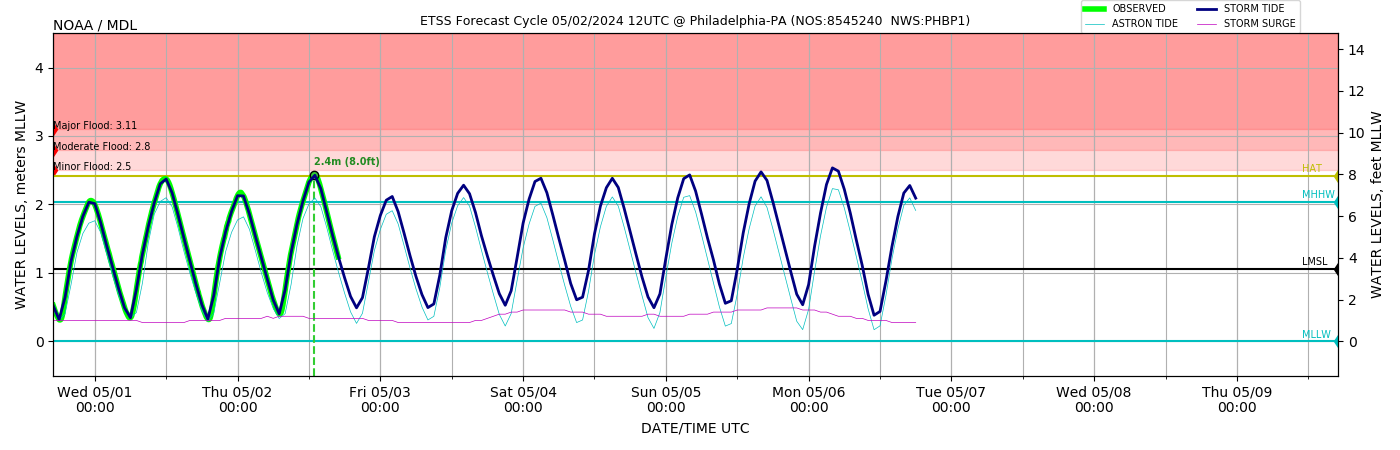
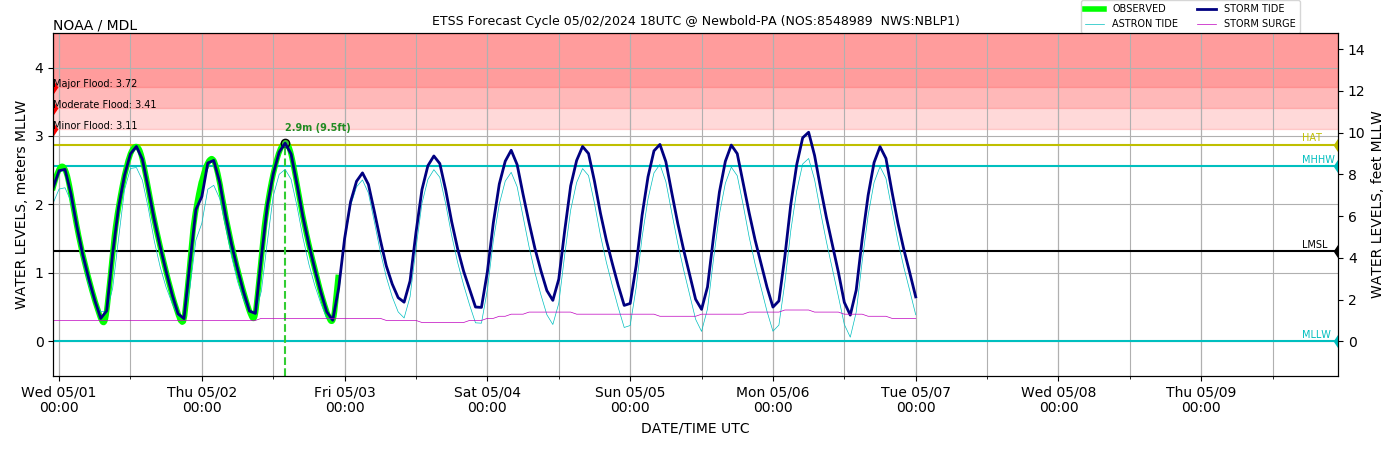
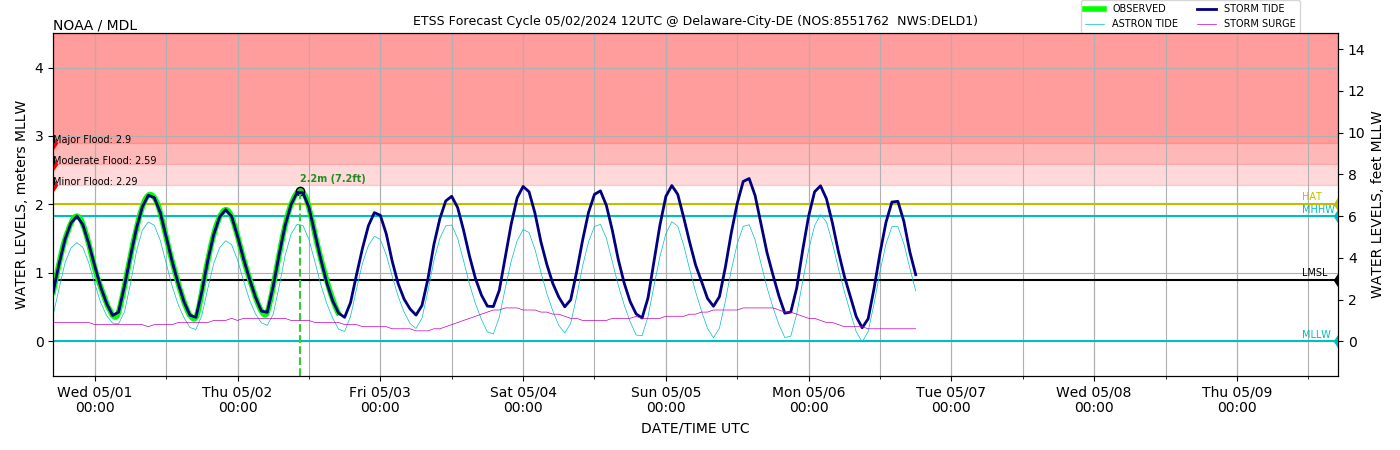
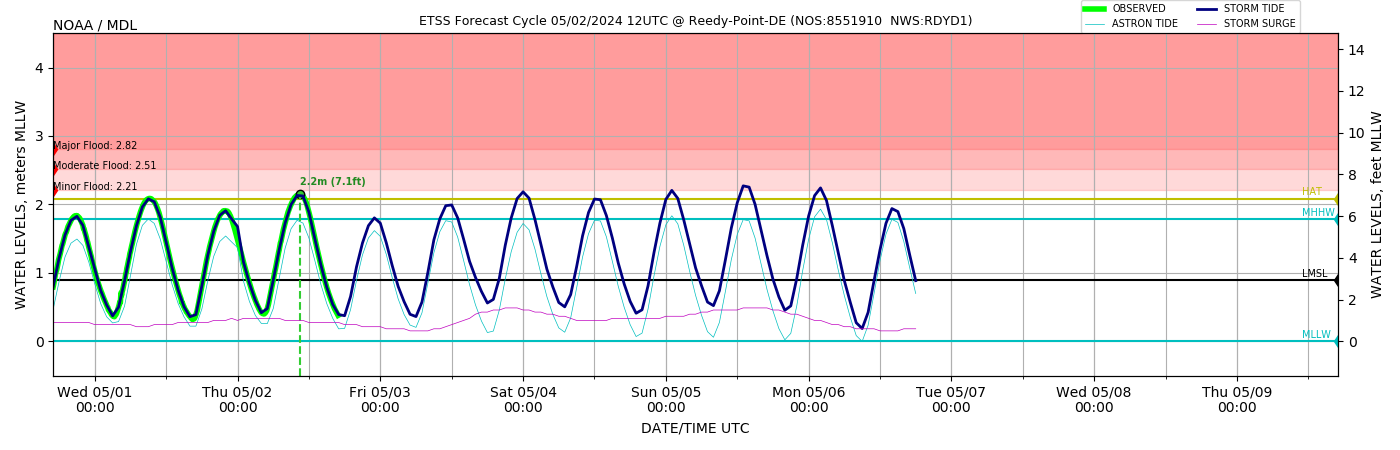
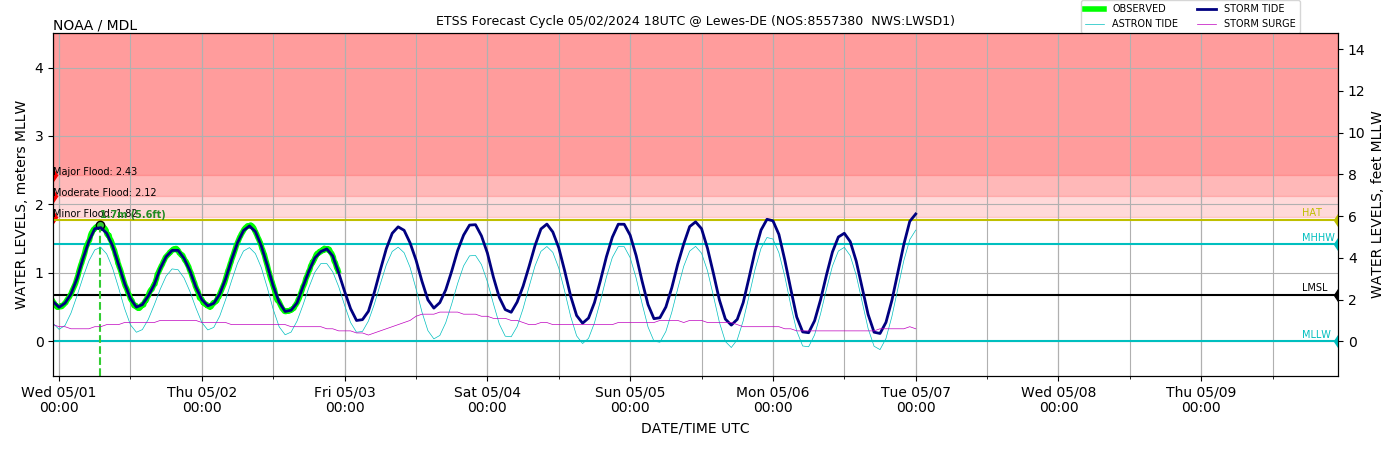
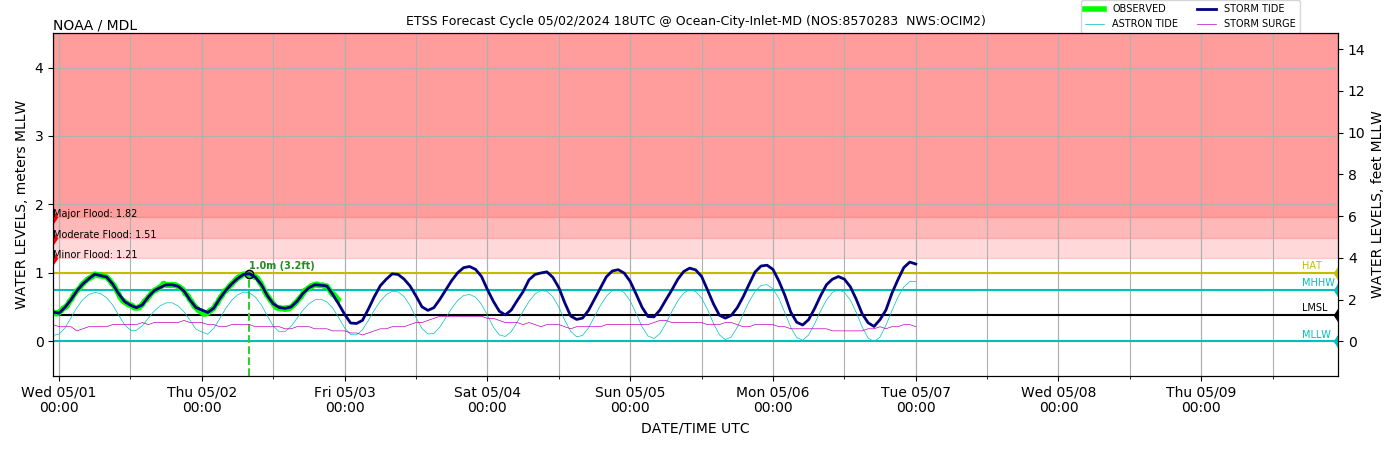
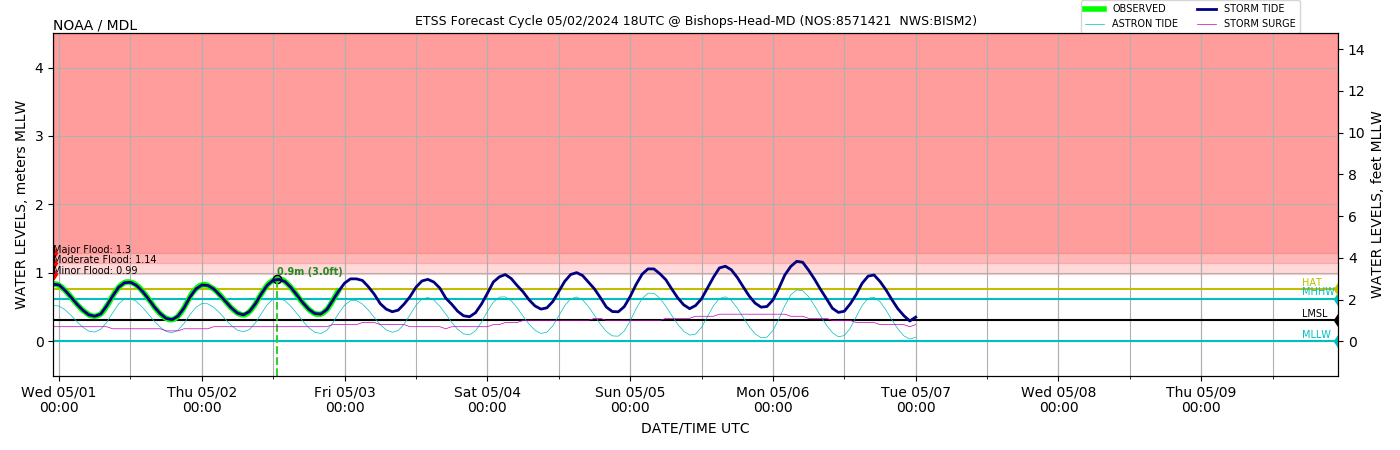
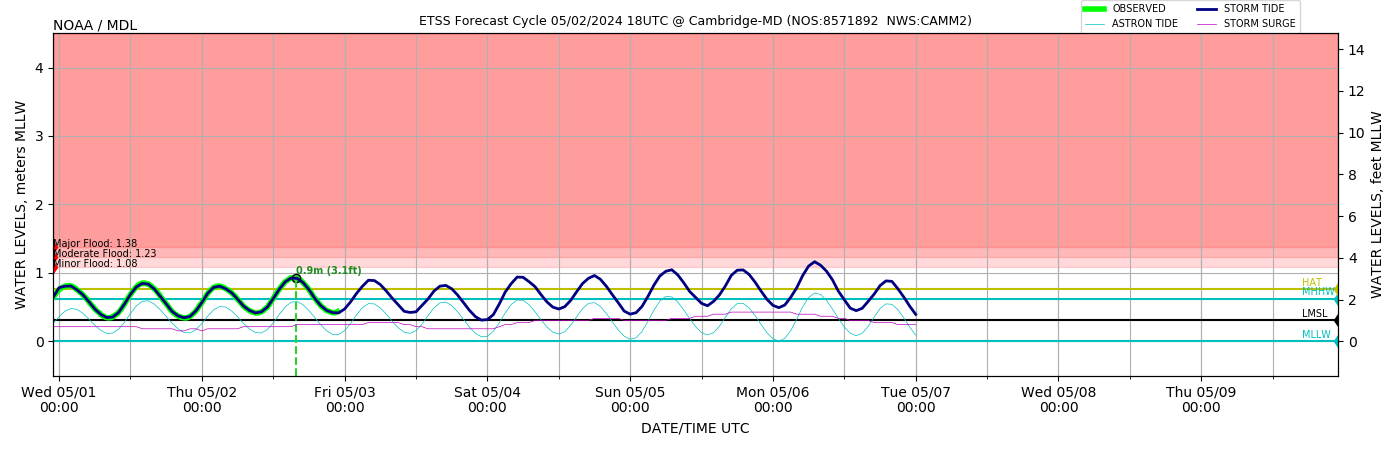
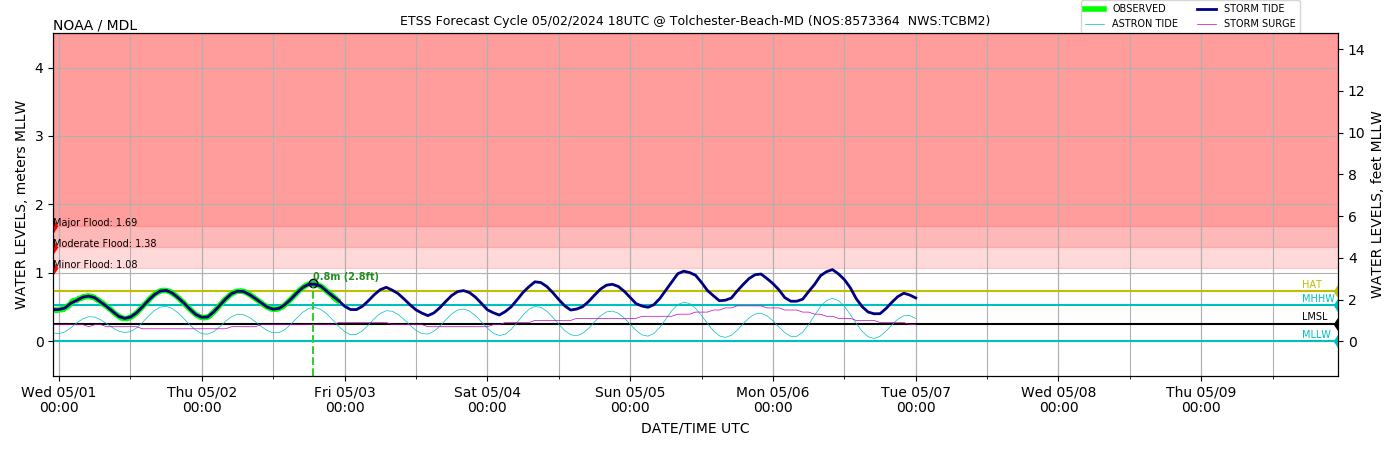
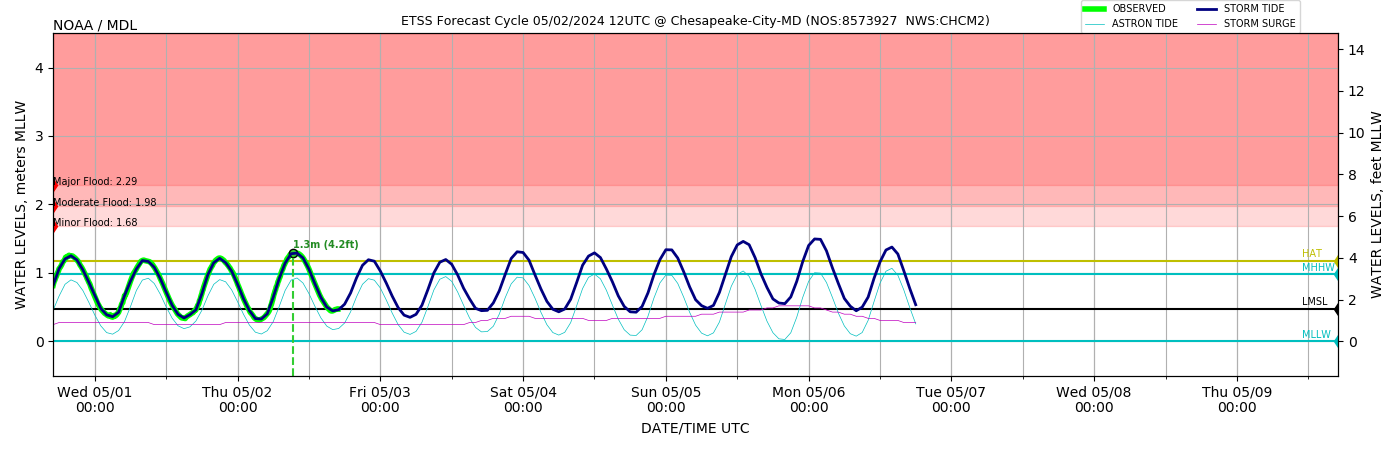
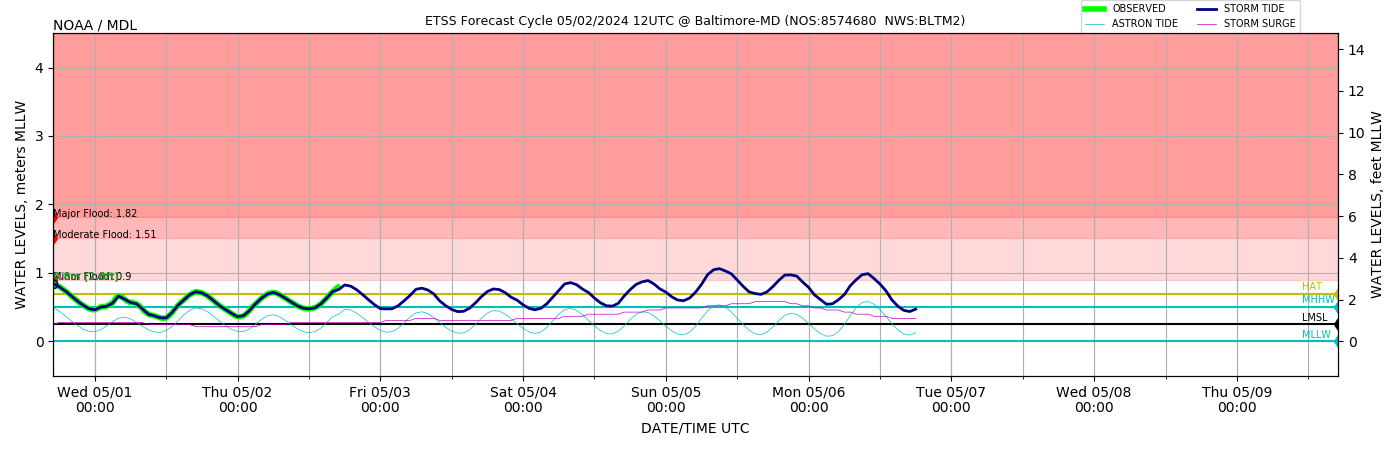
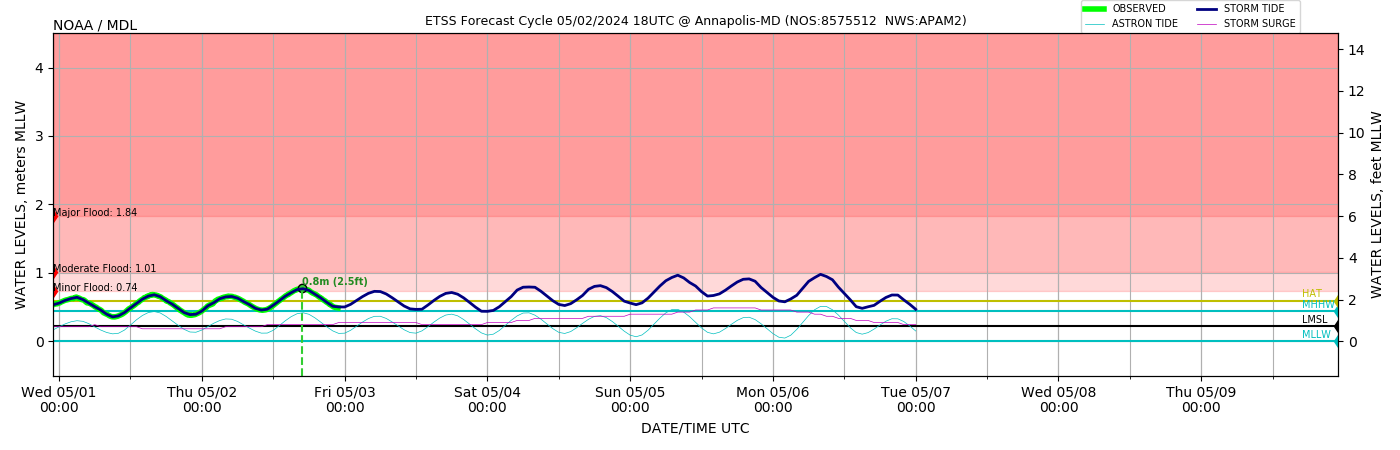
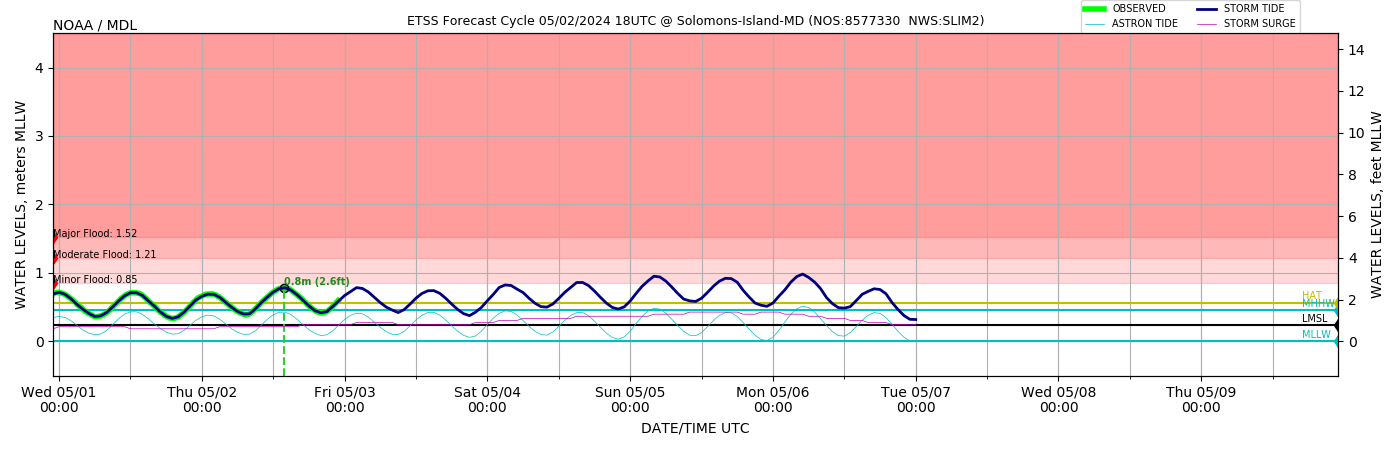
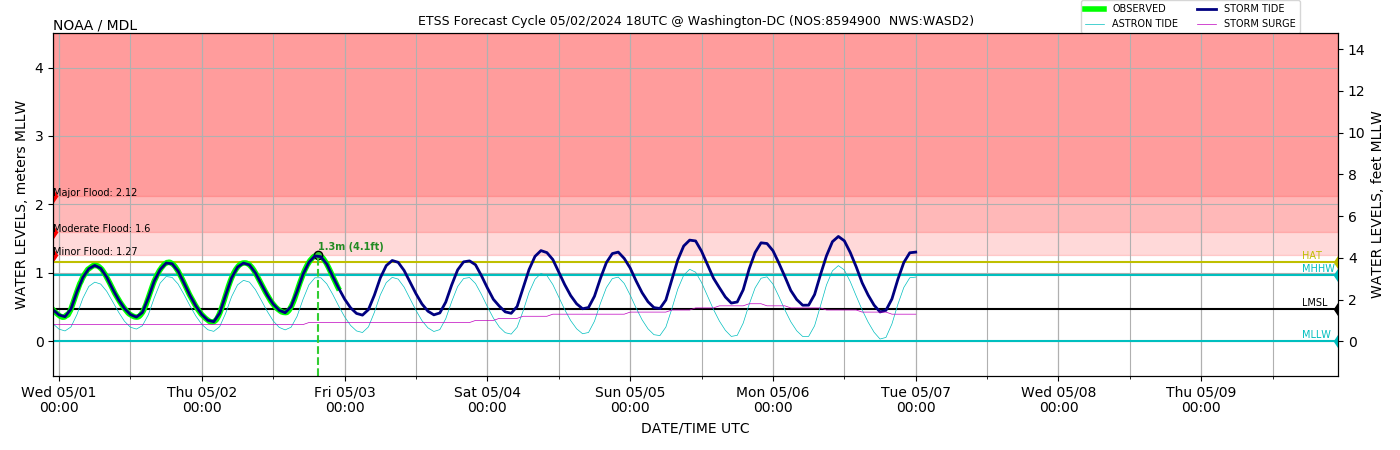
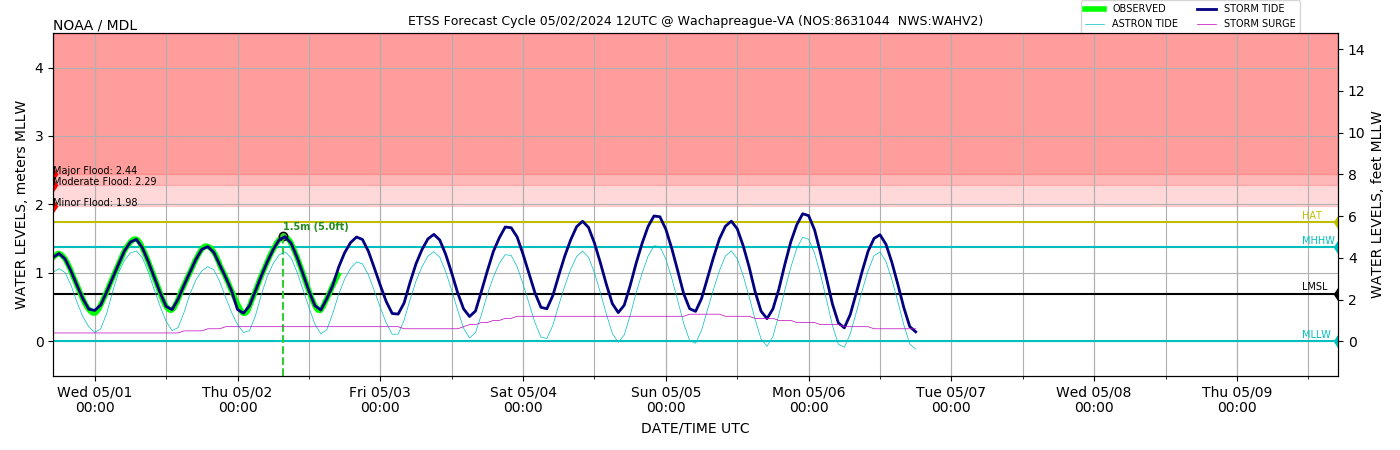
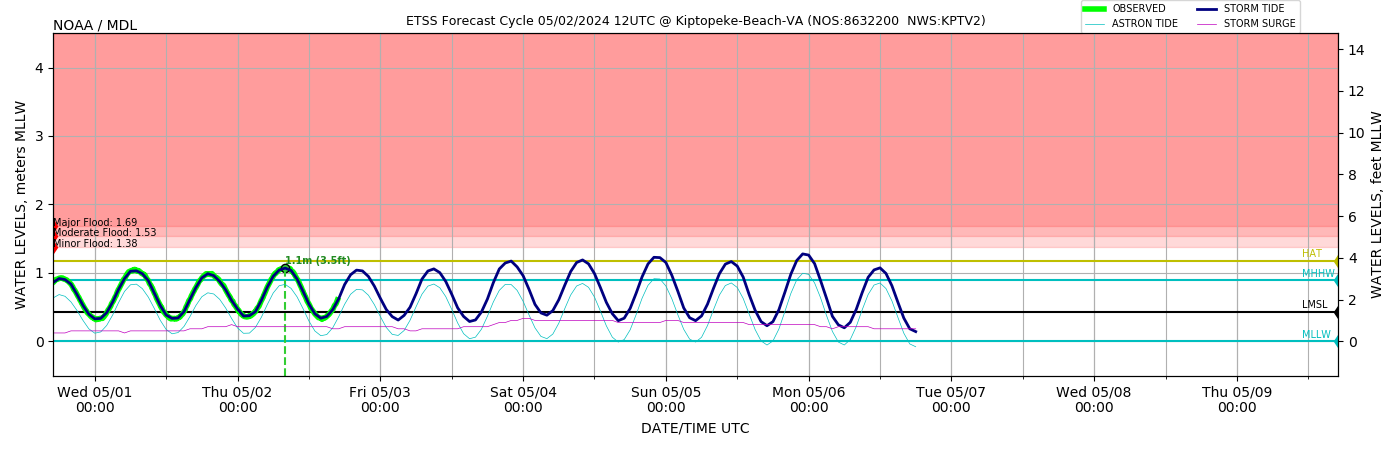
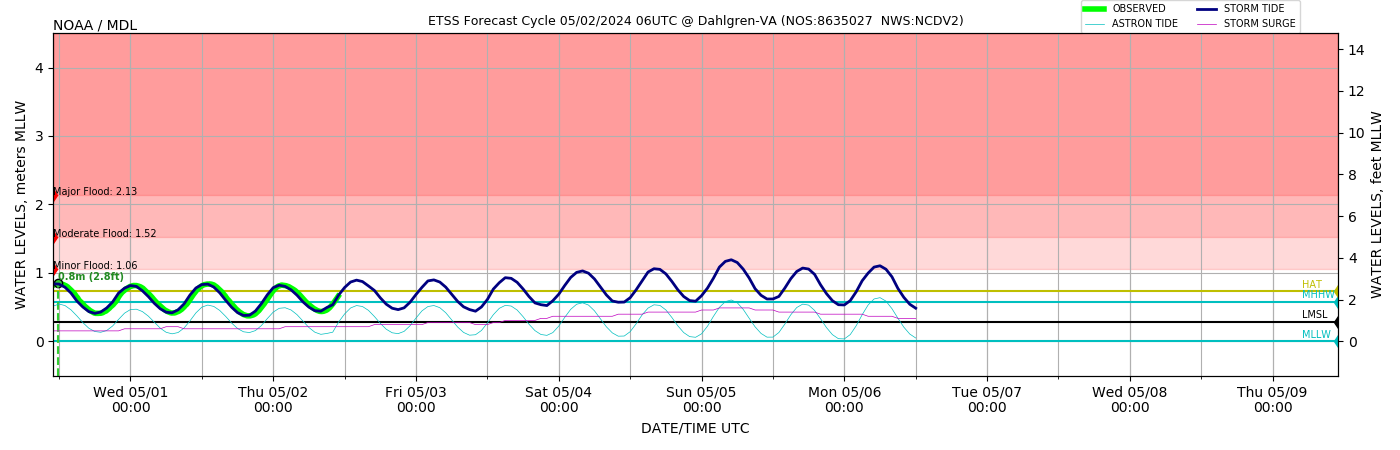
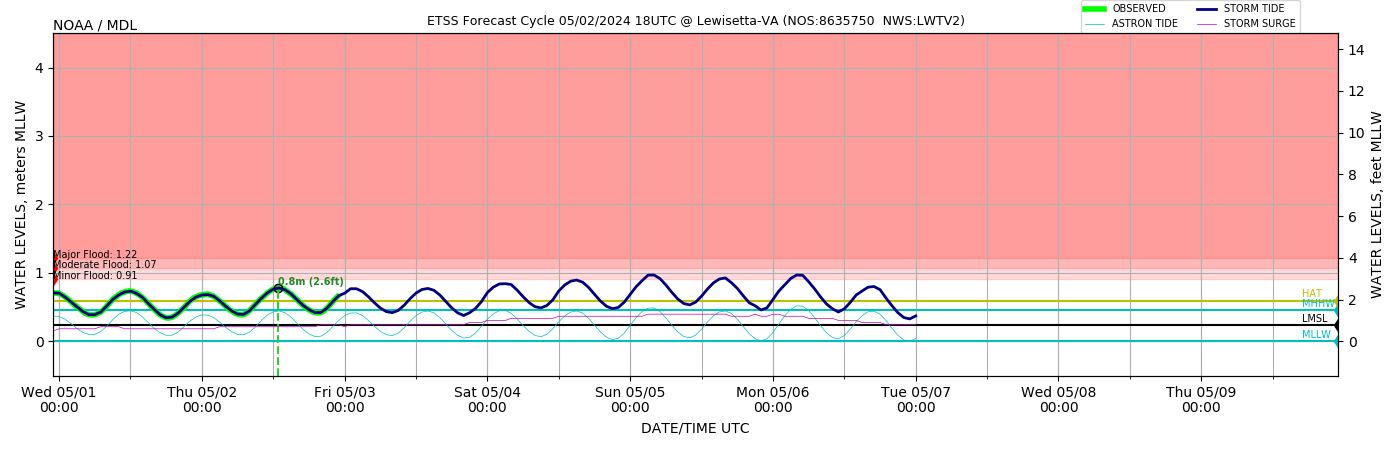
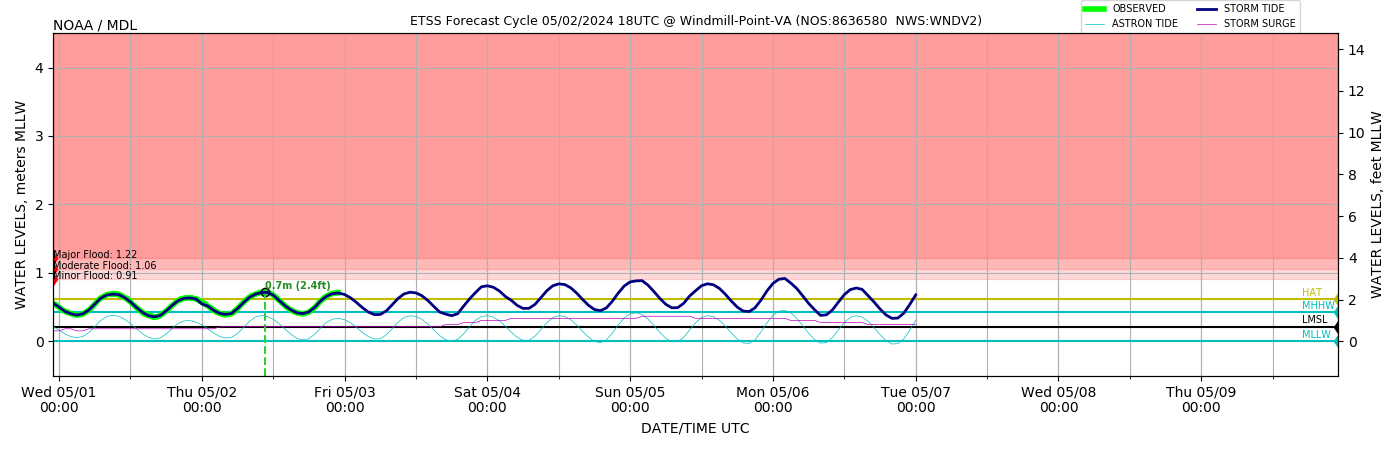
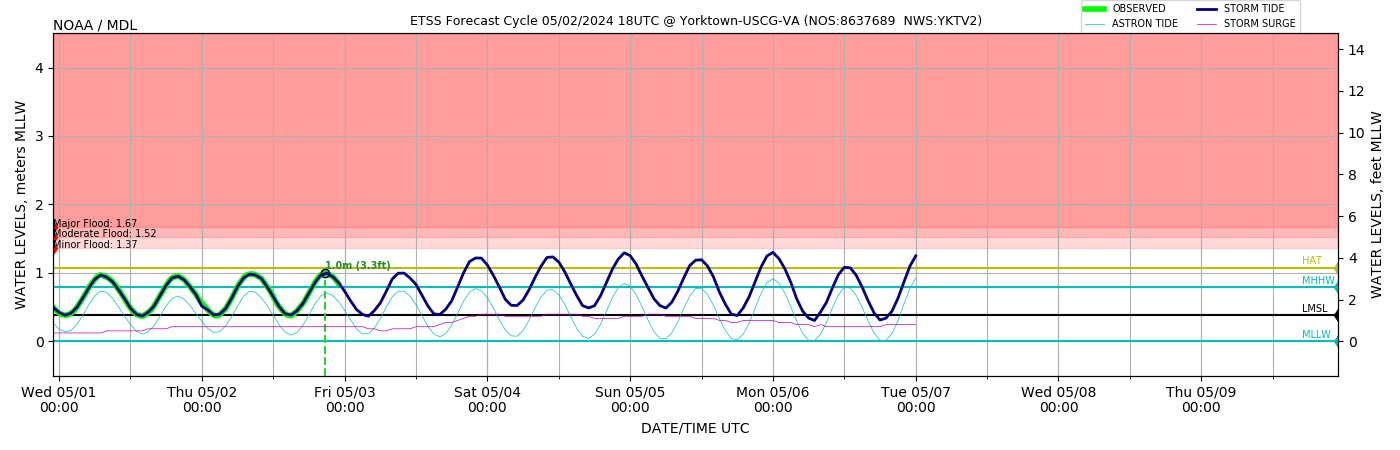
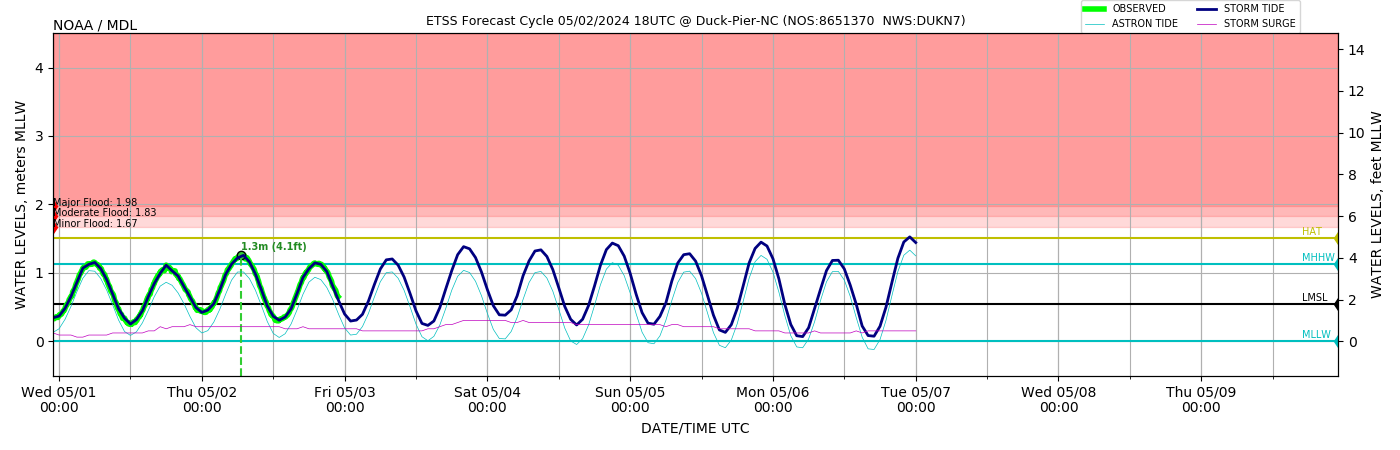
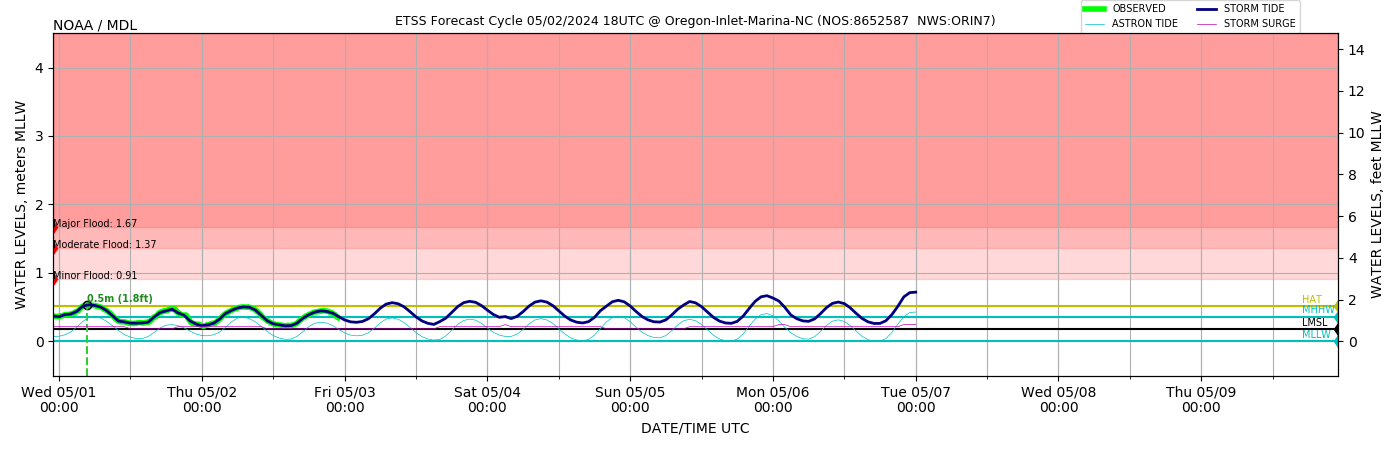
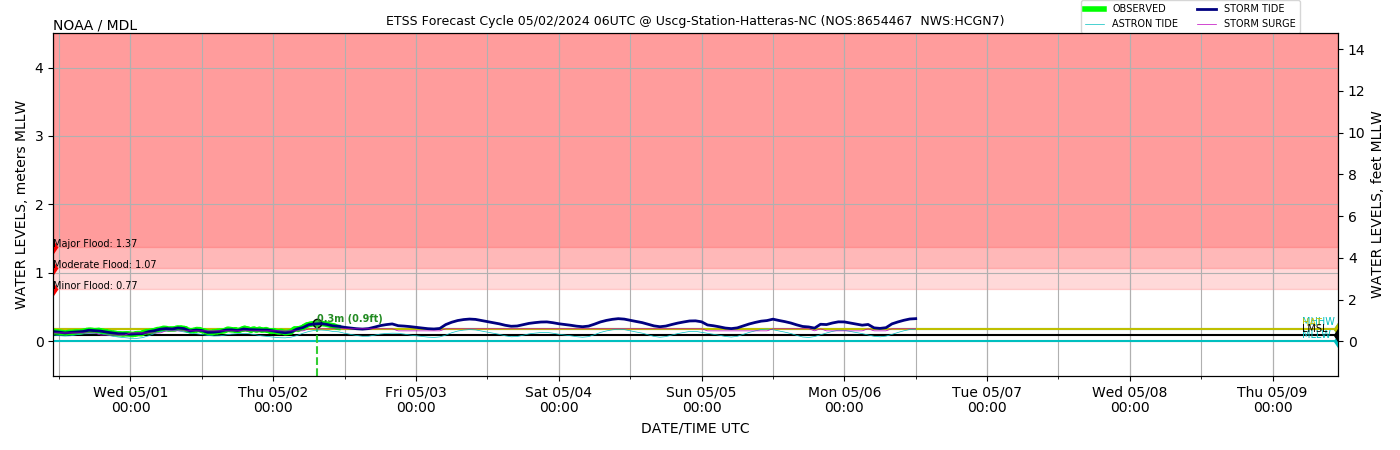
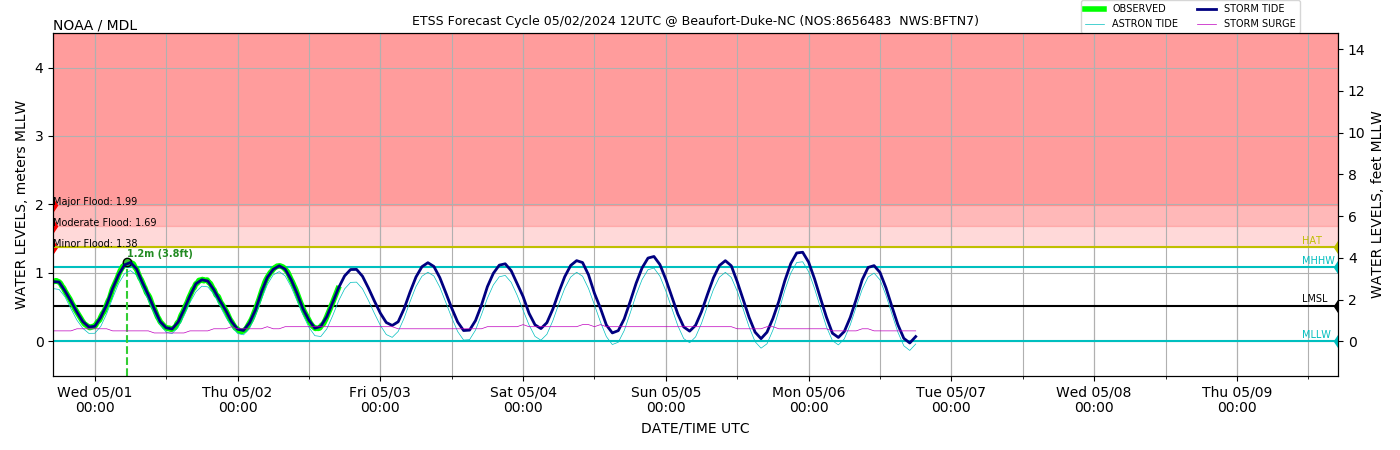
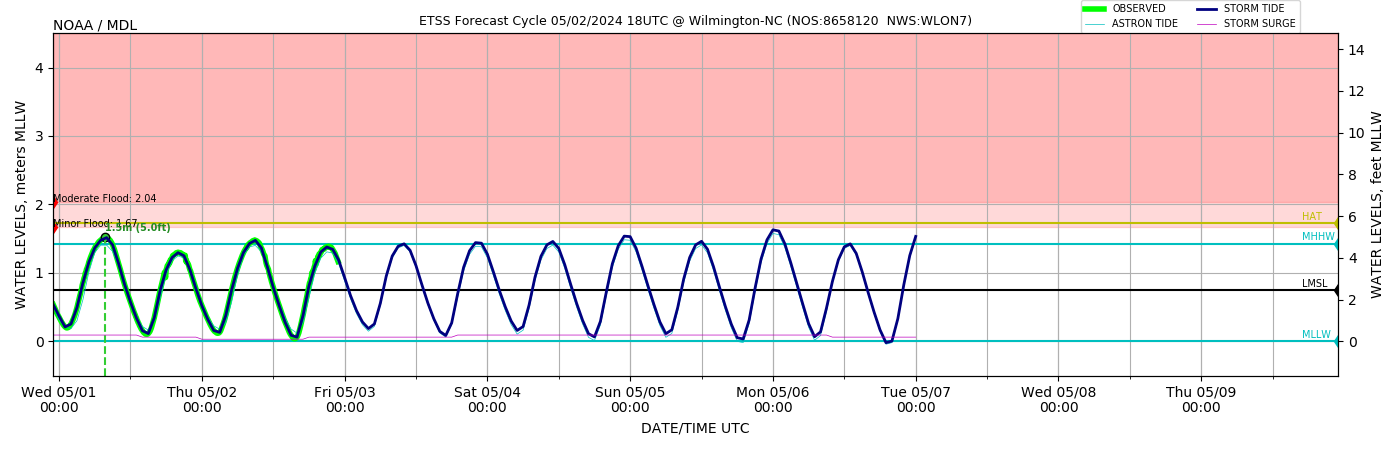
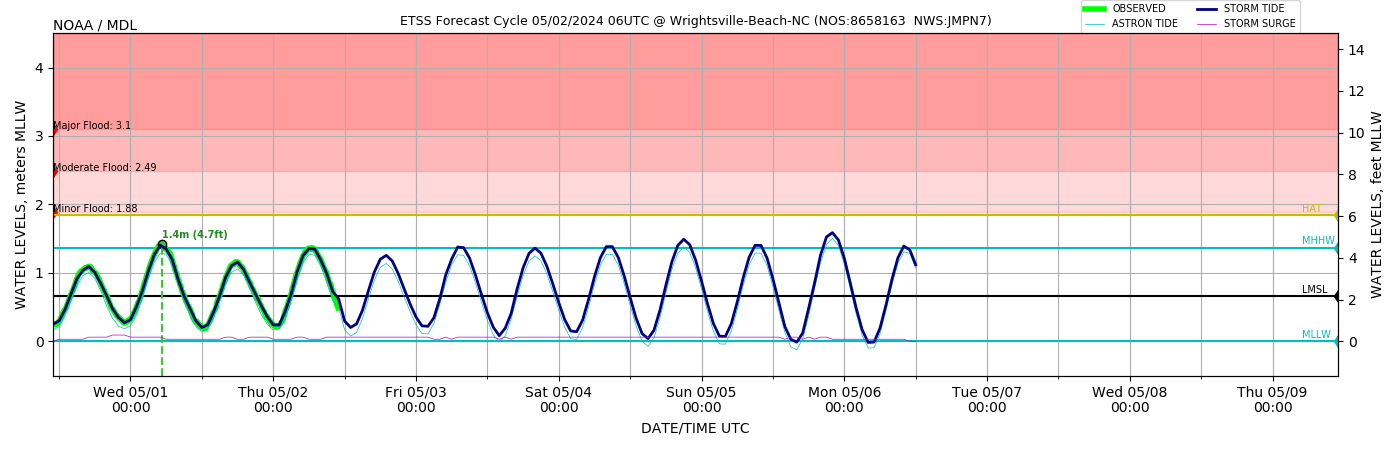
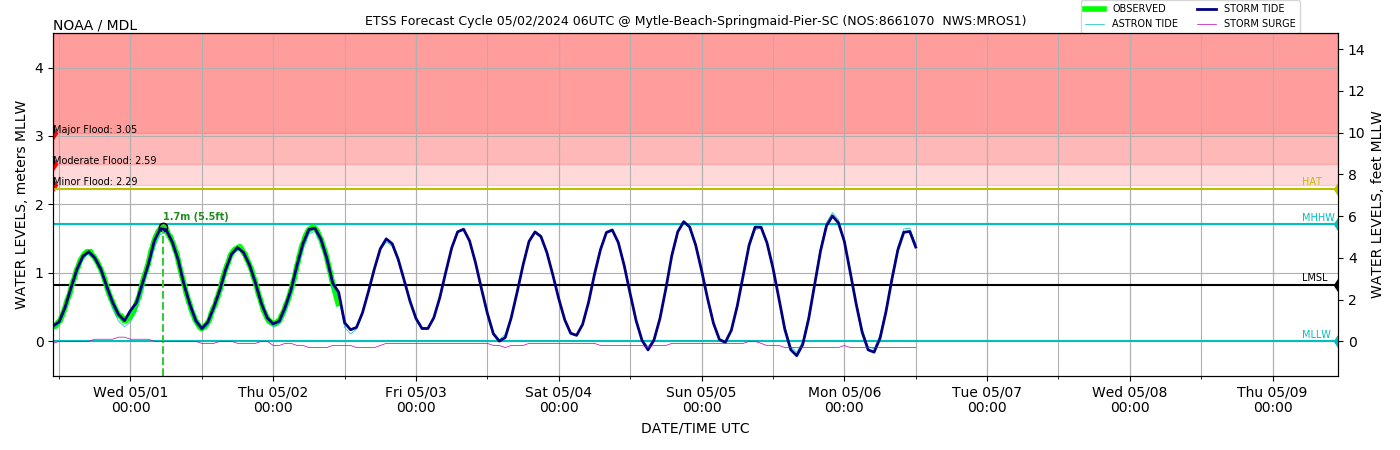
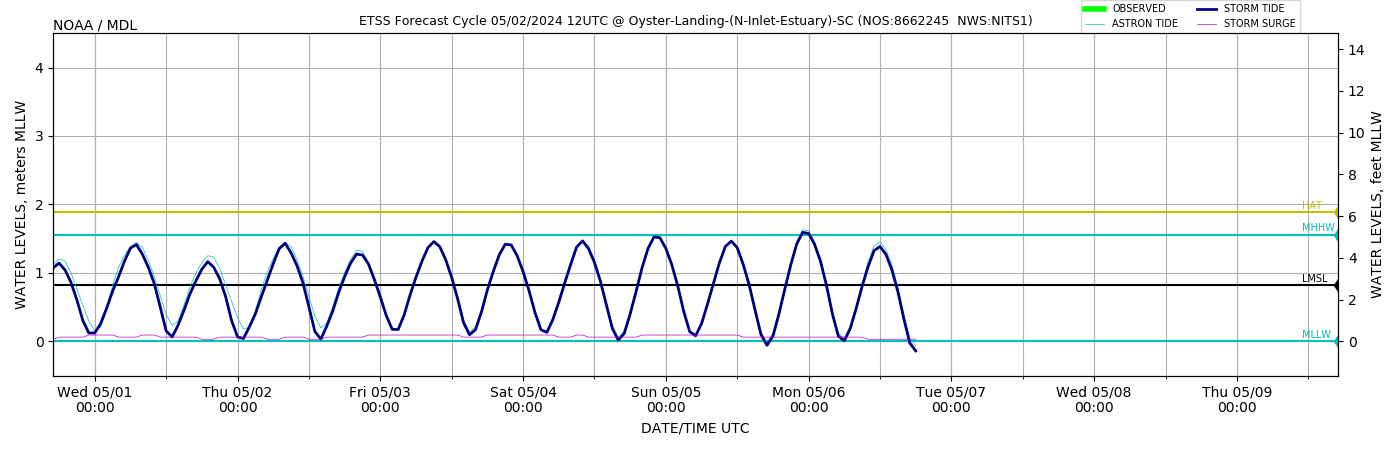
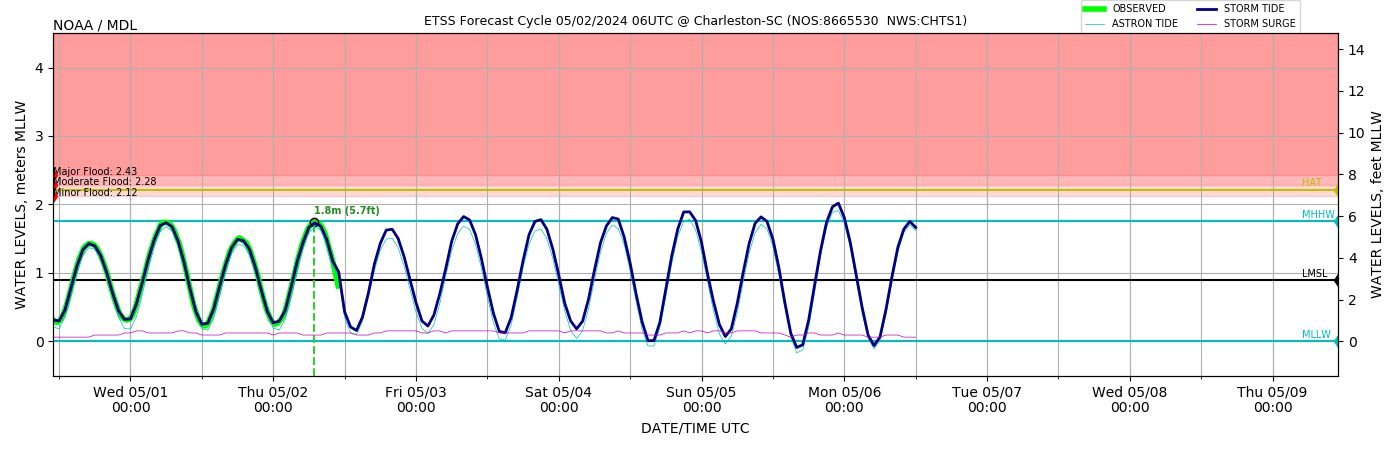
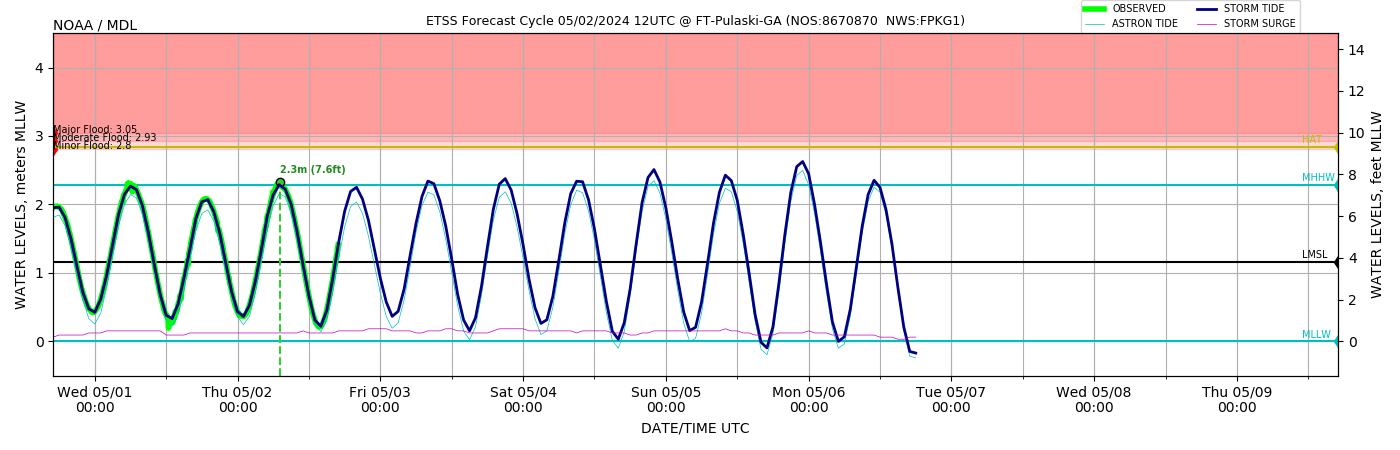
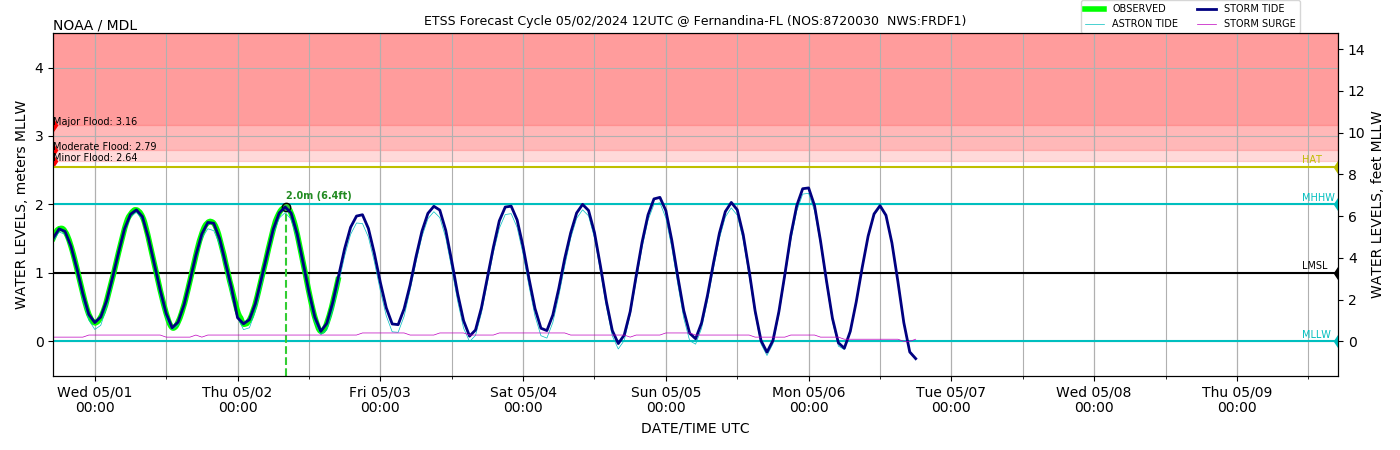
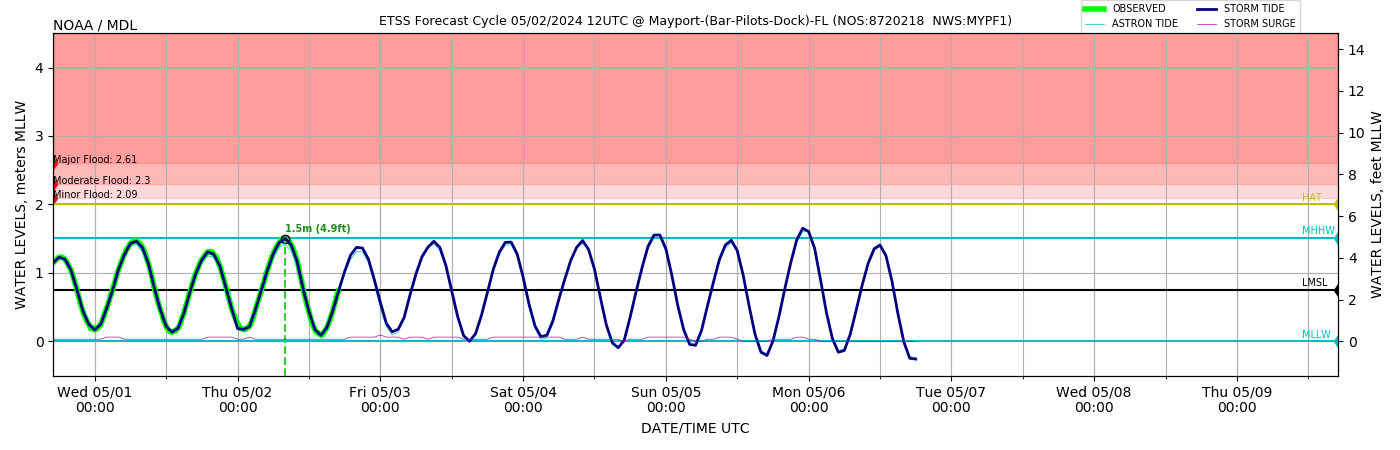
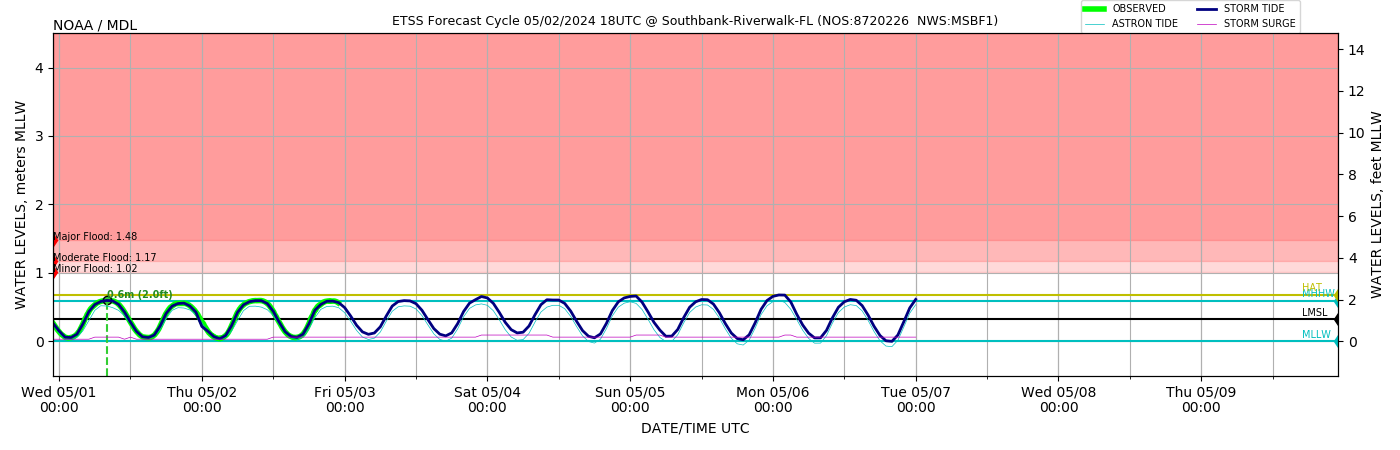
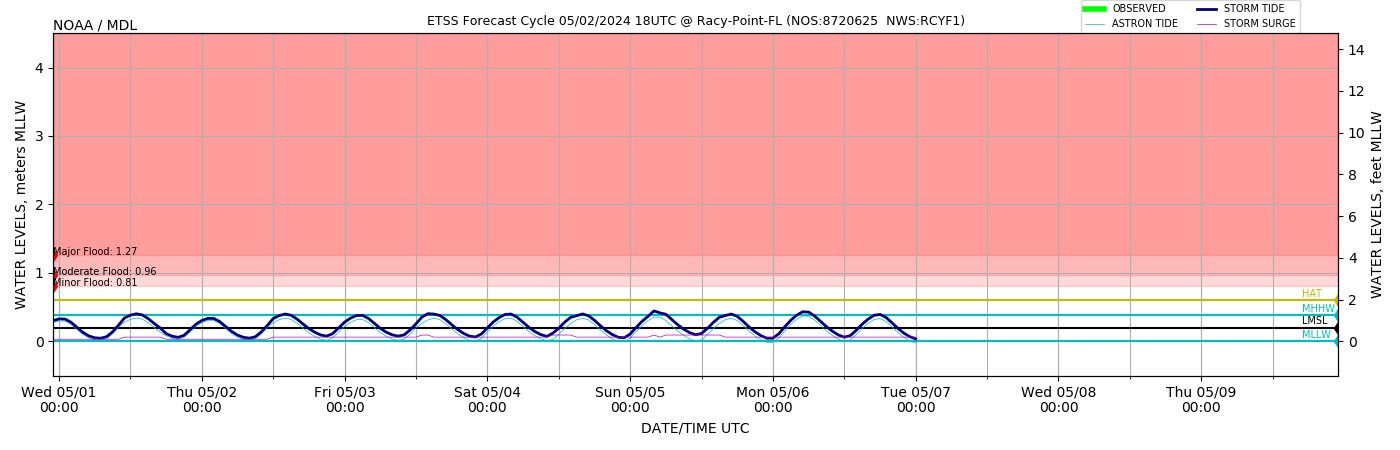
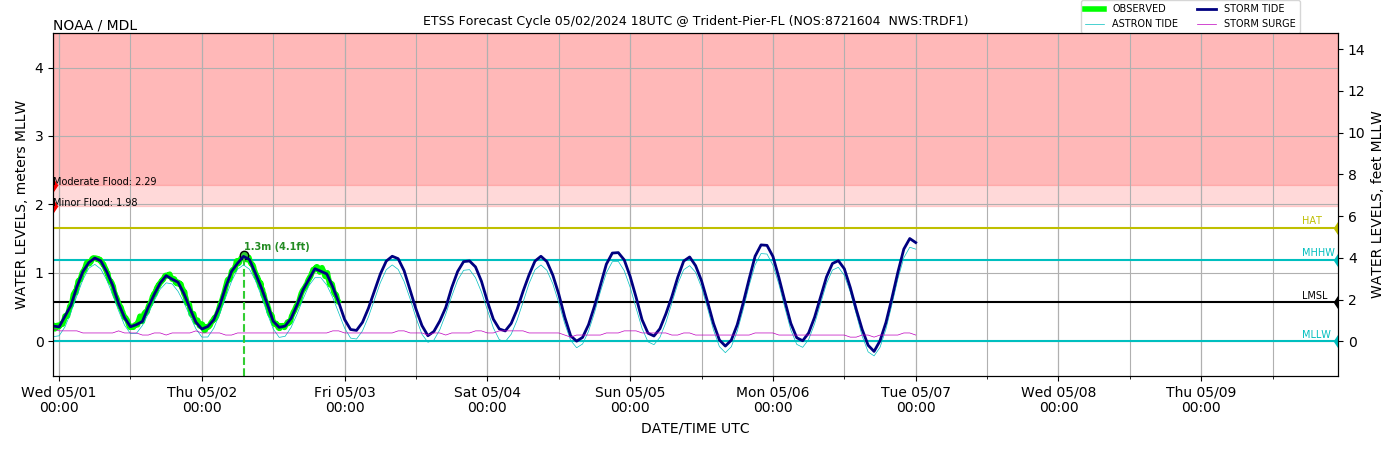
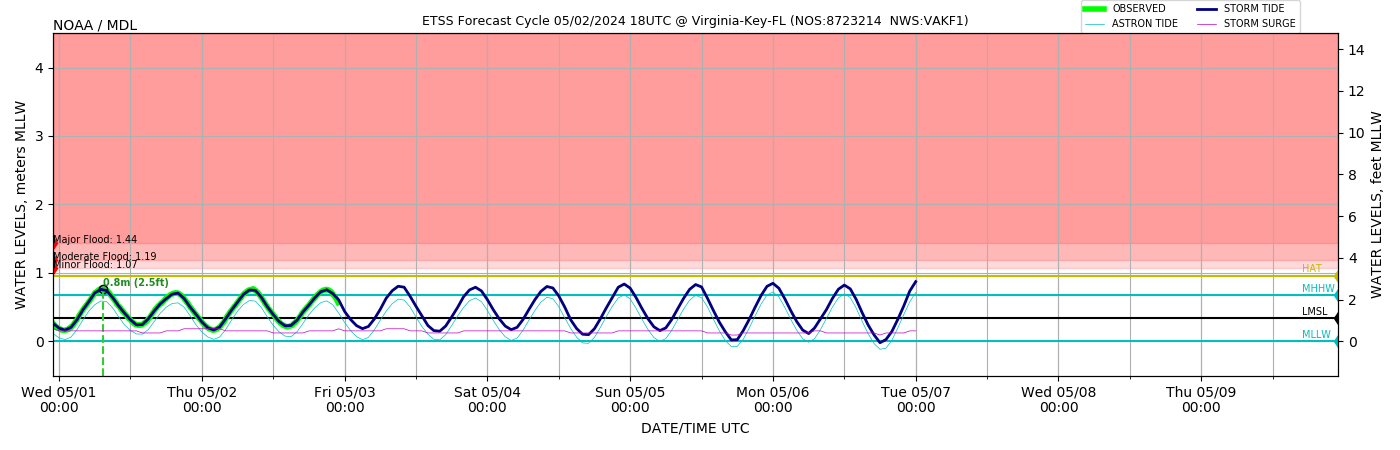
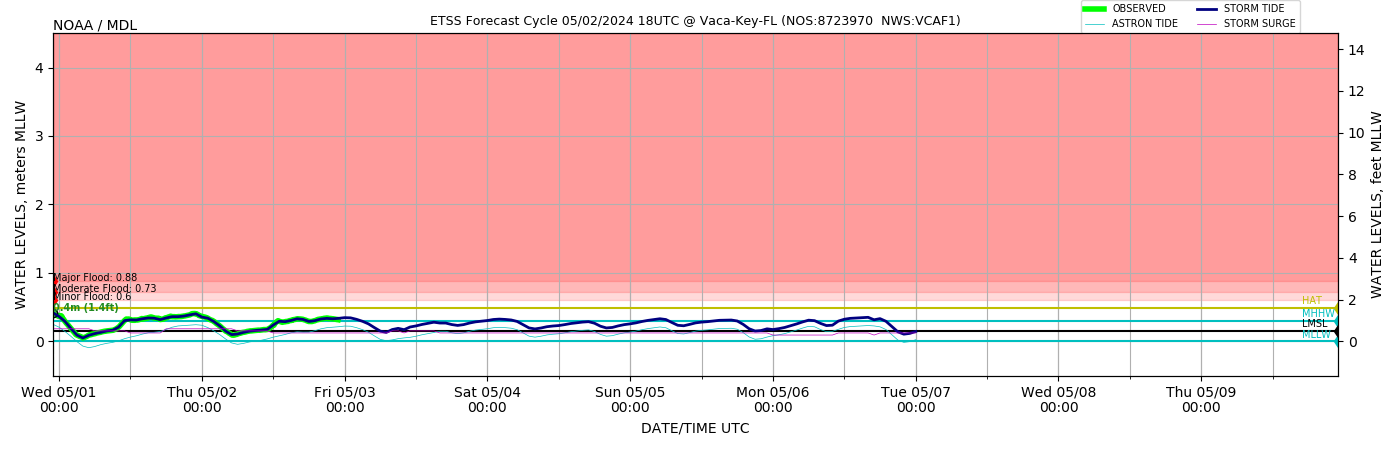
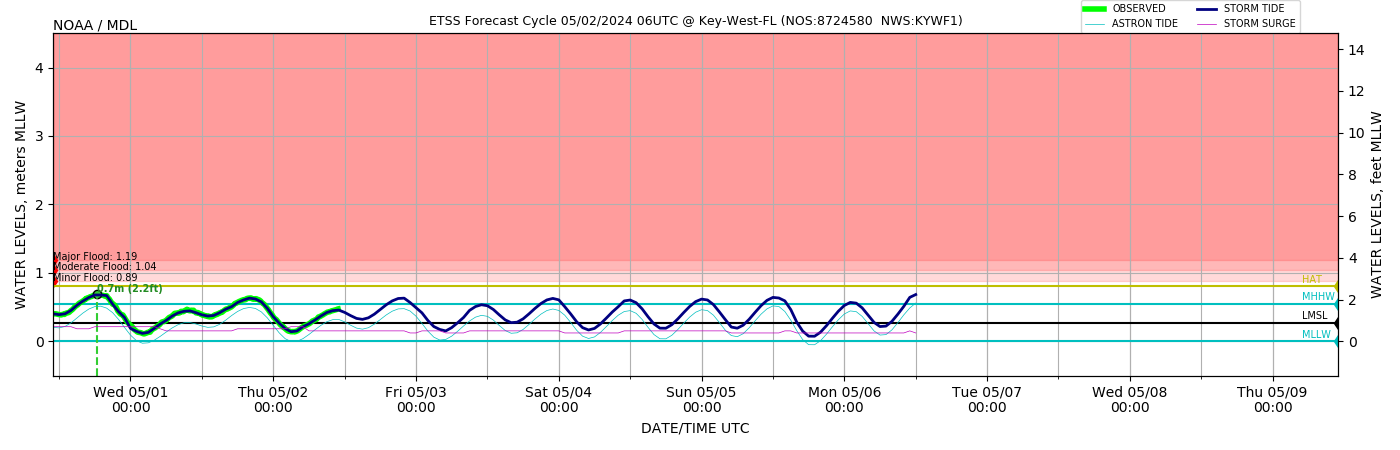
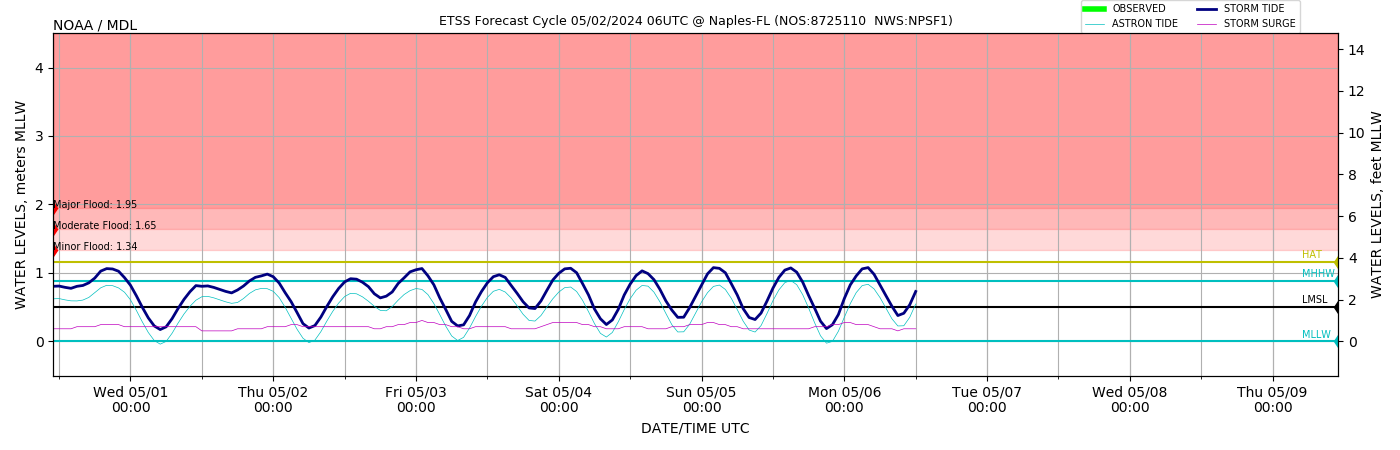
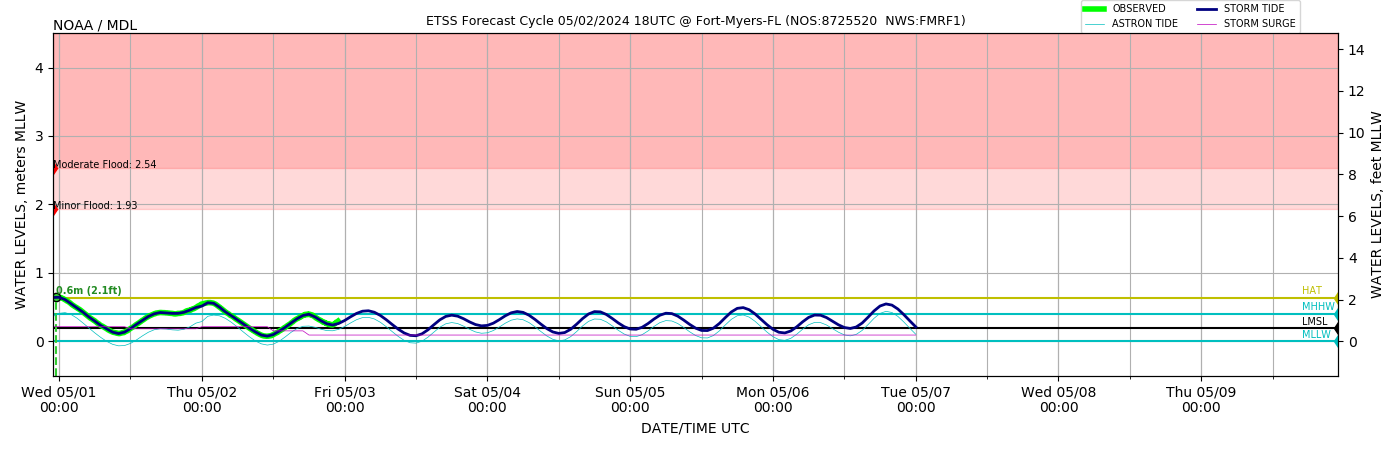
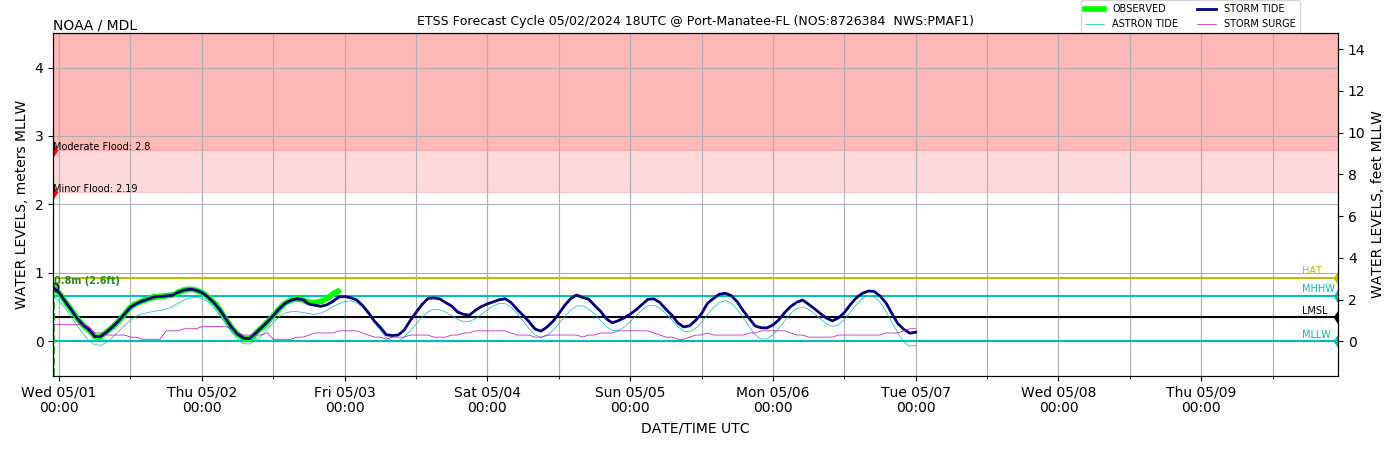
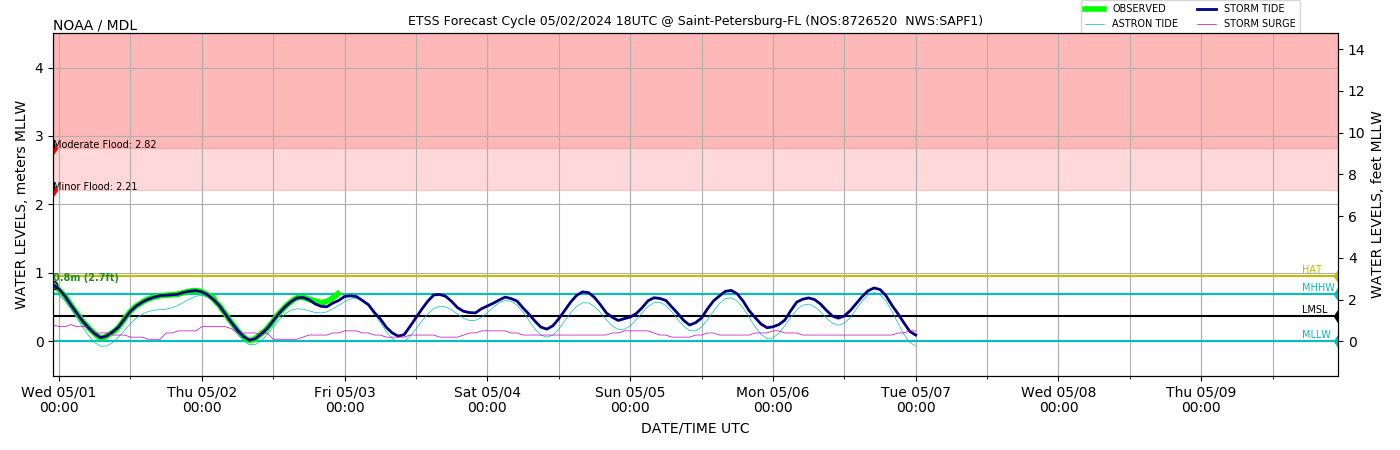
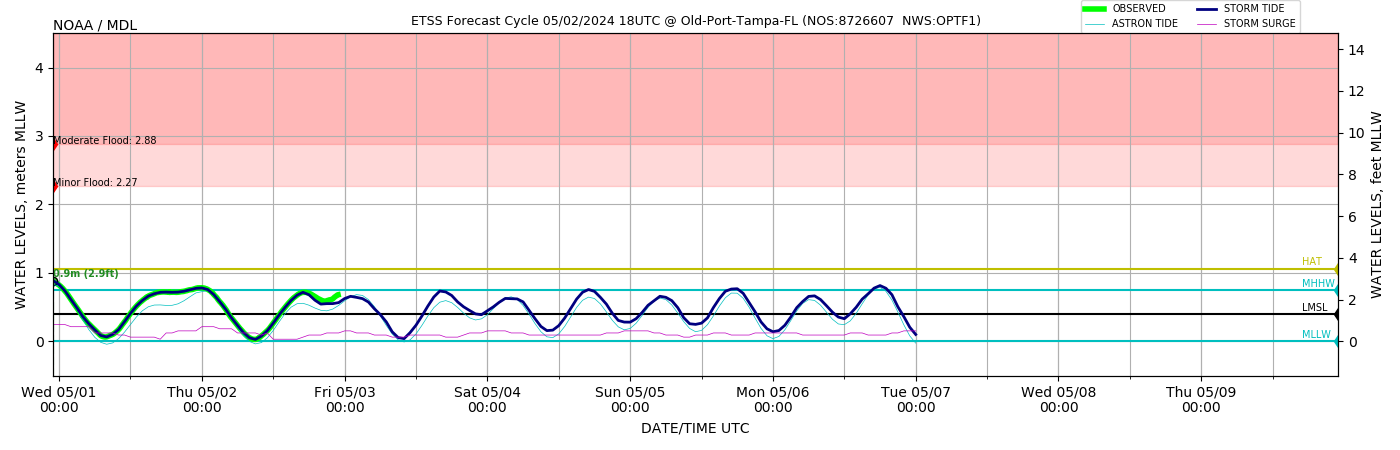
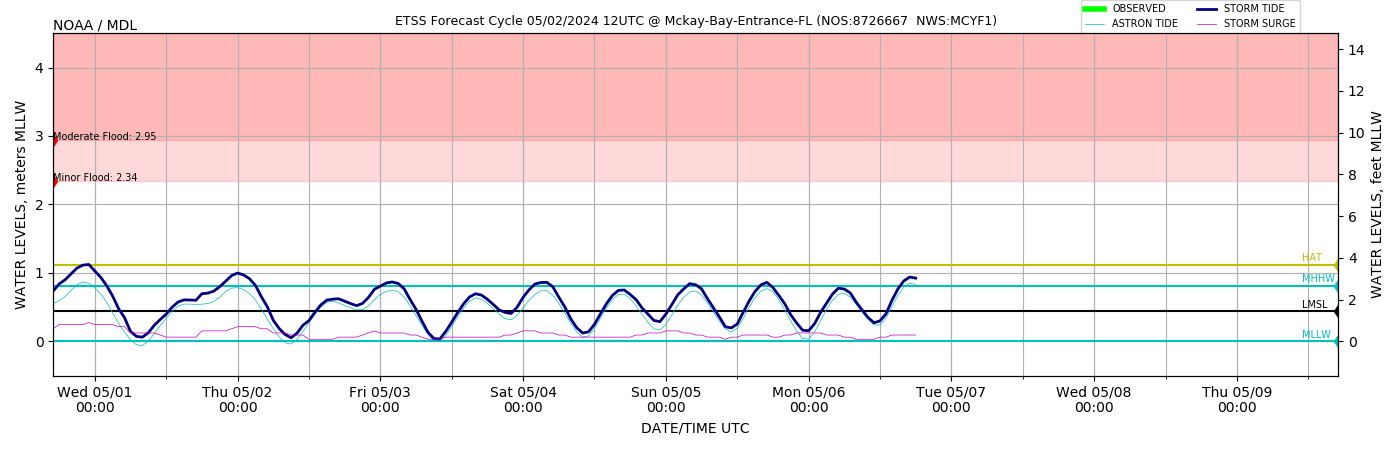
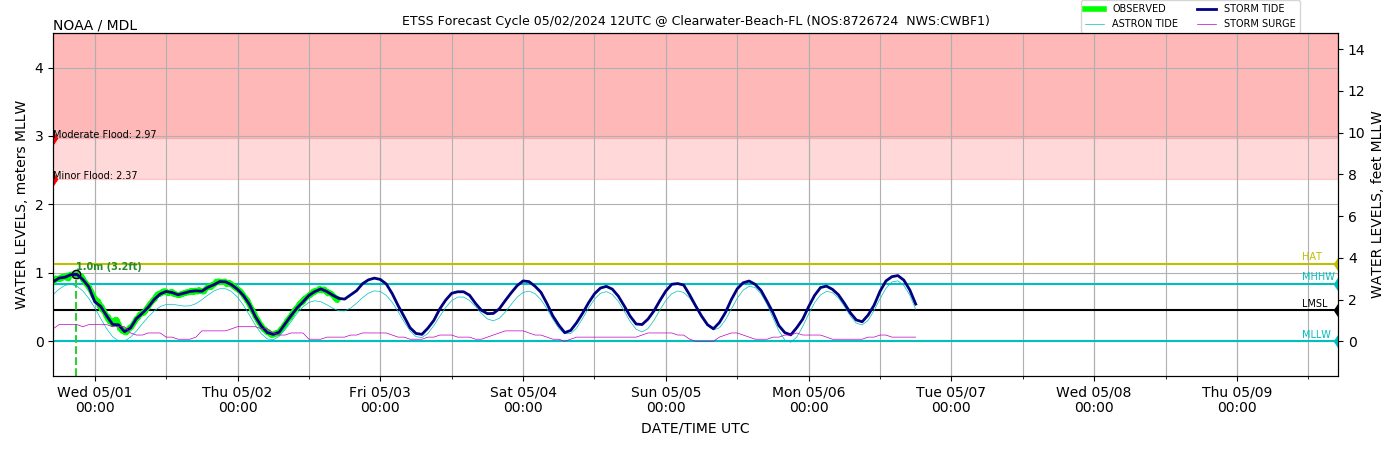
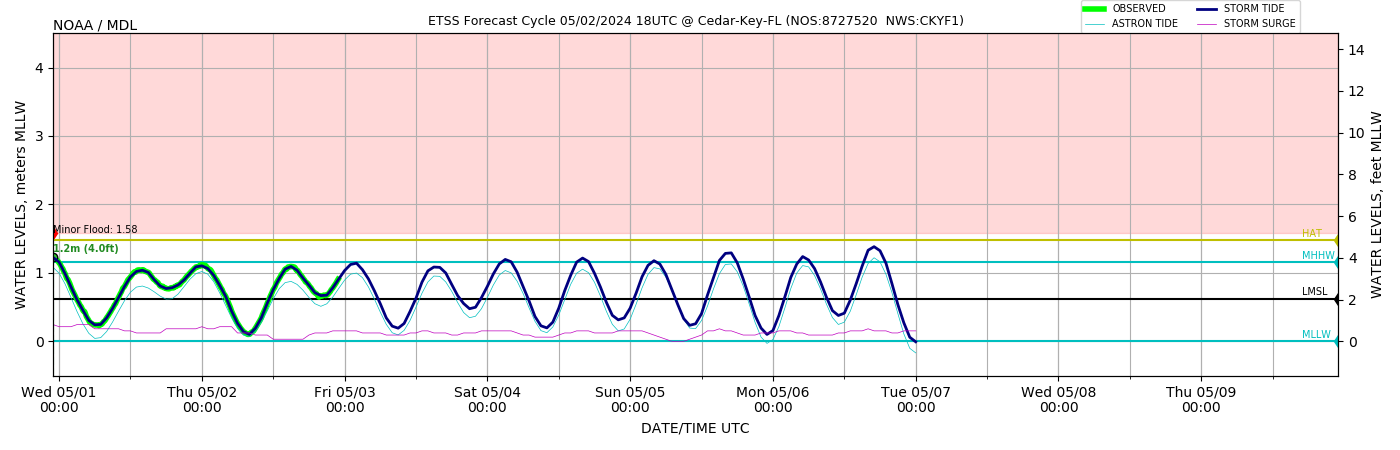
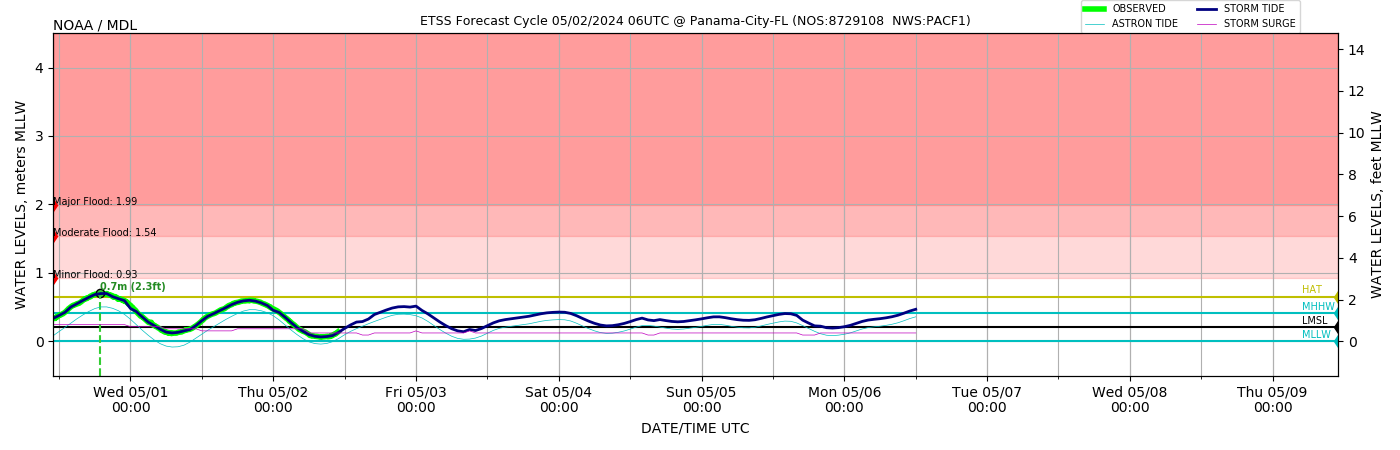
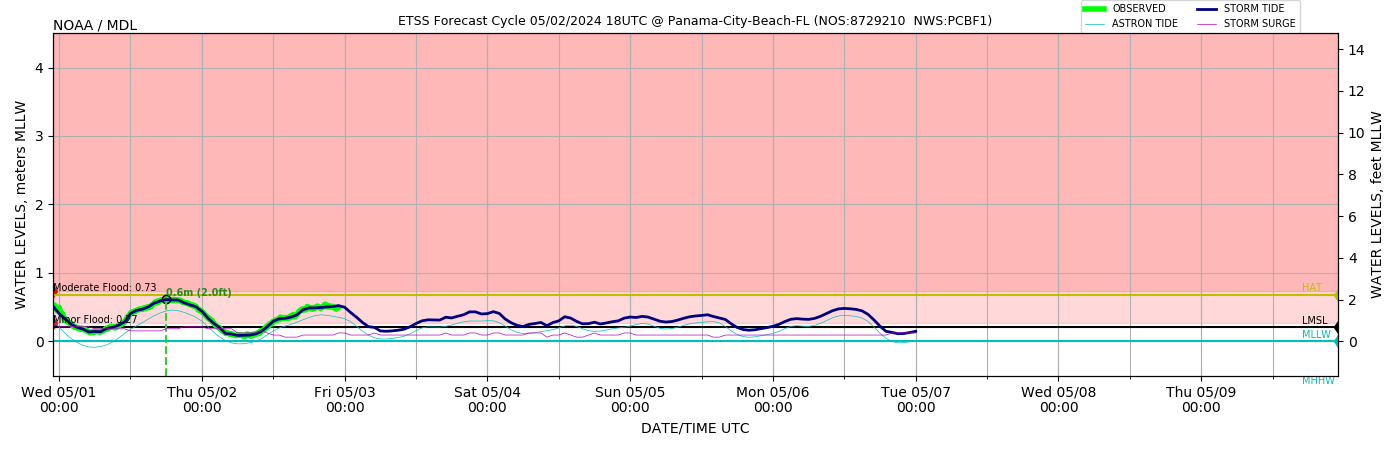
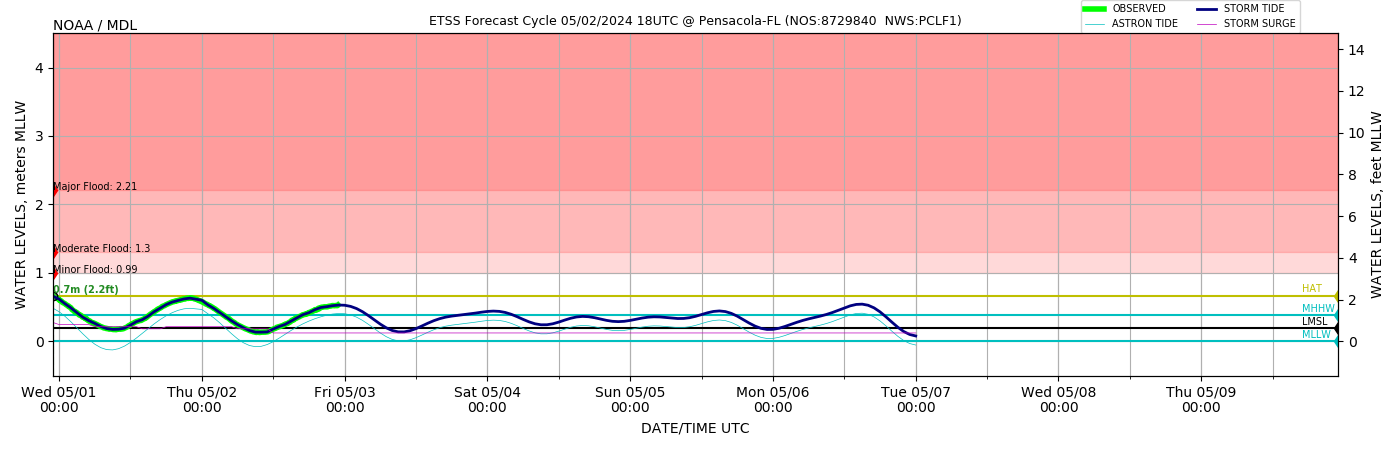
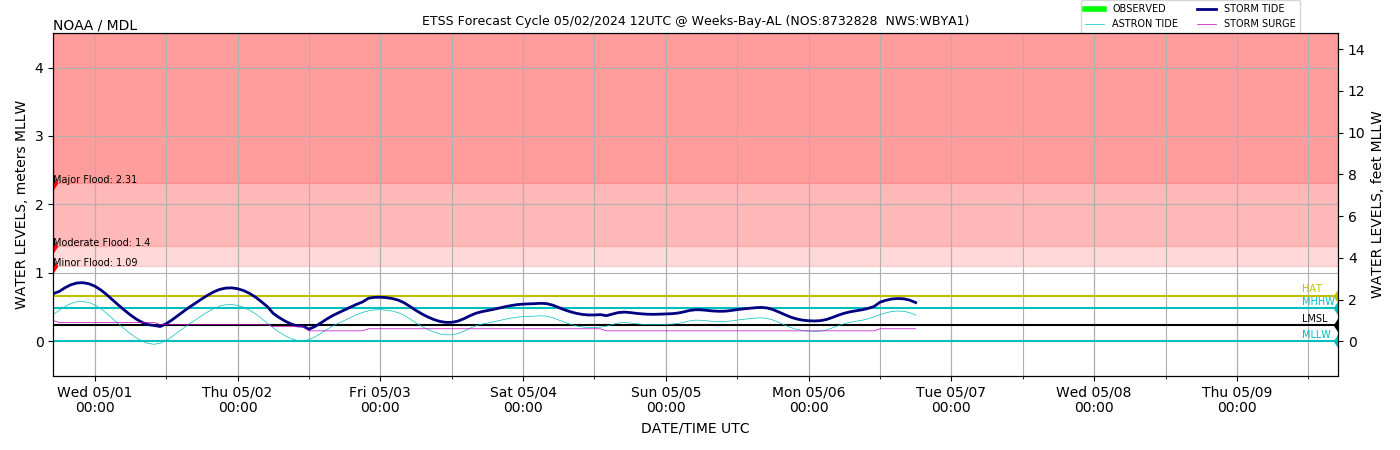
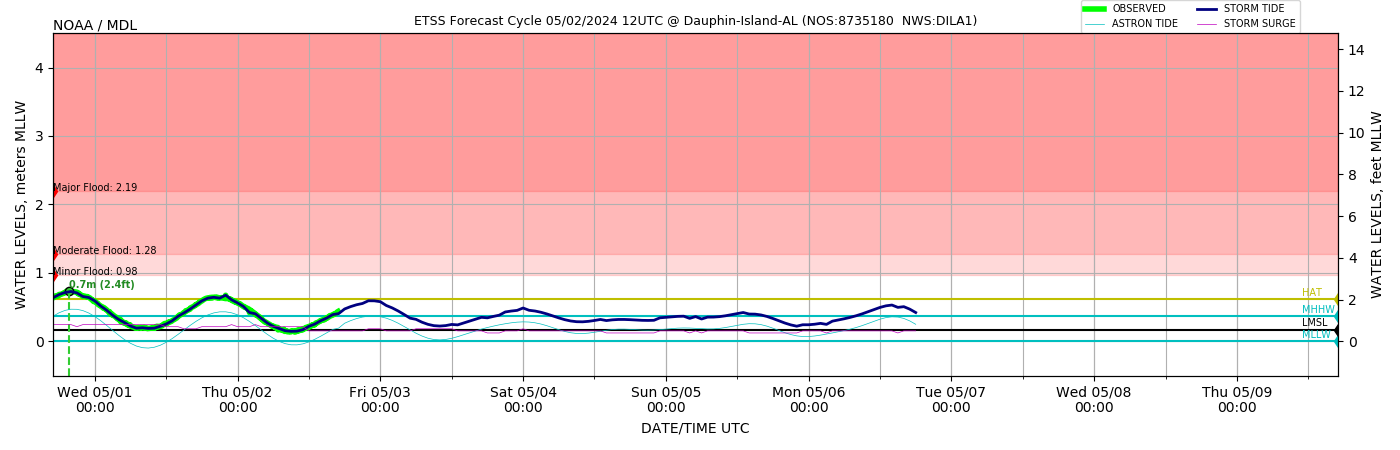
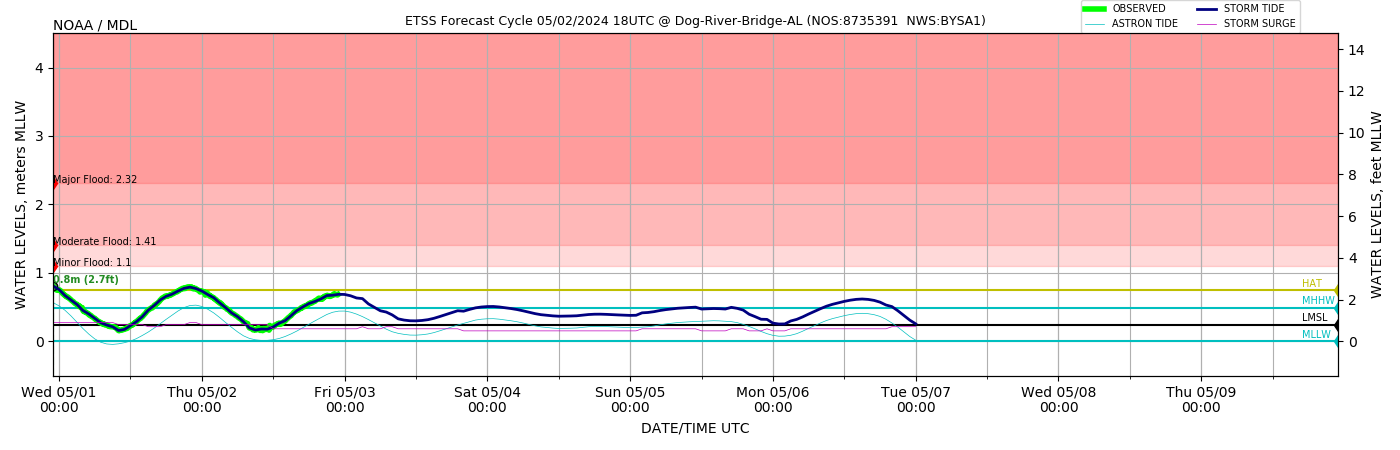
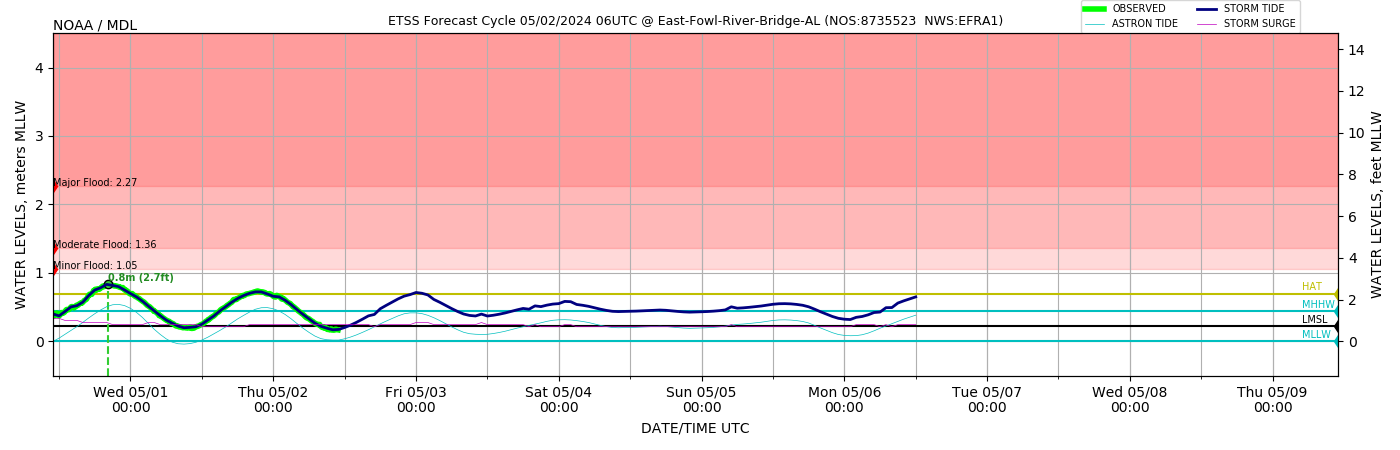
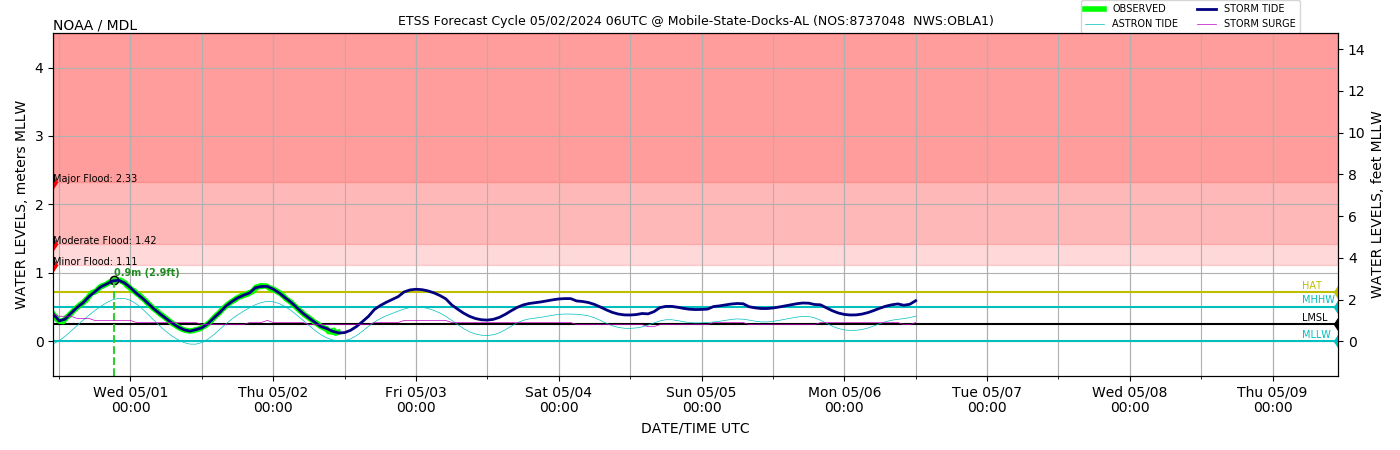
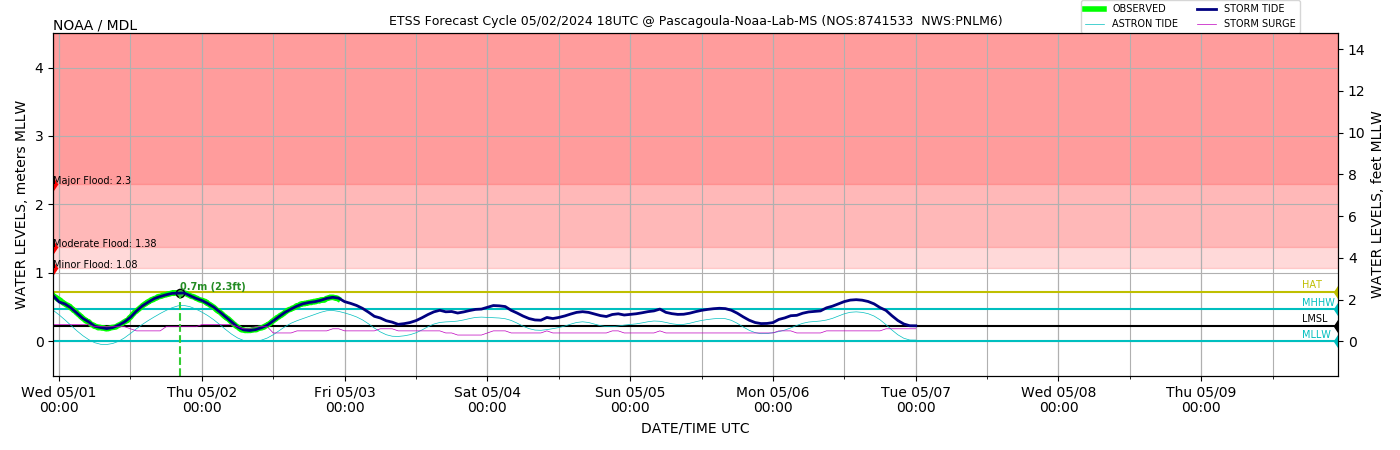
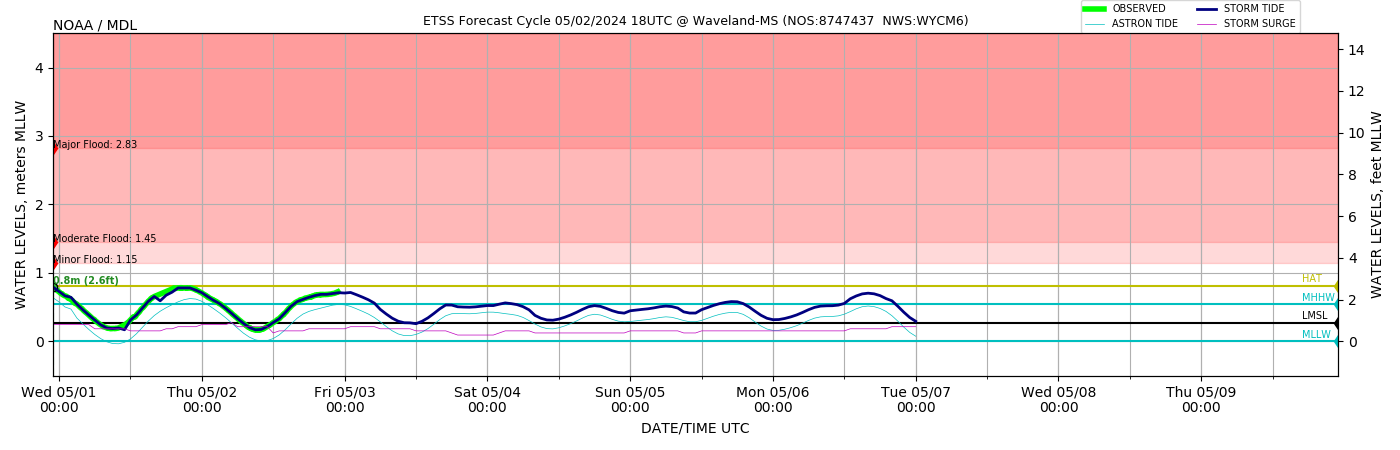
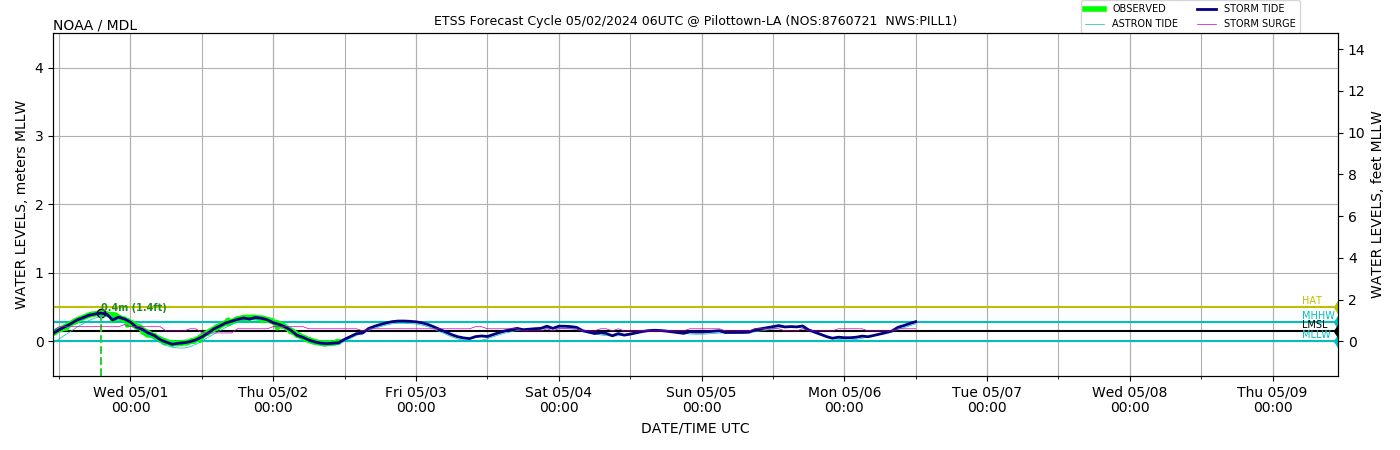
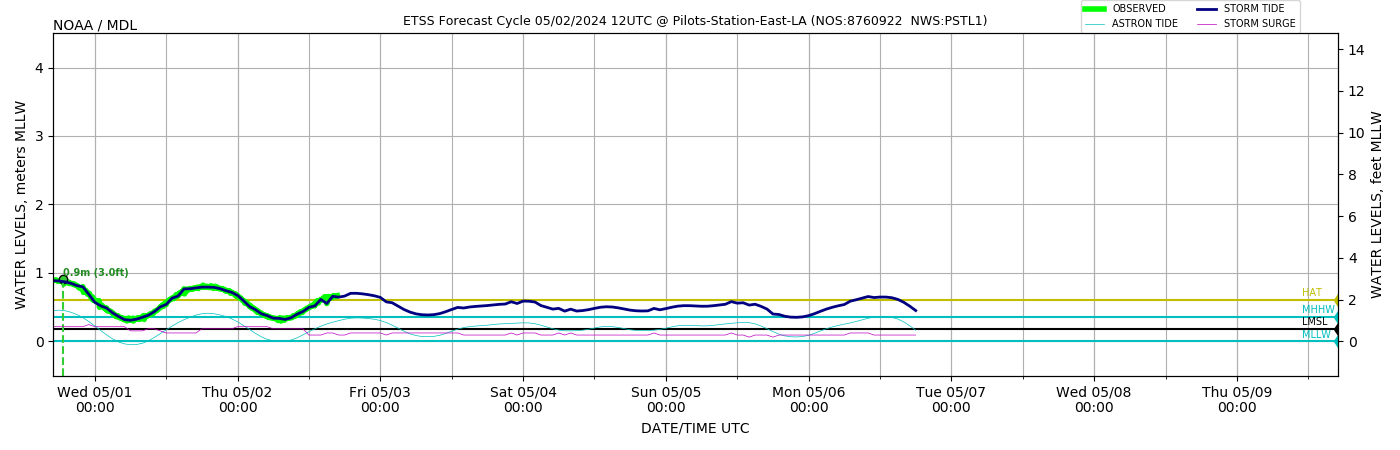
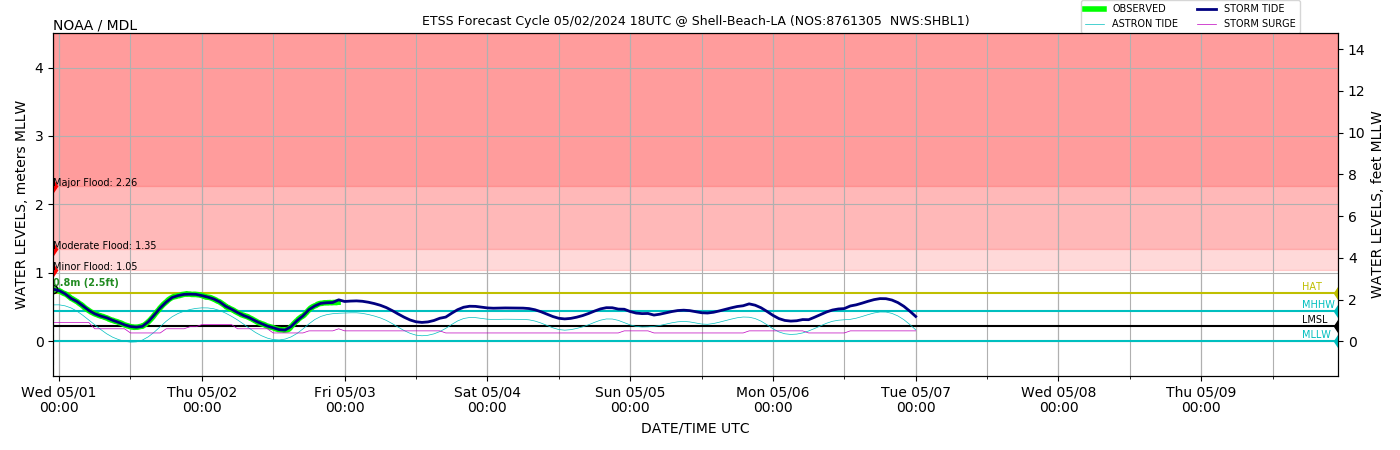
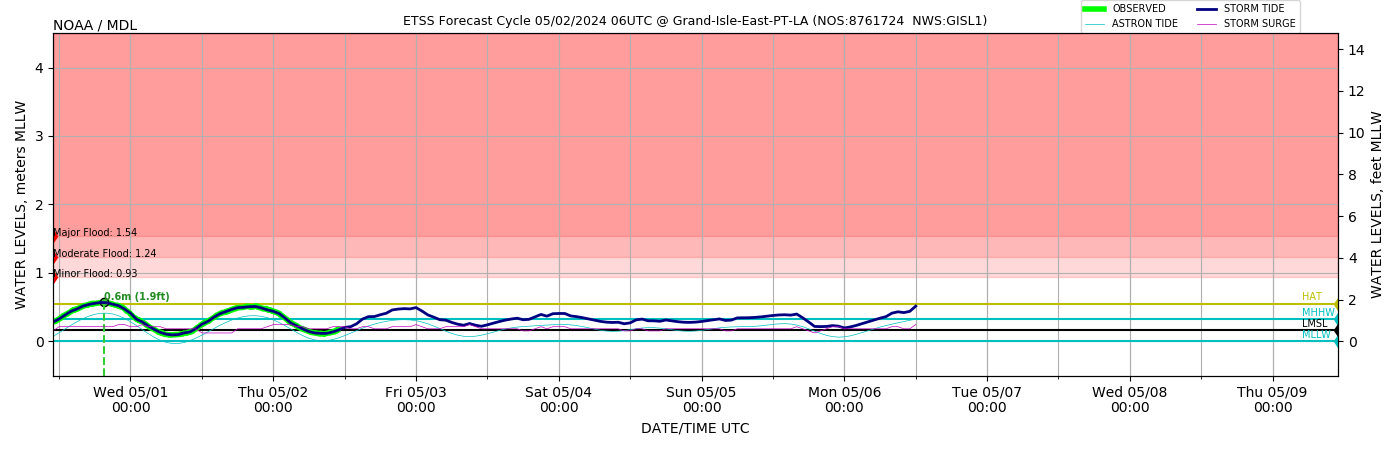
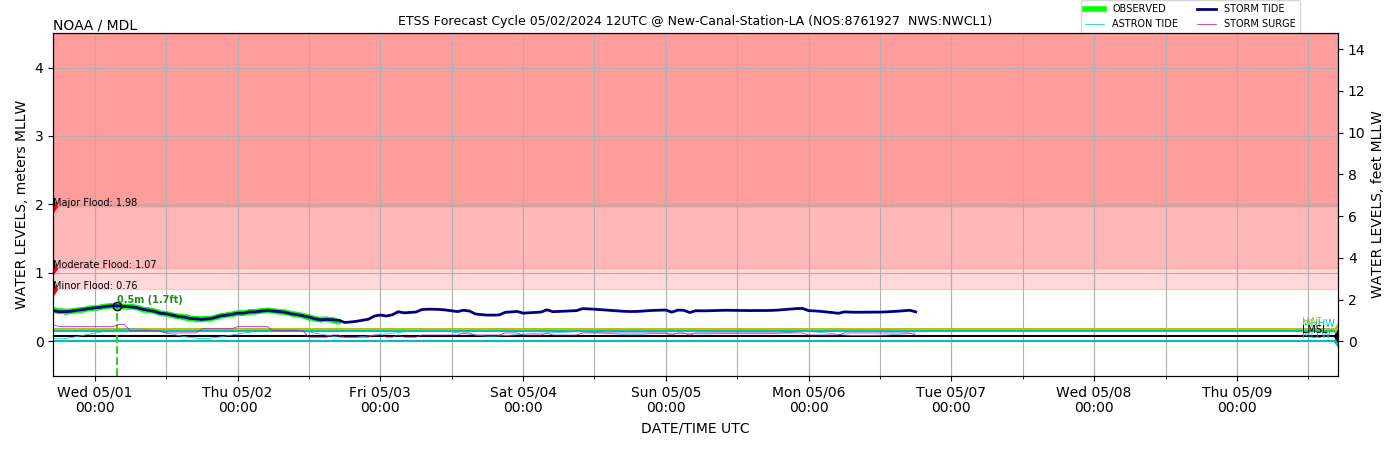
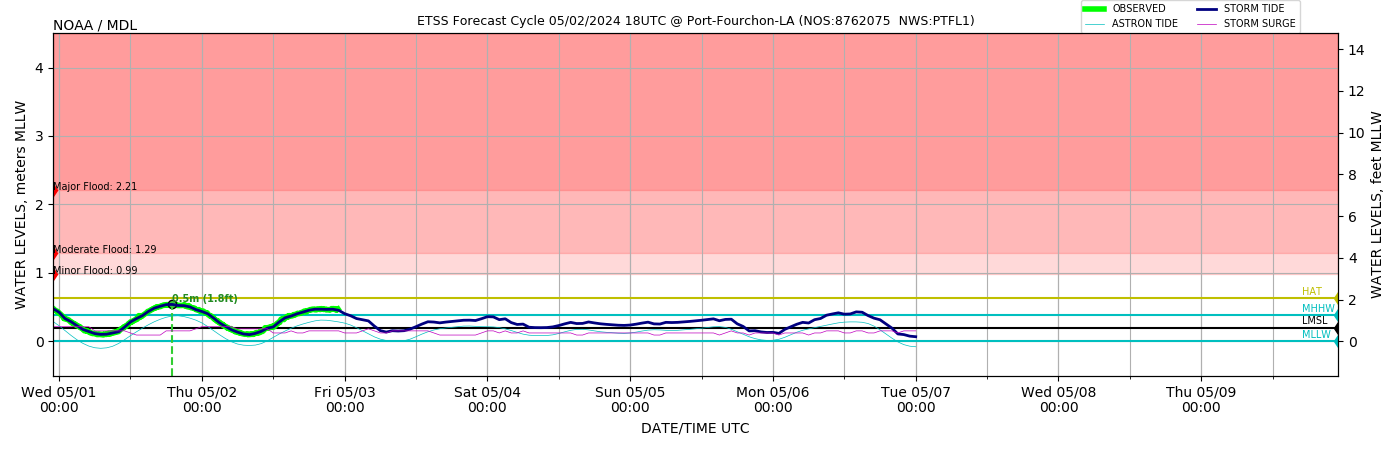
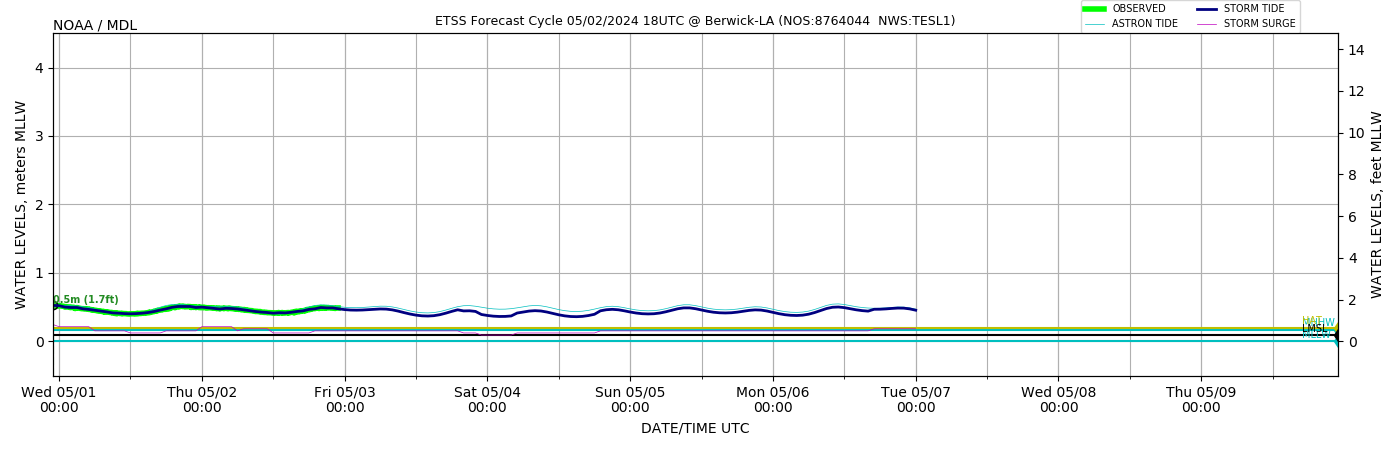
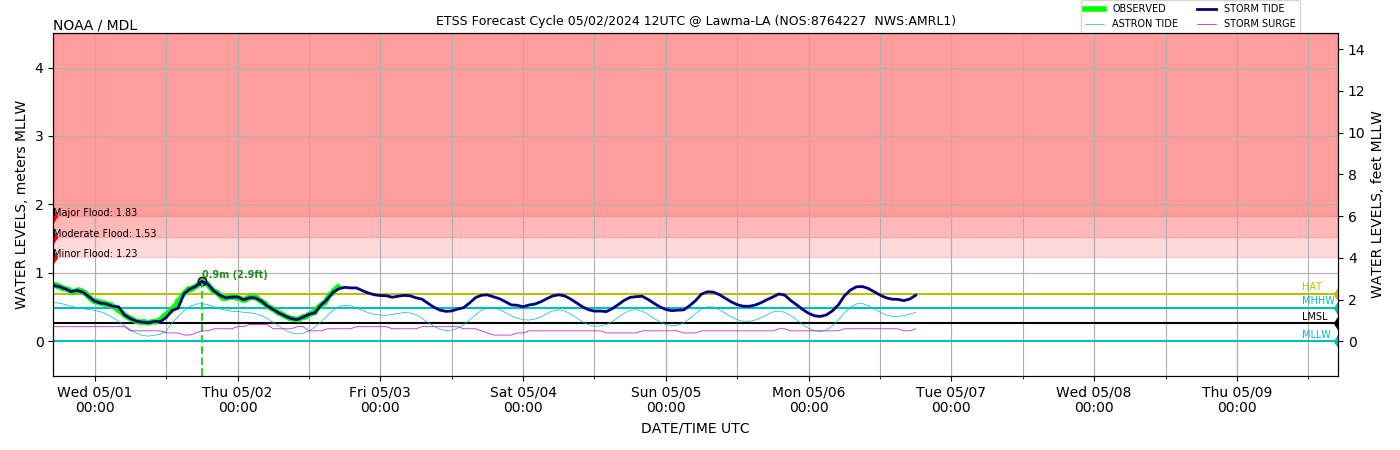
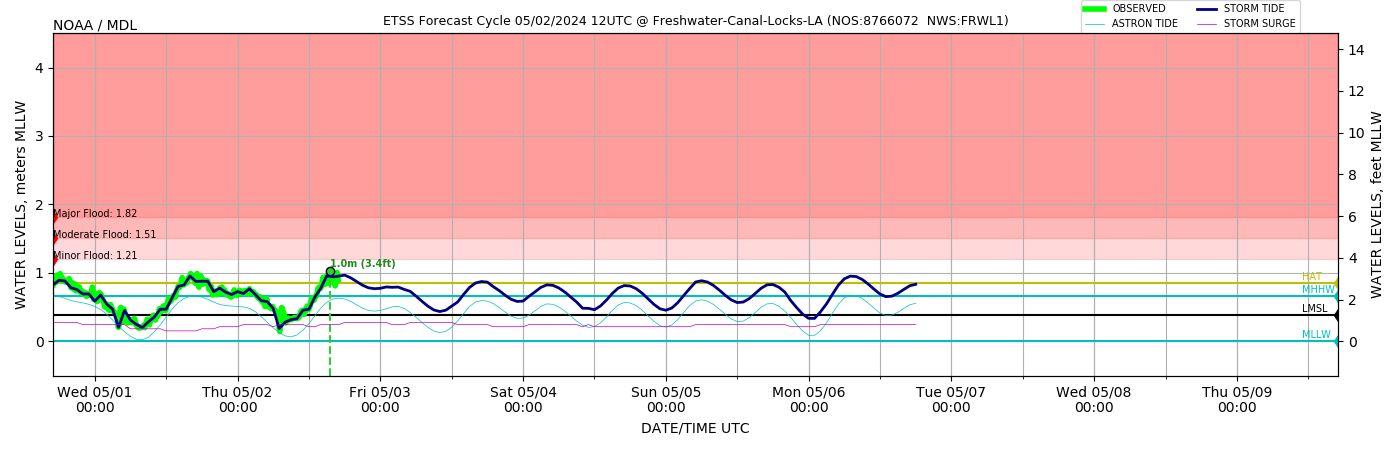
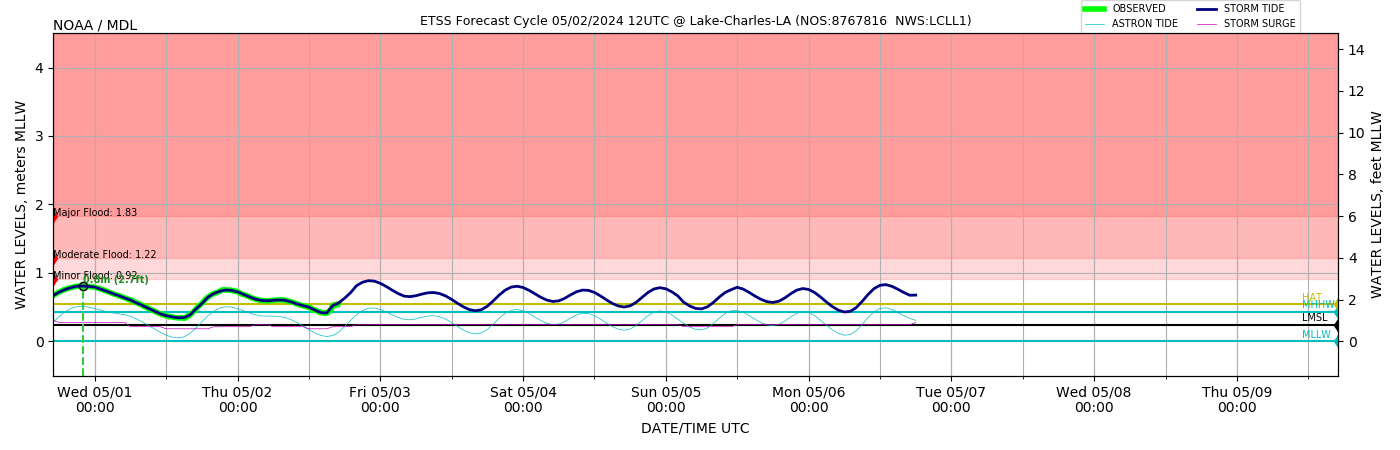
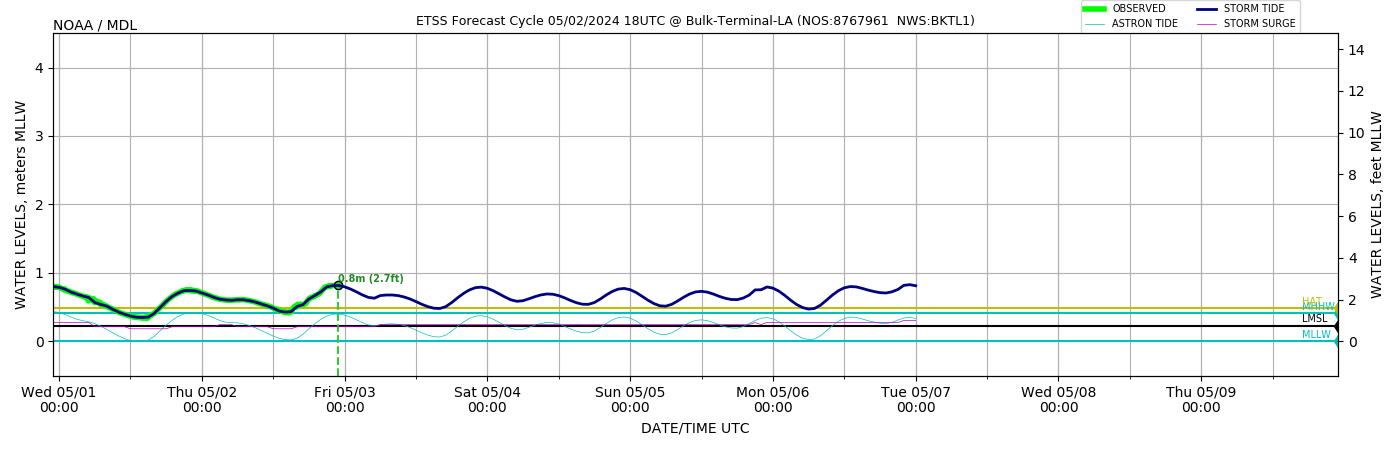
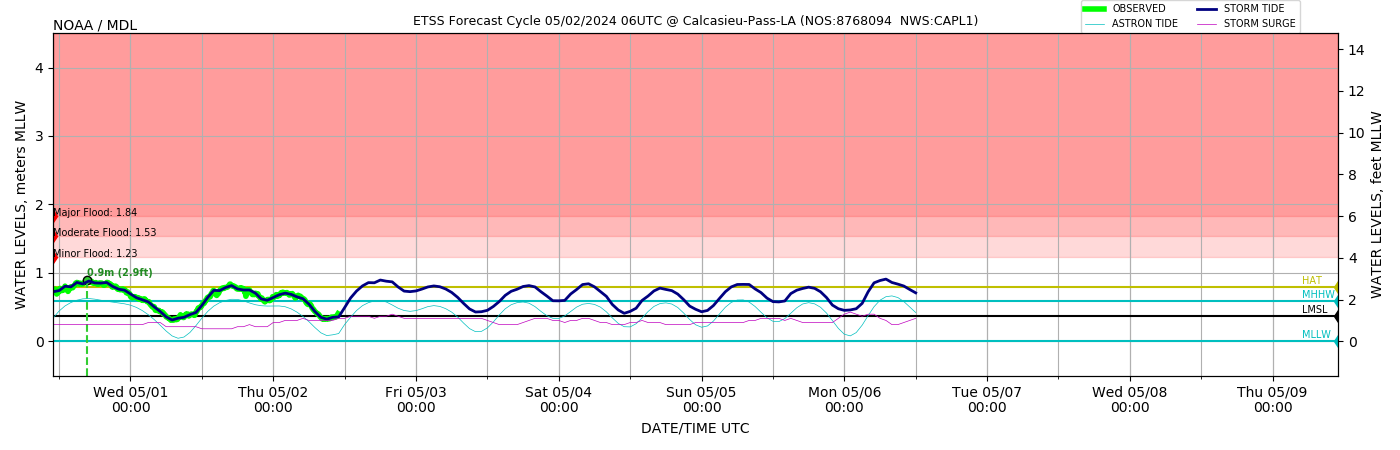
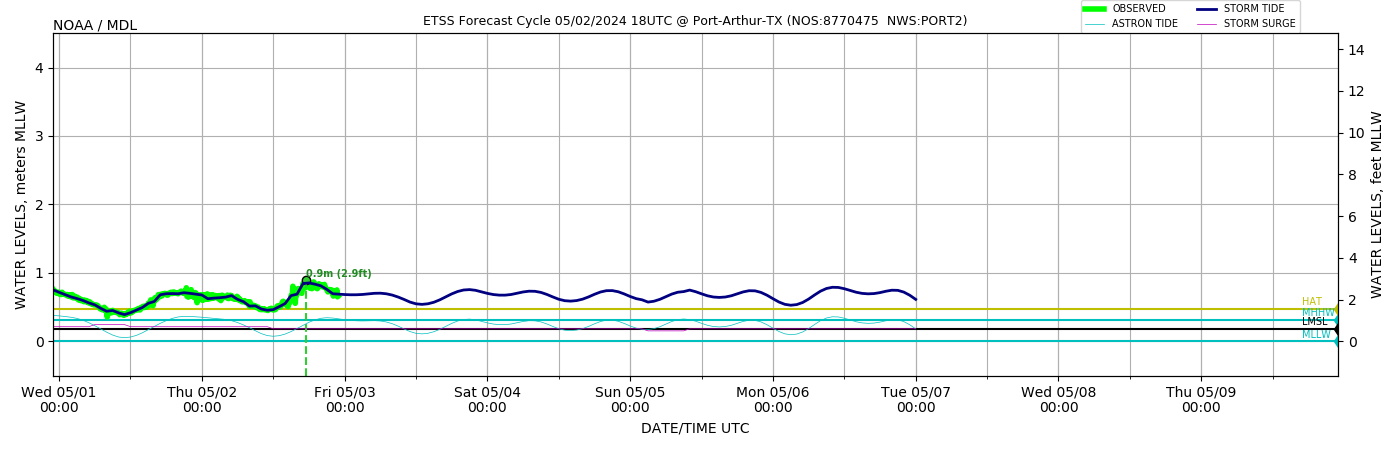
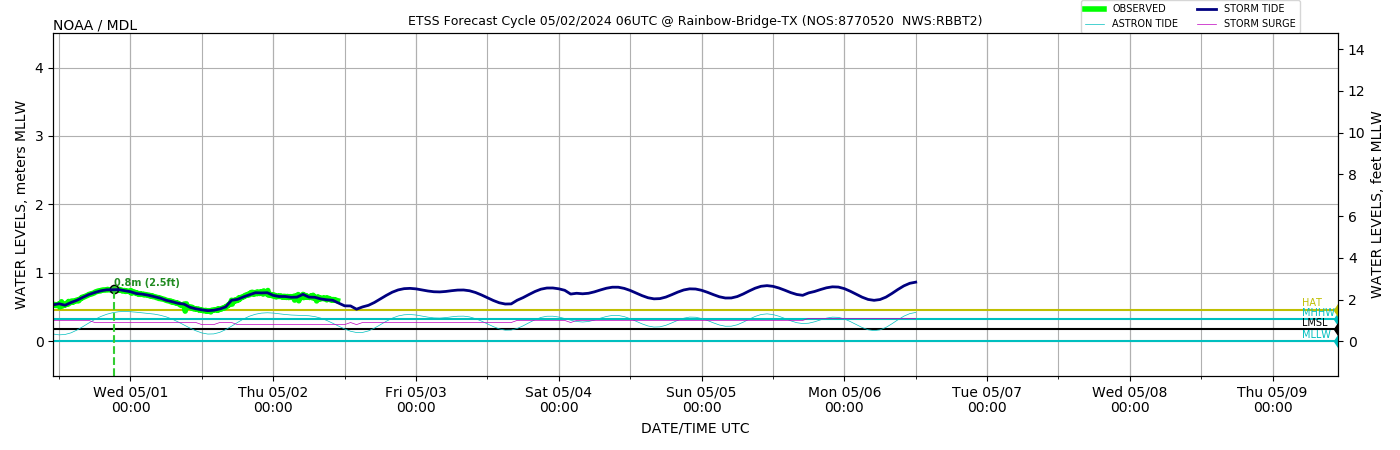
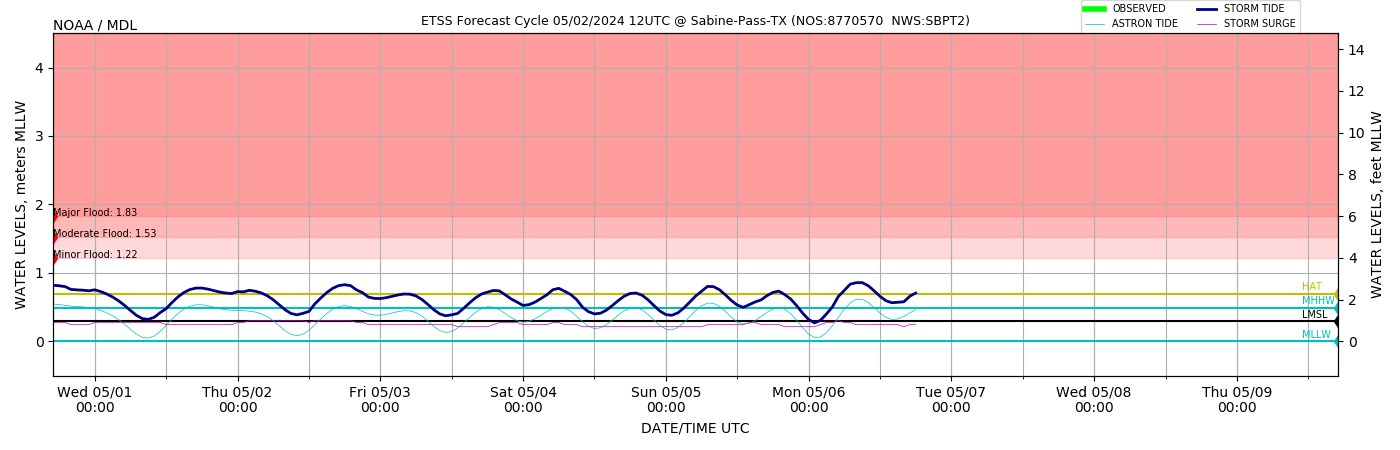
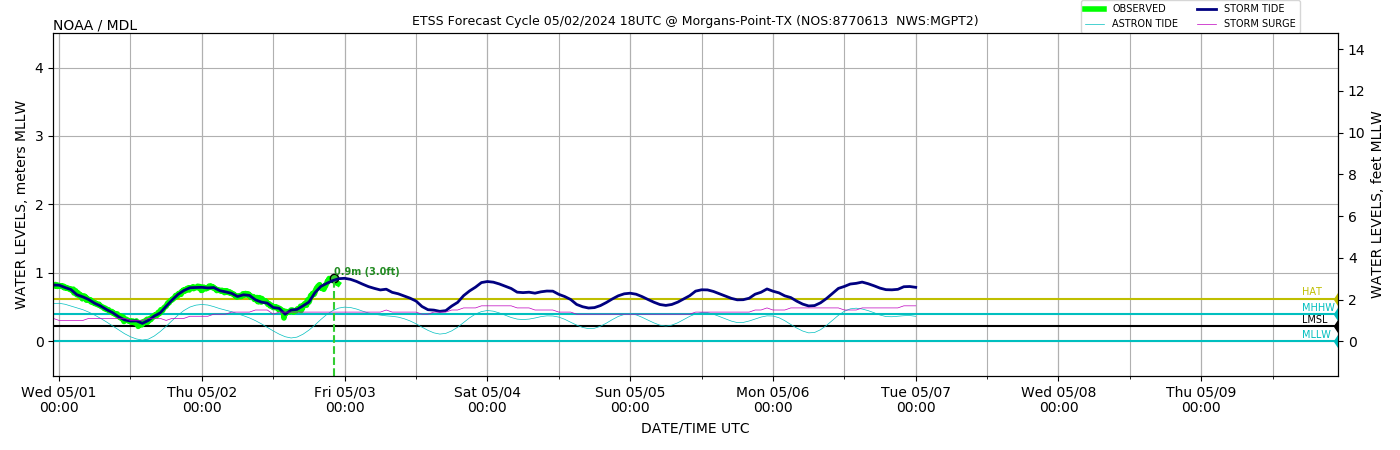
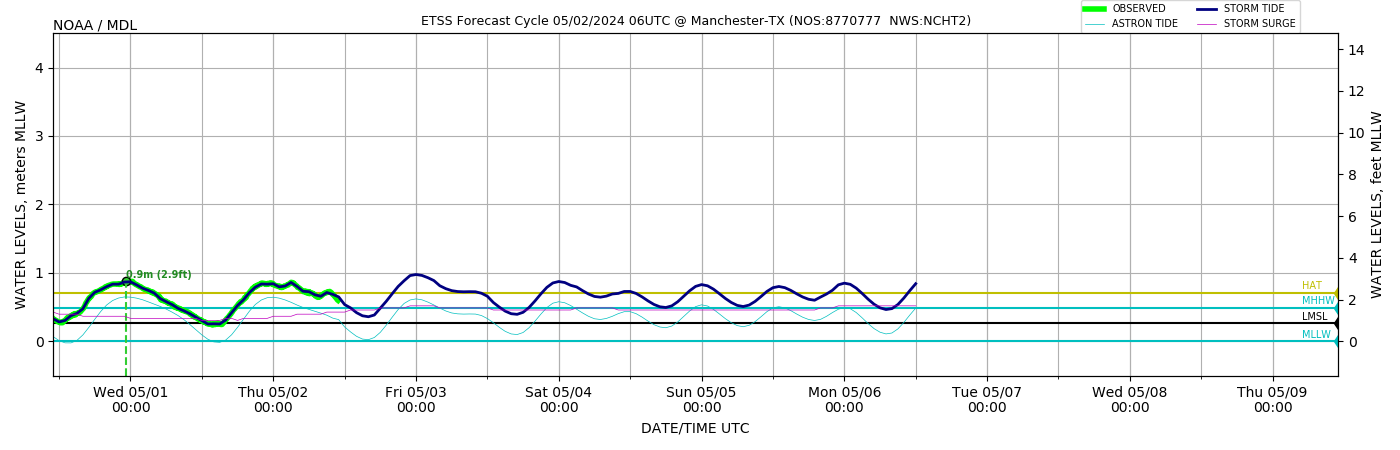
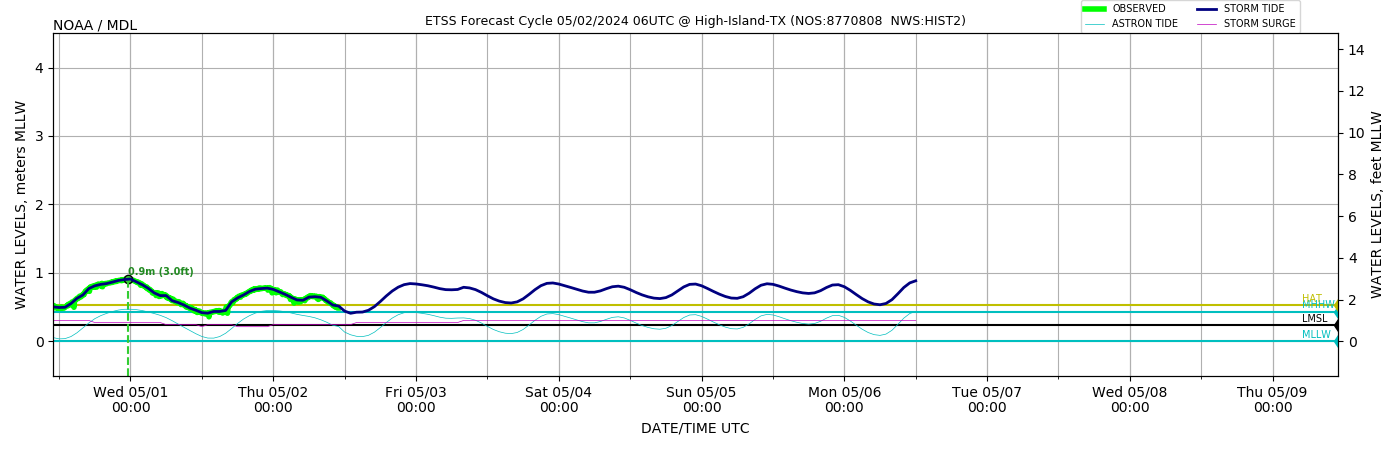
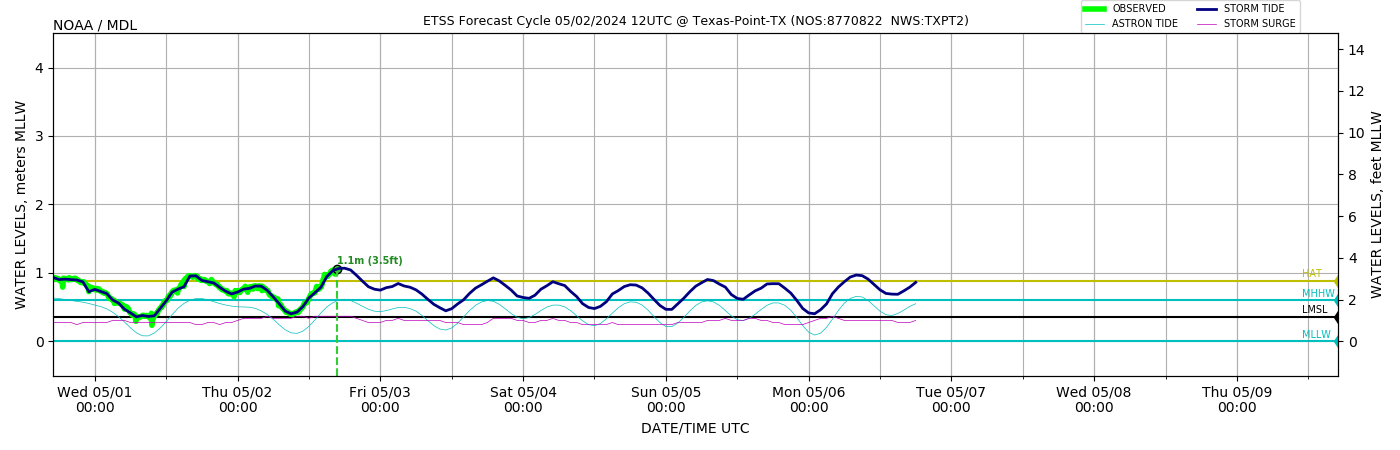
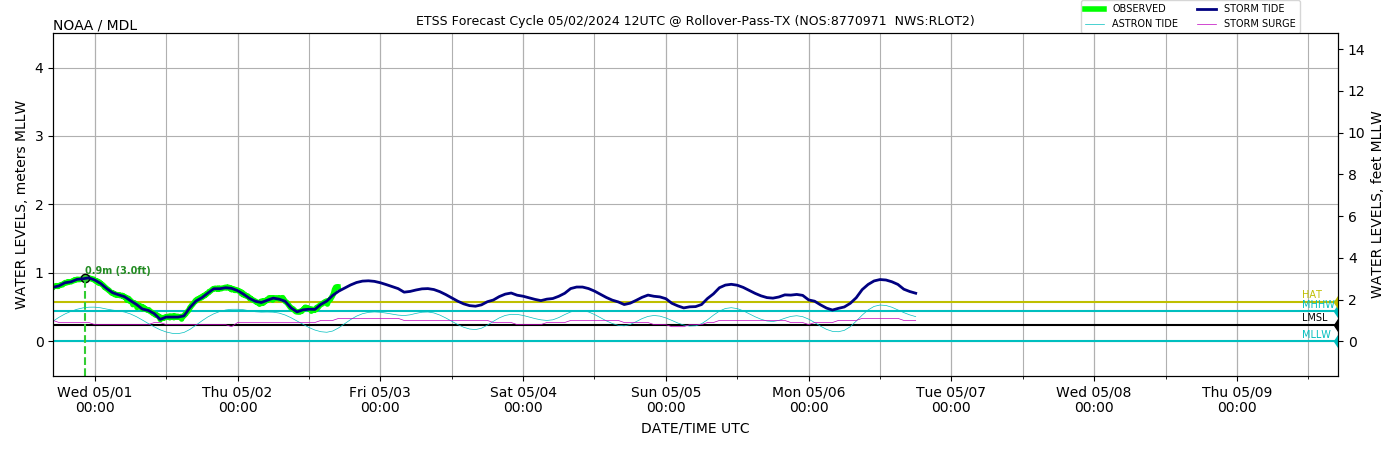
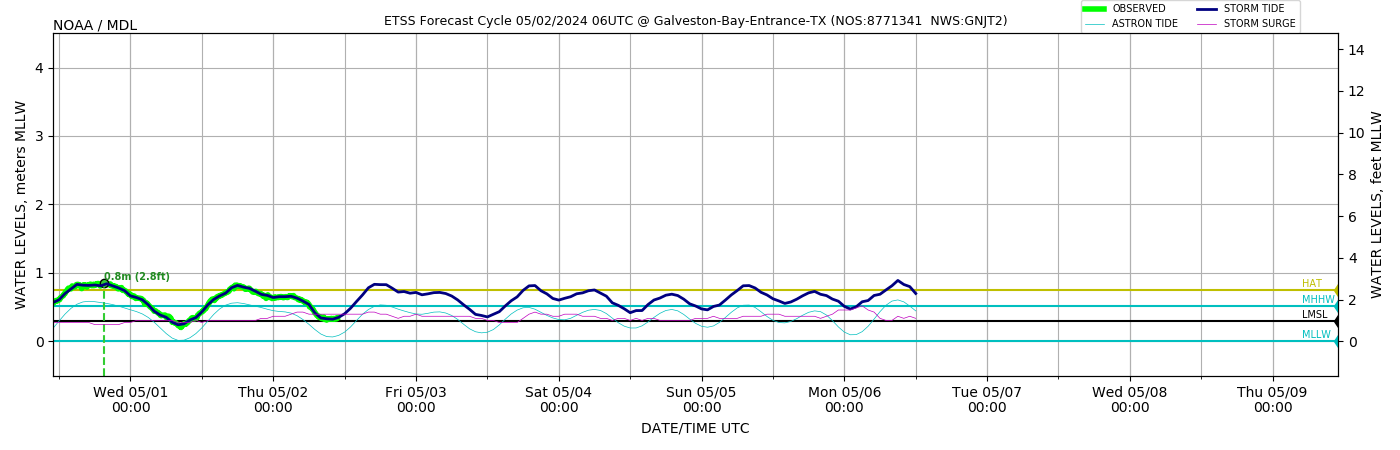
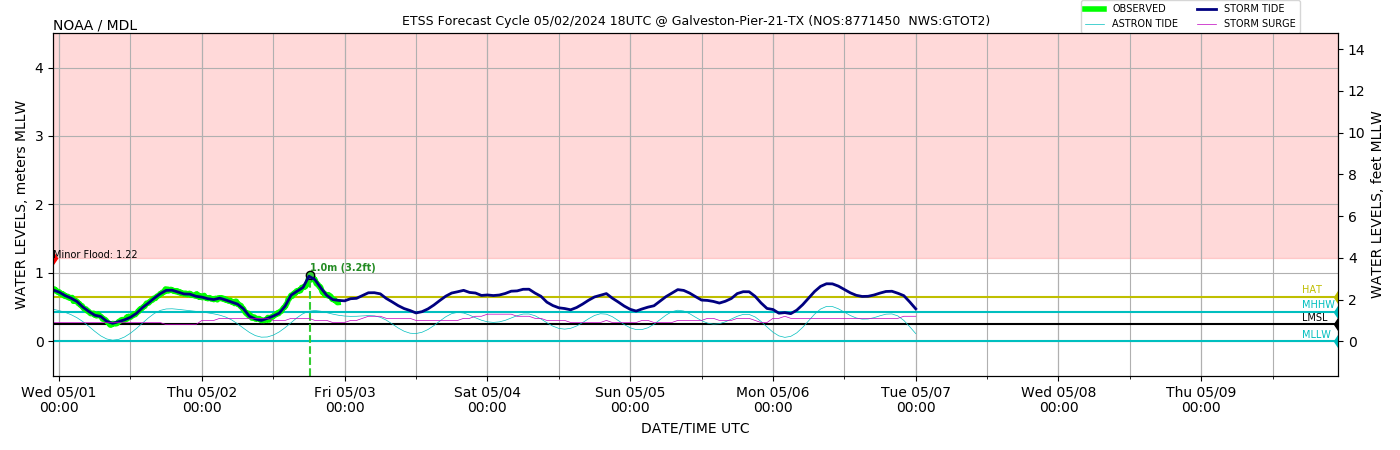
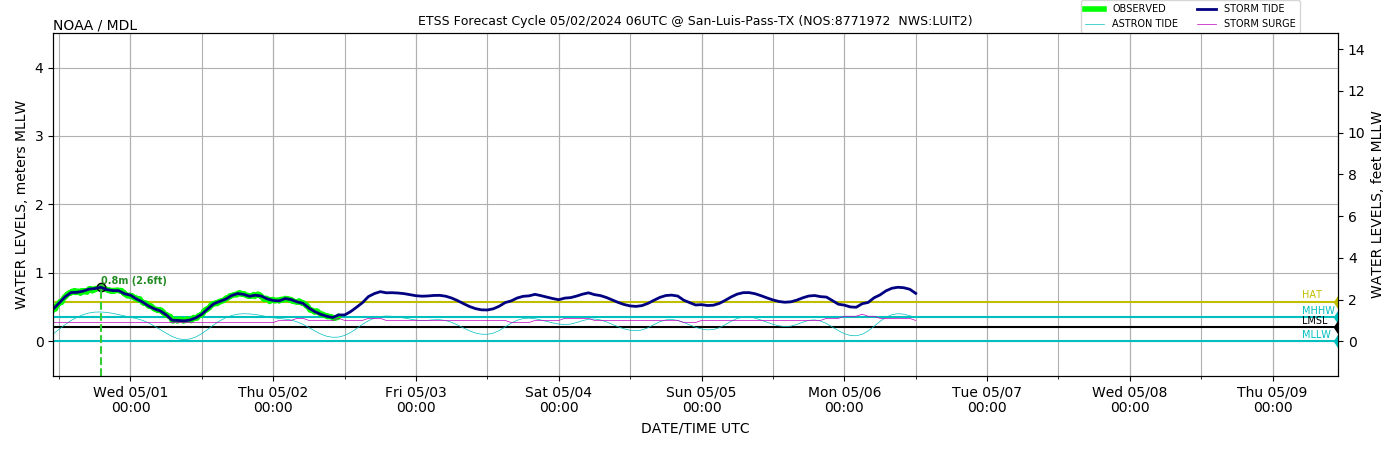
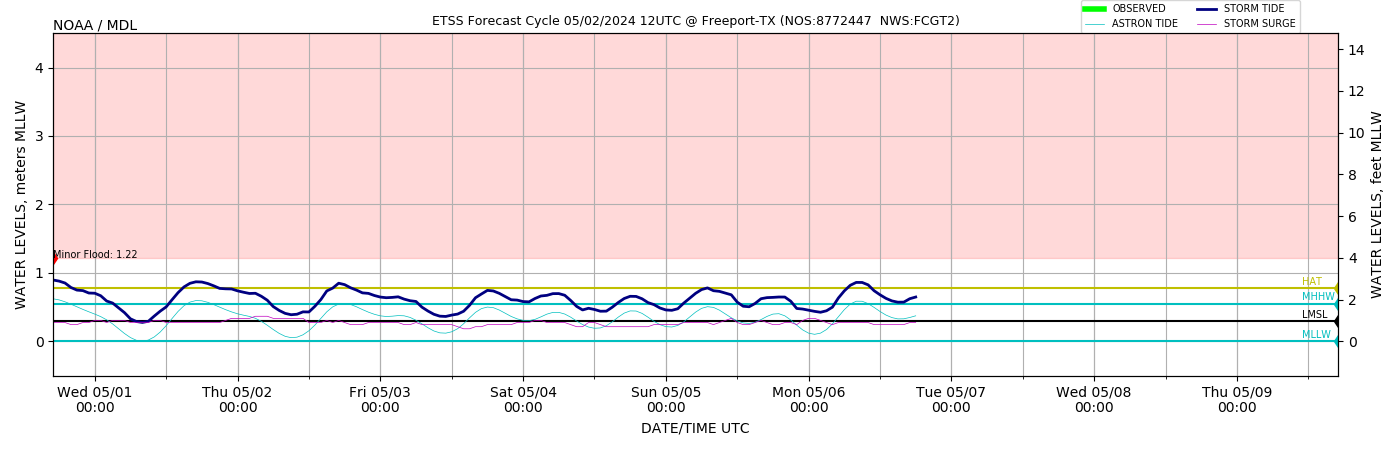
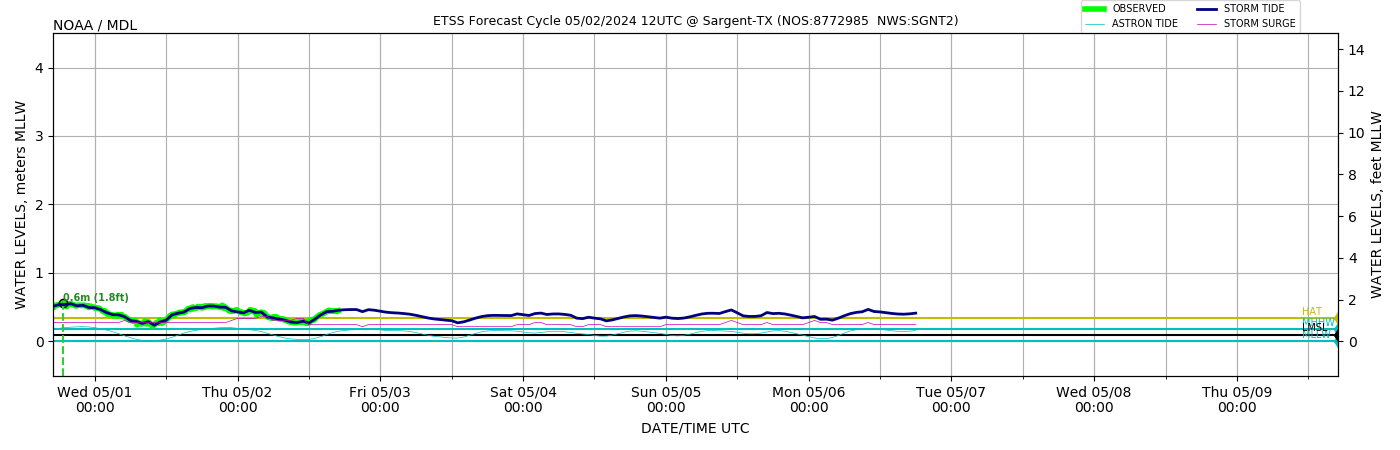
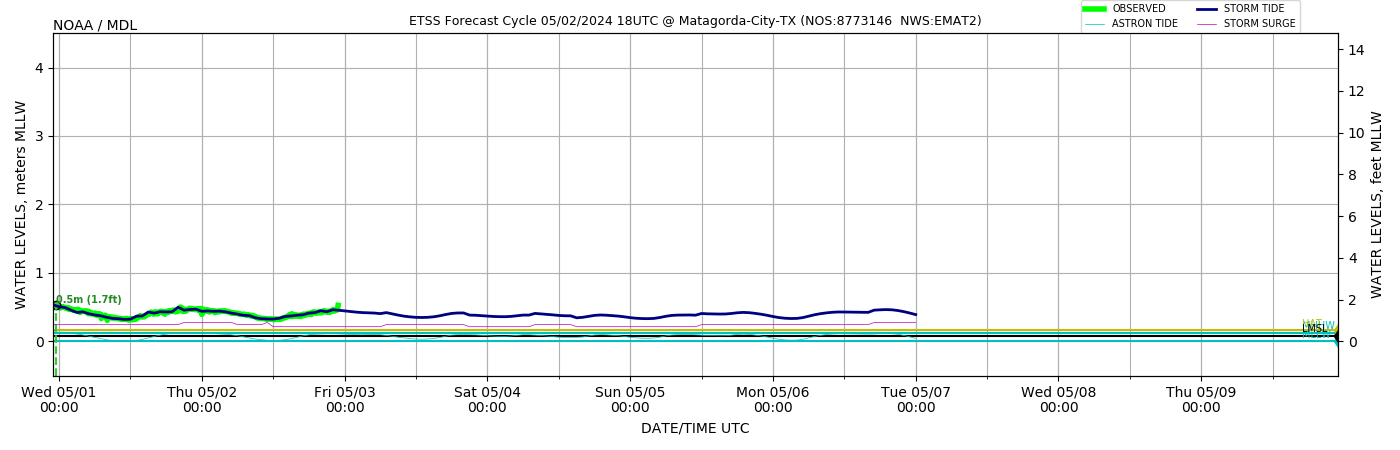
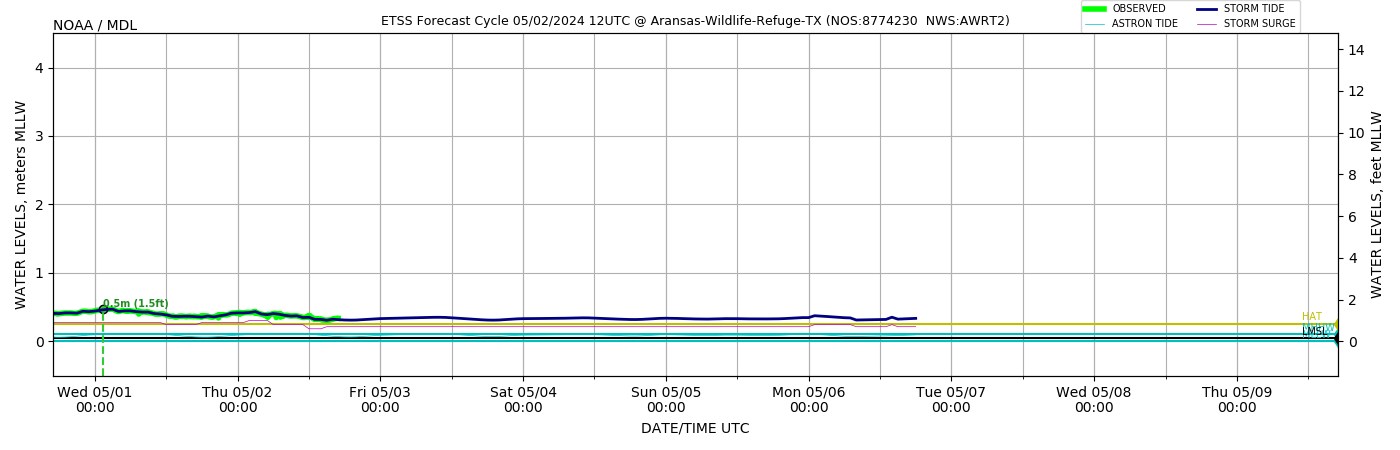
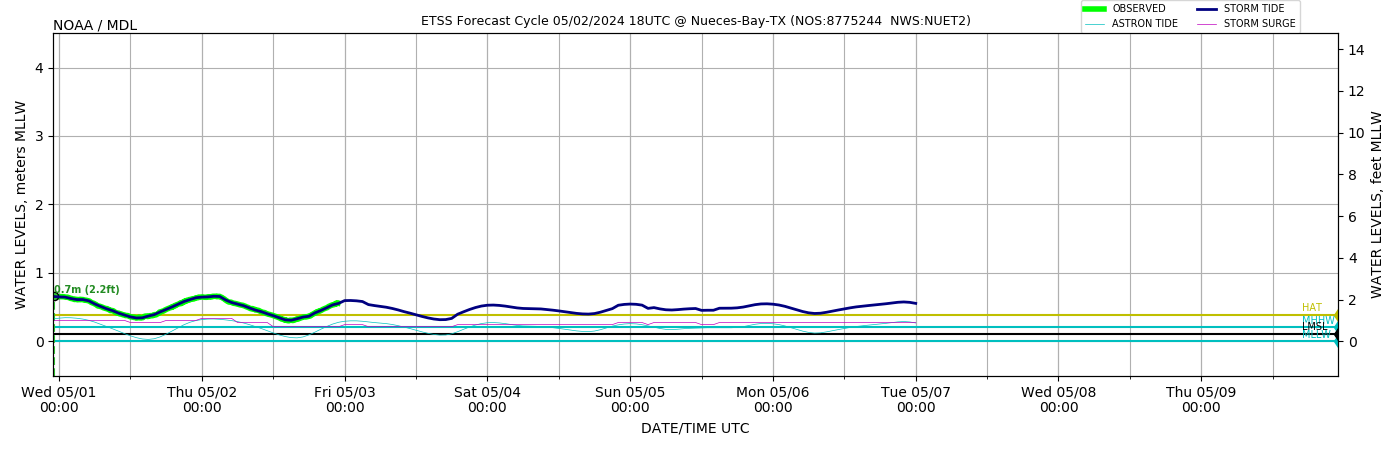
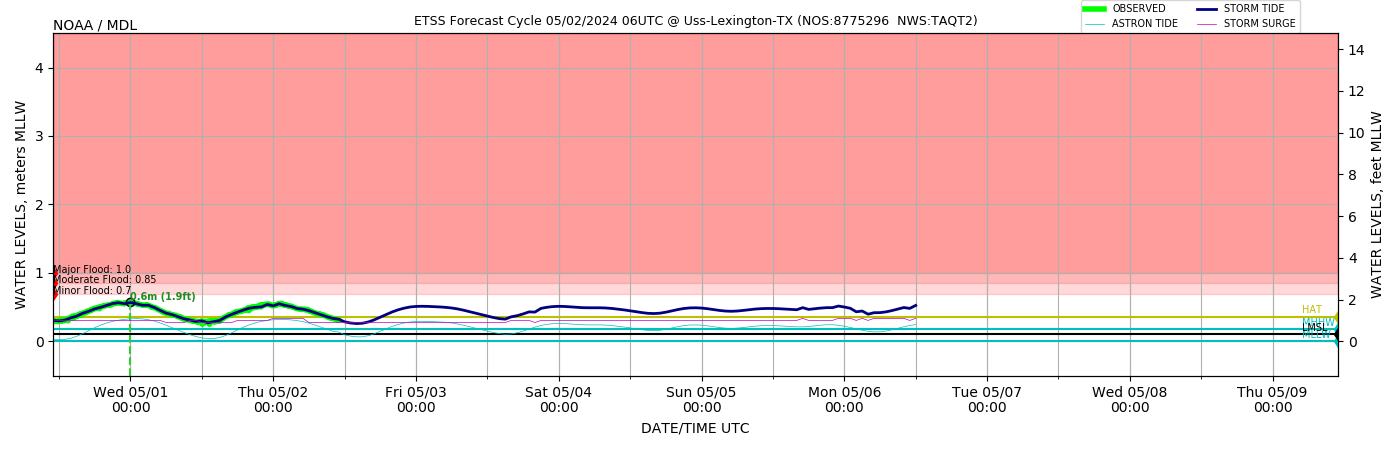
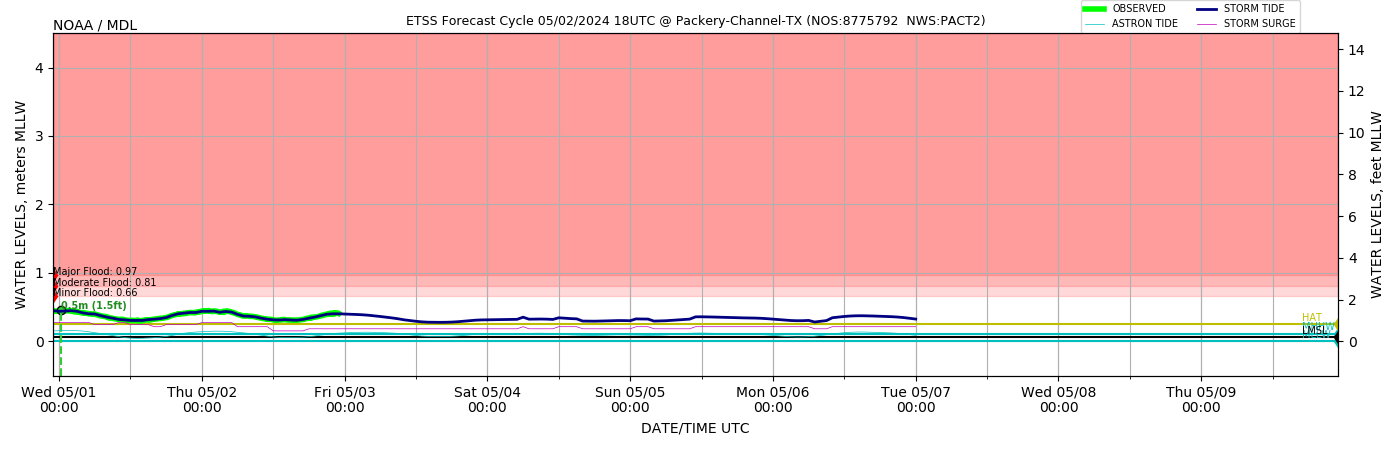
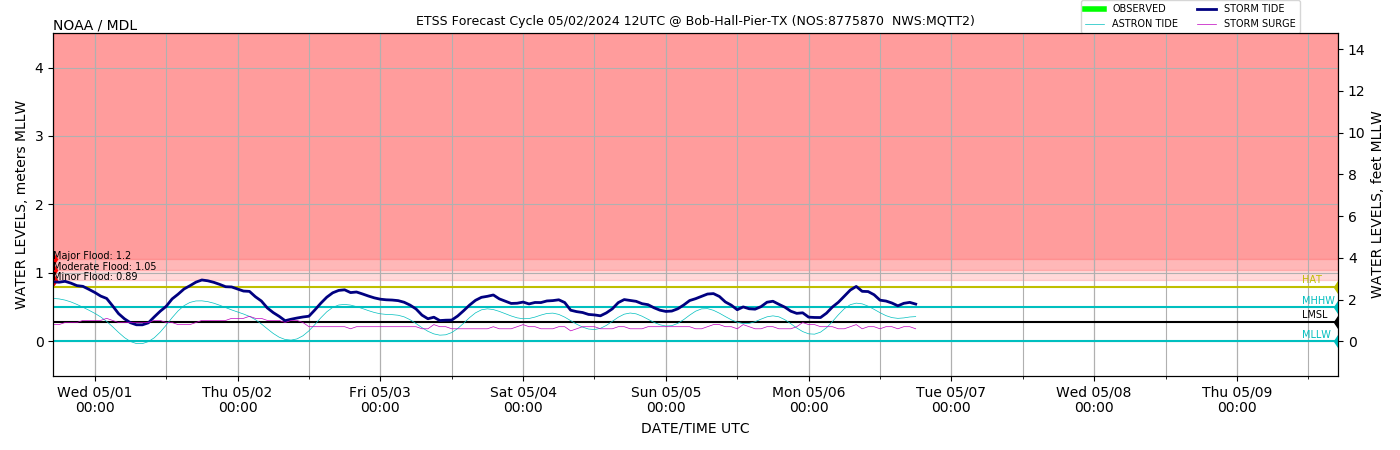
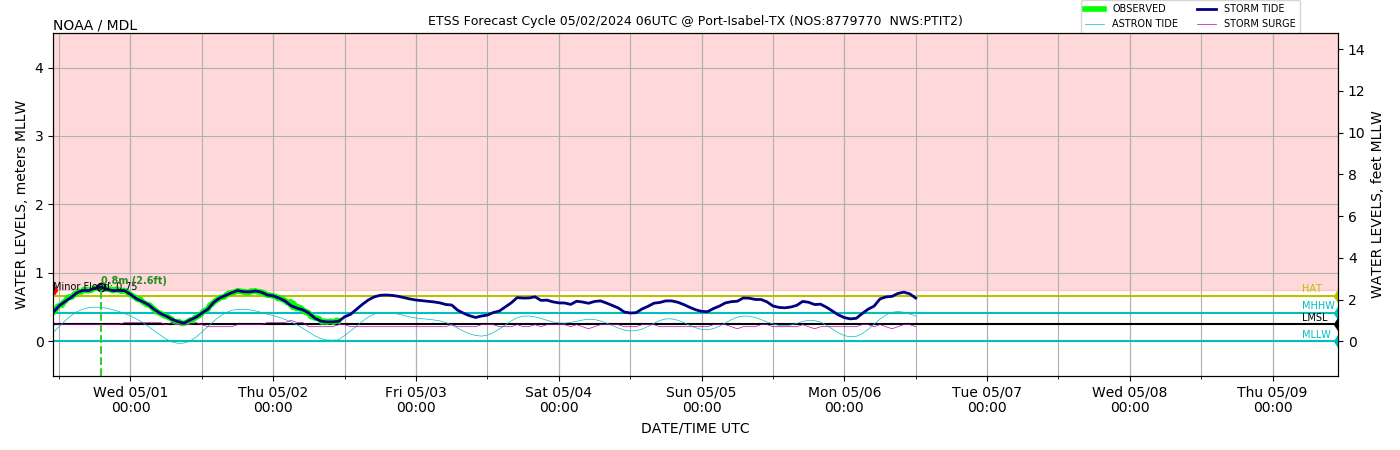
Time Series of Water
Levels at CO-OPS stations. Green curve is OBS Blue curve is ETSS storm tide guidance, bias-corrected Cyan curve is ETSS tidal predictions Magenta curve is ETSS surge guidance |
| Maine |
|
     |
|
| New
Hampshire |
Top |
 |
|
| Massachusetts |
Top |
     |
|
| Rhode
Island |
Top |
    |
|
| Connecticut |
Top |
   |
|
| New
York |
Top |
    |
|
| New
Jersey |
Top |
      |
|
| Pennsylvania |
Top |
  |
|
| Delaware |
Top |
   |
|
| Maryland |
Top |
        |
|
| District of Columbia |
Top |
 |
|
| Virginia |
Top |
       |
|
| North
Carolina |
Top |
      |
|
| South
Carolina |
Top |
   |
|
| Georgia |
Top |
 |
|
| Florida
(ATL) |
Top |
         |
|
| Florida (Gulf Coast) |
Top |
            |
|
| Alabama |
Top |
         |
|
| Mississippi |
Top |
  |
|
| Louisiana |
Top |
            |
|
| Texas |
Top |
                      |
|