Office of Meteorology
Technical Procedures Bulletin
Series No. 478
Created 06/16/2003; revised 04/07/2004.
W/NP21:YYC; LDB; HLT
Subject: The North Atlantic Hurricane Wind Wave Forecasting System (NAH)
THIS IS THE FIRST TPB ON THIS PRODUCT
This bulletin, prepared by Dr. Yung Y. Chao, Mr. Lawrence D. Burroughs, and Dr. Hendrik Tolman, describes a new wave model which is designed to predict wind waves generated by hurricanes in the Western North Atlantic Ocean. This model uses the same 0.25o x 0.25o grid as the Western North Atlantic wave model (WNA) and the same computational and physics schemes as the NOAA WAVEWATCH III model. The NAH uses a blend of model wind outputs from the Geophysical Fluid Dynamics Laboratory (GFDL) Hurricane Model runs for each hurricane being followed and the Global Forecast System (GFS).
The NAH was implemented during the summer of 2001. Output from the model is available to the forecast community on a dedicated line to the Tropical Weather Center/National Hurricane Center, over the Satellite Broadcast to AWIPS, and on NAWIPS.
The North Atlantic Hurricane Wind Wave Forecasting System (NAH) (1)
Yung Y. Chao, Lawrence D. Burroughs, and Hendrik L. Tolman(2)
1. Introduction
The present NCEP operational wave model for predicting global and regional ocean wind waves, NOAA WAVEWATCH III (NWW3) (Tolman 2002), uses wind data derived from the Global Forecast System (GFS, Kanamitsu et al 1991; Caplan et al 1997). It is well known that the details of highly intense and rapidly varying nature of the wind field associated with a tropical cyclone is poorly resolved by the GFS because its grid isn't fine enough. As a result, predicted wave conditions in areas under the influence of tropical storms usually are under predicted when GFS winds are used. Also, predicted directions and arrival times of swells in coastal areas tend to be inaccurate.
In order to provide a more accurate forecast of the storm track, intensity, and wind distribution, NCEP uses a separate model to generate the hurricane wind structure. This model, developed by the Geophysical Fluid Dynamics Laboratory (GFDL), is called the multiply nested movable mesh hurricane model (e.g., Kurihara and Bender 1980; Kurihara et al 1990, 1995, and 1998) and is used during the hurricane season to produce forecast guidance for the National Hurricane Center. The model, however, considers only one storm at a time. When multiple storms exist simultaneously, a frequent event, one storm is considered at a time with the fine inner mesh grid, while the others are dealt with in the course outer mesh only. The details of their wind field structures are again not adequately described. Consequently, the combined effects of various wind fields associated with multiple storms on ocean waves cannot be adequately predicted by using a single run of the GFDL model. Therefore, the GFDL must be run for each storm currently occurring, so the detailed wind field structure of each storm can be captured. Furthermore, since the hurricane model uses a movable grid system, the domain for each model run does not necessarily cover the entire wave model domain. The problem is how to incorporate the wind fields from the various runs of the GFDL model with the background wind field of the GFS, to produce the most realistic wave field.
A procedure for unifying the wind from the GFS and that from the GFDL model for single or multiple storms has been developed. The procedure has been used to predict hurricane associated wind waves over the North Atlantic Ocean during the 2000 hurricane season from September through October. In what follows we will describe the procedure for predicting hurricane winds and waves, show the results of validation against observations, and present available products and planned dissemination routes for the hurricane season.
2. Hurricane Wind Field Specification for Wave Forecasting
The present operational GFDL hurricane model produces output data for the outer and inner mesh 4 cycles per day at hourly intervals up to 78 hours. The outer mesh has a grid resolution of 1/3 by 1/3 degree covering an area of 75 by 75 degrees in latitude and longitude. The inner mesh has a grid resolution of 1/6 by 1/6 degree covering an area of 11 by 11 degrees. The center of the inner mesh is coincided with the center of the storm (the location of the lowest pressure). The operational GFS model provides output 4 cycles per day at 3-h intervals up to 168 hours. At this time we use the GFS winds from the 0000, 0600, 1200 and 1800 UTC cycles out to 78 hours. The first step is to interpolate lowest level wind data from GFS and GFDL grids at the same projection hour onto the North Atlantic Hurricane wave model (NAH) domain which is identical to the domain and grid resolution (0.25o x 0.25o lon/lat) of the Western North Atlantic wave model (WNA, Chao et al 2003) and adjust it to a height of 10 m. Since the GFDL hurricane model runs for each selected storm separately, discrepancies in the wind field features for the same storm from different model runs may occur if multiple storms co-exist. In order to resolve this problem, the concept of an area of influence (AOI) for each storm is introduced. Various definitions of AOI have been considered and tested. We have found that the following procedure provides the most realistic and consistent wind field structure:
3. Operational Procedure of Hurricane Wind-Wave Forecasting
The NAH is nearly identical to the WNA, a description of which can be found in Chao, Burroughs and Tolman (2003).The hurricane generated wind-wave forecasting procedure for the NAH is quite straightforward and is used during the entire hurricane season.
4. Performance Evaluation
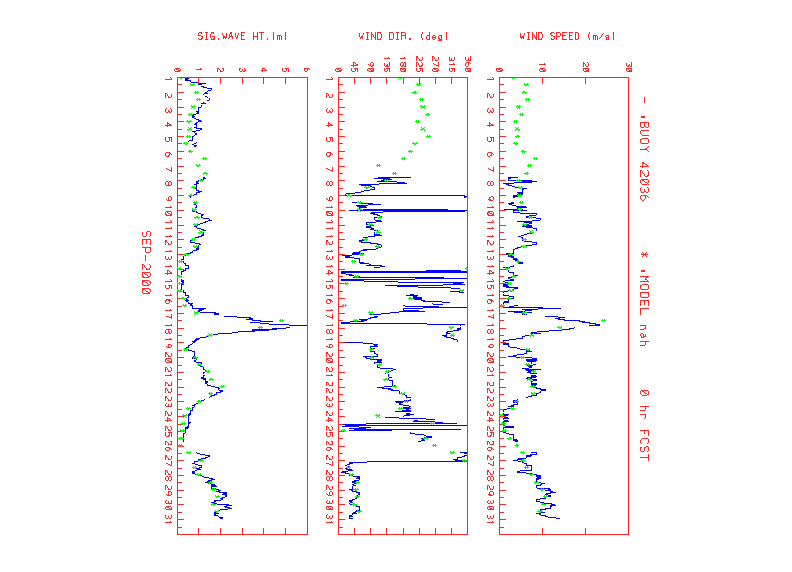
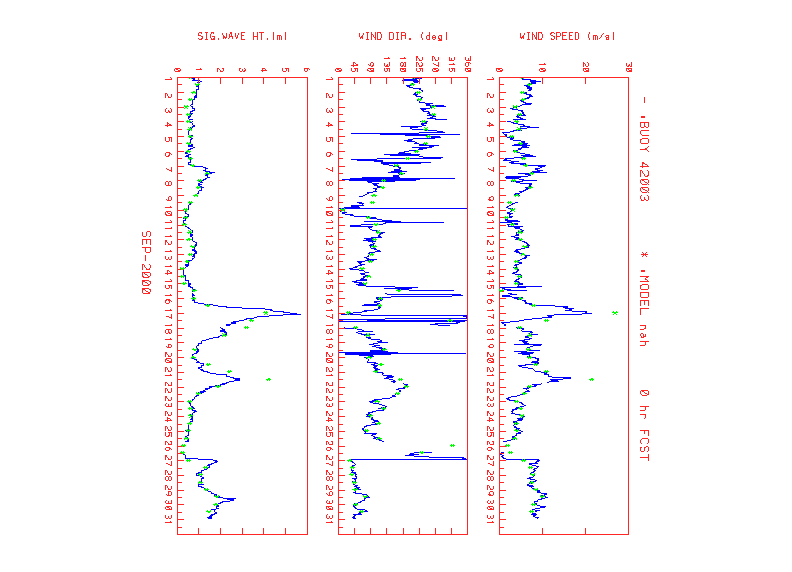
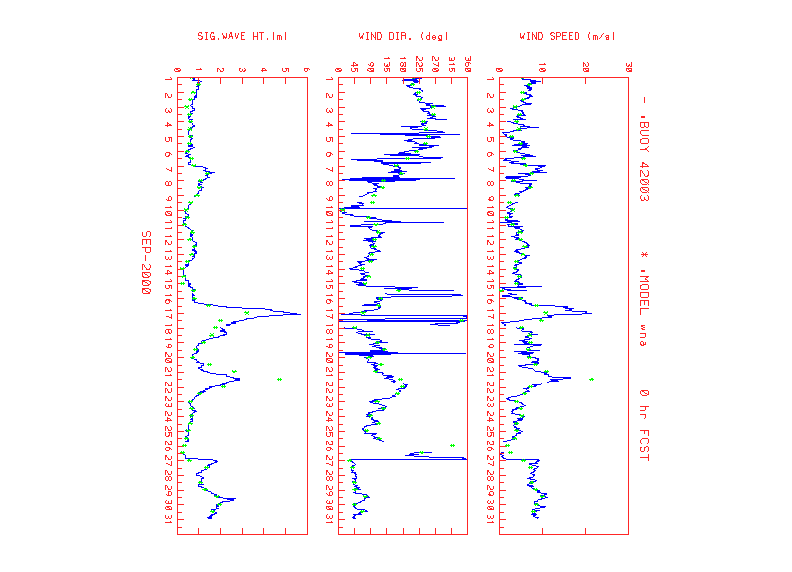
During September and October 2000, the procedures developed above were applied in a test mode. The system was run twice daily for the 0000Z and 1200Z UTC cycles. Figure 1 shows the tracks of all tropical storms that occurred during this period. The location of all available buoys is also given in the figure. Most of storm tracks are far away from buoys or storm strength is too weak to cause discernable wave height except Hurricane Gordon (officially named, September 14-18) and Helene (officially named, September 15-22). Figure 2.a shows the time series comparisons of measurements at Buoy No. 42036, which is located near the West Coast of Florida, and the NAH model predictions of the significant wave height, wind speed and wind direction interpolated to the buoy location from the surrounding grid point values. Similar time series for WNA model are given in Figure 2.b. The first peak in wave height in both figures appears near the 17th and 18th of September corresponds to Hurricane Gordon, while the second peak near the 22nd corresponds to Hurricane Helene. Figures 3.a and 3.b are similar time series plots for Buoy 42003 which is located in the deep water of the Gulf of Mexico. These figures indicate that the NAH (blended winds) provides more accurate prediction of waves than those of the WNA (GFS winds only).
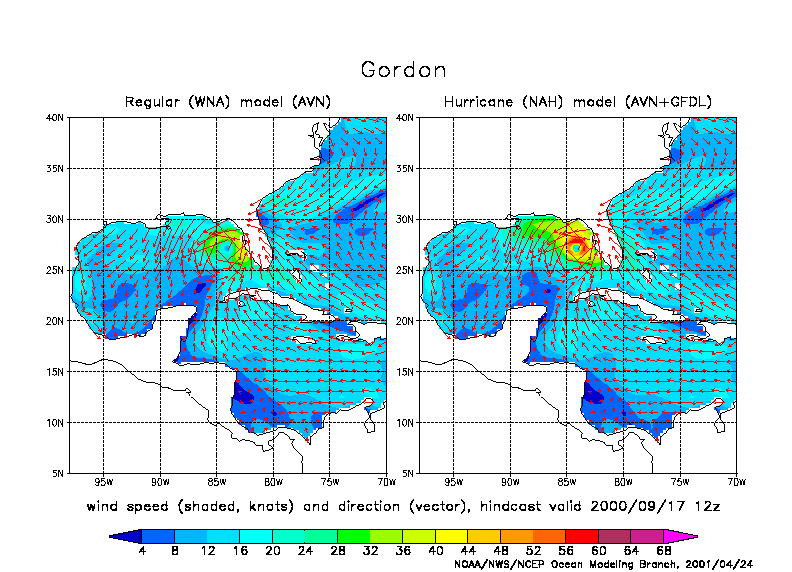
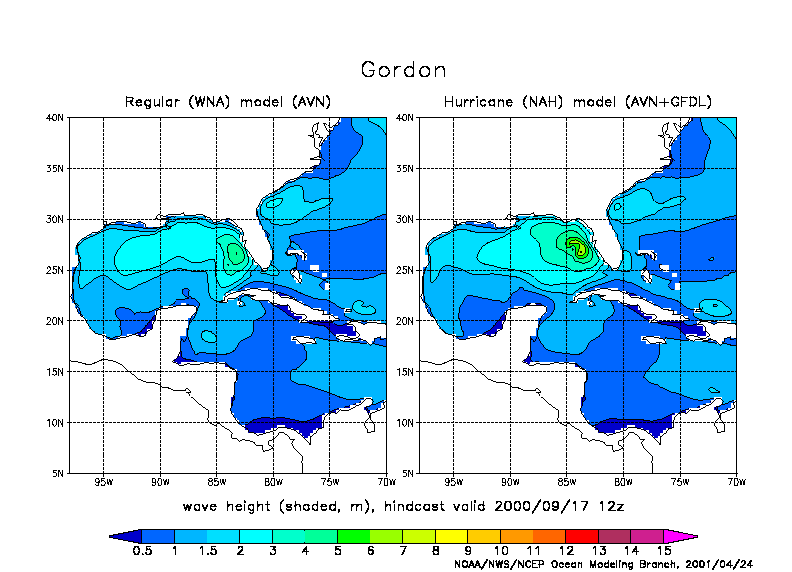
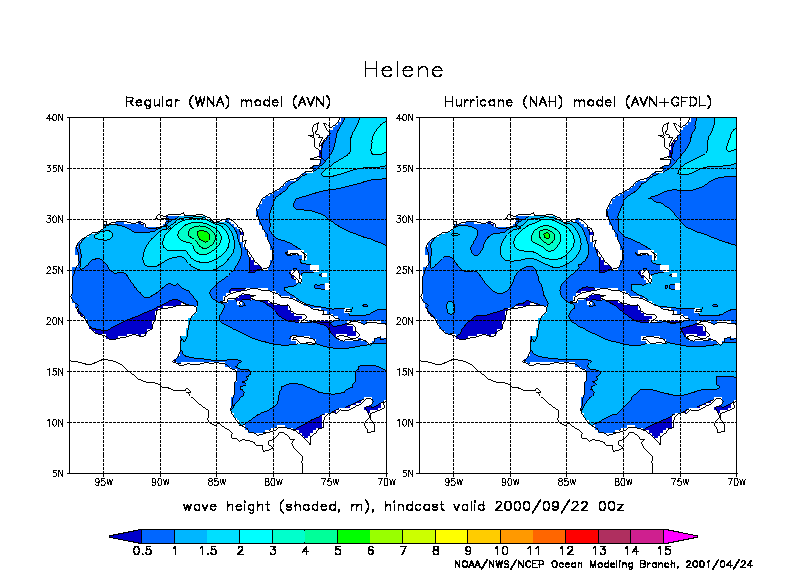
Figure 4.a depicts the difference between the GFS wind field and the blended GFS and GFDL wind field for Hurricane Gordon. Immediately noticeable are the differences in scale and intensity of the wind fields. The resulting wave fields are also substantially different as shown in fig. 4.b. Examples of wind and wave fields associated with hurricane Helene are shown in figures 5.a and 5.b. Here, the GFS wind field is somewhat lower than the blended wind field, but covers a much larger area than the blended wind field. This results in a larger field of high waves by using the GFS wind field than by using the blended wind field. Hurricane Helene tracked to the west of buoy 42036 in the Gulf of Mexico and showed the waves from Helene to be reasonably low at that location. The waves predicted at buoy 42036 by the WNA with the GFS wind field were too high, while those predicted by the NAH with the blended wind field were very close to the observed waves. The difference being due to the difference in aerial coverage of the two wave fields generated by the different wind inputs.
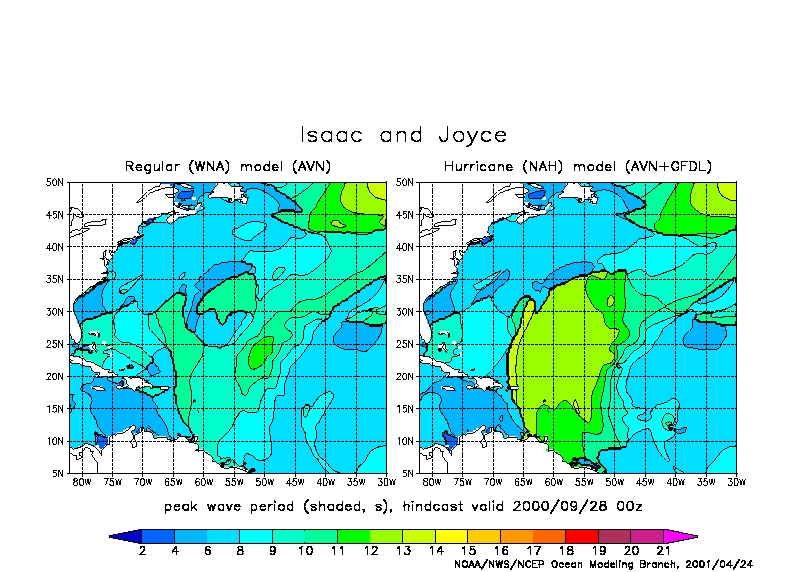
An important aspect in forecasting hurricane generated waves is the ability to provide information about swell conditions in coastal areas while one or more hurricanes are still far offshore. Many accidents occur near the coast where the weather is quite nice, yet dangerously high swells generated by hurricanes several hundred miles away begin to arrive. Figure 6.a shows the GFS and blended wind field pattern when hurricanes Isaac and Joyce co-exist during September 25 through October 1 in the far distance Atlantic Ocean from the East Coast. The blended wind field depicts the extent of the high winds of both hurricanes. This wind field results in a large front of long period waves well in front of the storms which will propagate to the East Coast area much faster than predicted by WNA (see fig. 6b).
5. Products and Dissemination
The following wind and wave parameters will be available in GRIB format at
ftp://polar.ncep.noaa.gov/pub/waves and
on AWIPS as GRIB bulletins (see Table 1):
6. Concluding Remarks
An operational system for forecasting North Atlantic Hurricane wind waves and swells (NAH) using blended GFDL and GFS model winds has been developed, tested, and operated during the hurricane seasons of 2001 and 2002. Results of the validation study and the two preceding hurricane seasons show that the forecasting system provides more realistic hurricane wave predictions than those provided by the WNA which uses GFS winds only. The new system, in general, predicts much higher wave heights over the areas within hurricane influence and earlier arrival of longer and higher swells in coastal areas.
7. References
Caplan, P., J. Derber, W. Gemmill, S., -Y. Hong, H.,-L. Pan and D. Parish, 1997: Changes to the NCEPoperational medium-range forecast model analysis/forecast system. Wea. Forecasting, 12, 581-594.
Chao, Y. and H. Tolman, 2000: Numerical experiments on predicting hurricane generated wind waves. Preprints of the 6th International Workshop on Wave Hindcasting and Forecasting, Monterey, California, November 6-10, 2000, 167-179.
Chao, Y., L. Burroughs and H. Tolman, 2003: Wave Forecasting for the western North Atlantic and Adjacent Waters. Technical Procedures Bulletin No. 495, National weather Service, NOAA, U.S. Department of Commerce. [Available on the web at http://polar.ncep.noaa.gov/mmab/tpbs/operational.tpbs/tpb495/tpb495.htm.]
Kanamitsu, M., J. C. Alpert, K. A. Campana, P. M. Caplan, D. G. Deaven, M. Iredell, B. Katz, H. -L. Pan, J. E. Sela, and G. H. White, 1991: Recent Changes implemented into the global forecast system at NMC. Wea. Forecasting, 6, 425-435.
Kurihara, Y., and M. A. Bender, 1980: Use of a movable nested mesh model for tracking a small vortex. Mon. Wea. Rev., 108, 1792-1809.
Kurihara, Y., M. A. Bender, R. E. Tuleya, and R. J. Ross, 1990: Prediction experiments of Hurricane Gloria (1985) using a multiply nested moveable mesh model. Mon. Wea. Rev., 118, 2185-2198.
Kurihara, Y., M. A. Bender, R. E. Tuleya, and R. J. Ross, 1995: Improvements in the GFDL hurricane prediction system. Mon. Wea. Rev., 123, 27-2801.
Kurihara, Y., R. E. Tuleya, and M. A. Bender, 1998: The GFDL hurricane prediction system and its performance in the 1995 hurricane season. Mon. Wea. Rev., 126, 1306-1322.