


| Home |
Product Viewer |
Product Table |
Product Descriptions |
Model Description |
Model Validation |
Model Data Access |
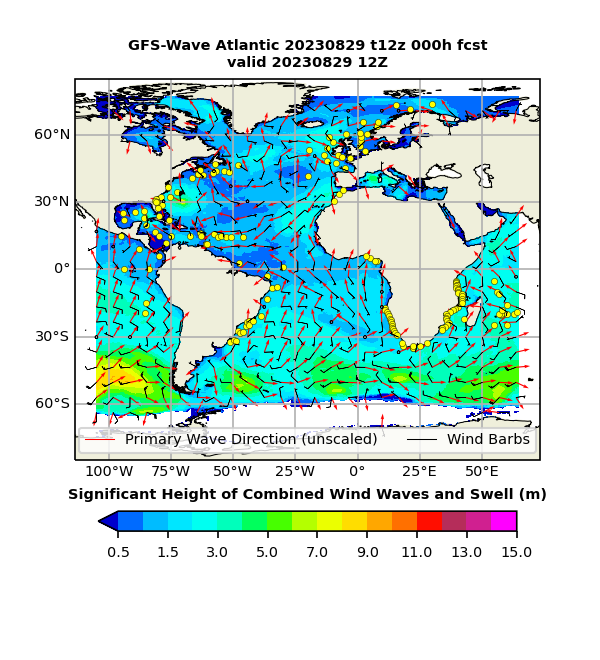
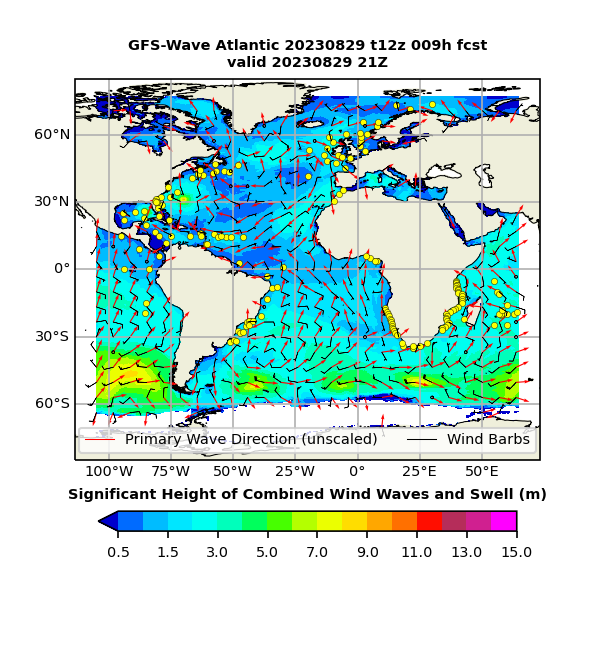
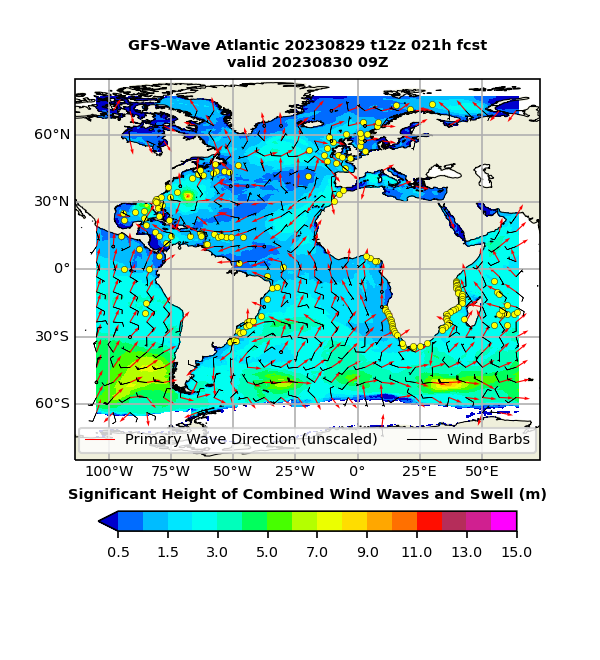
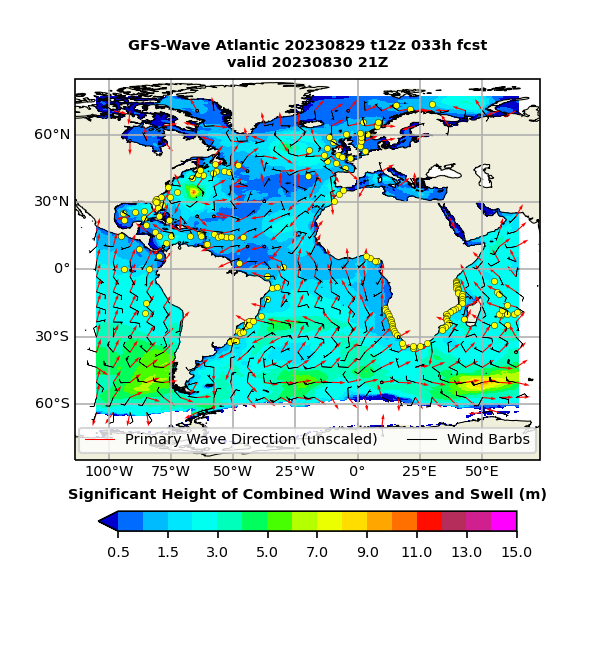
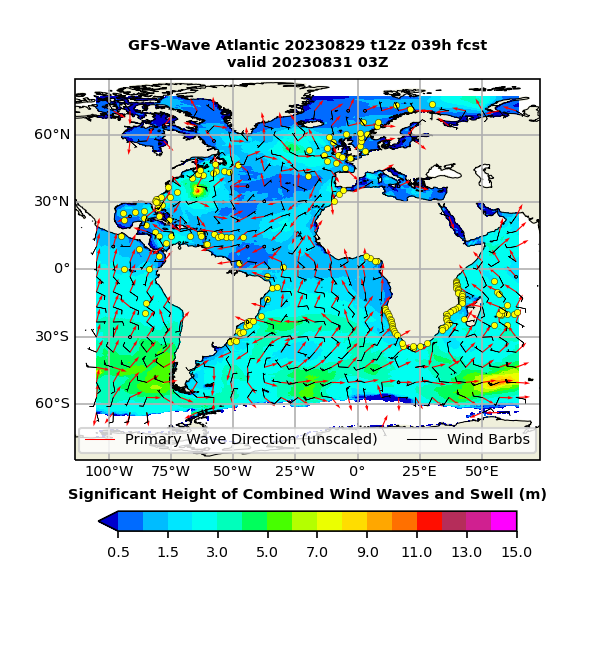
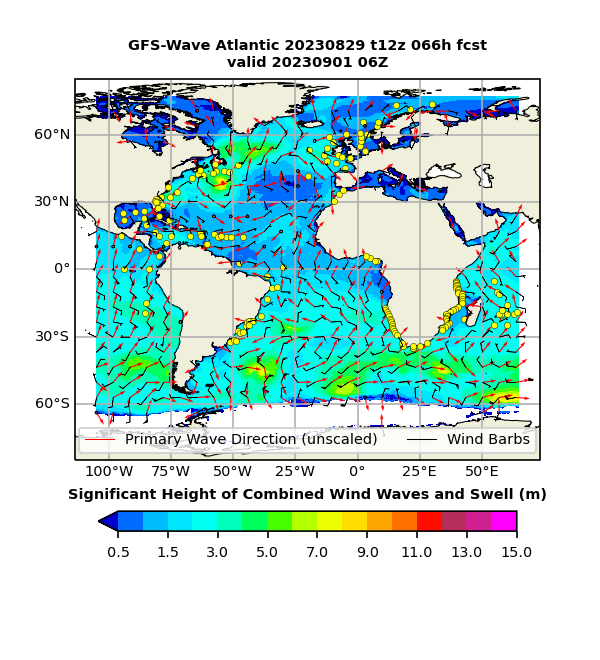
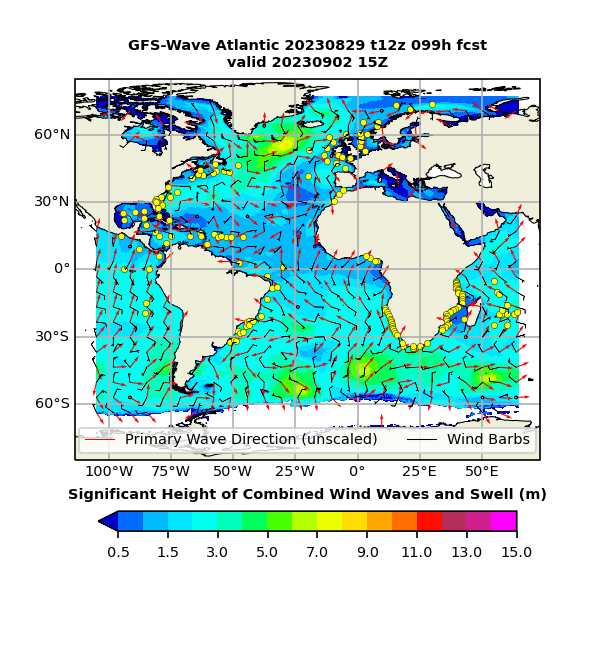
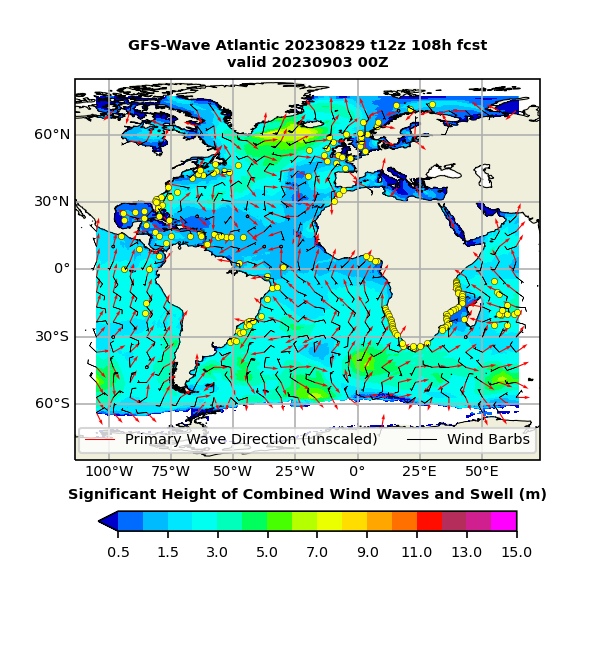
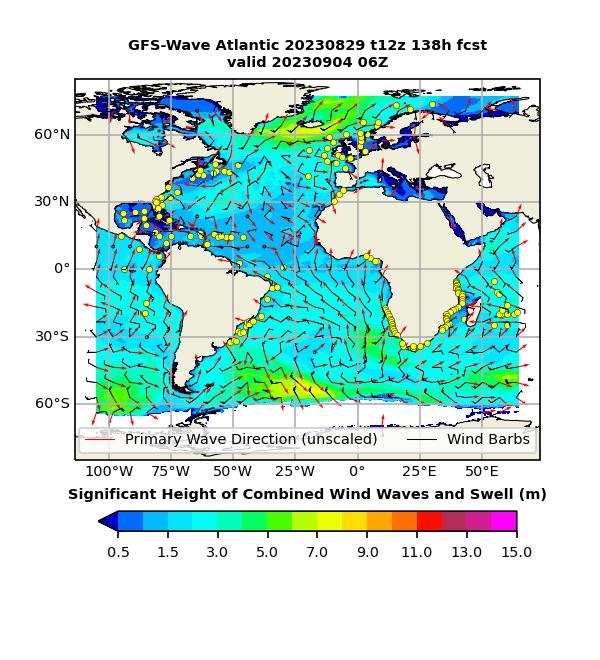
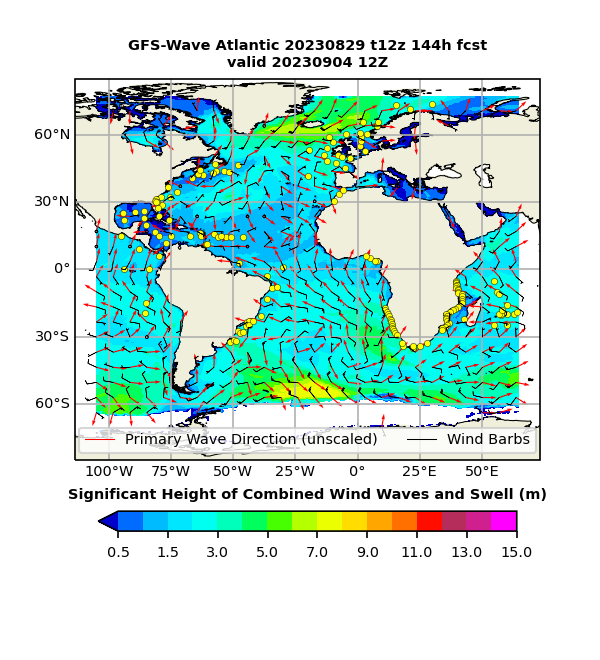
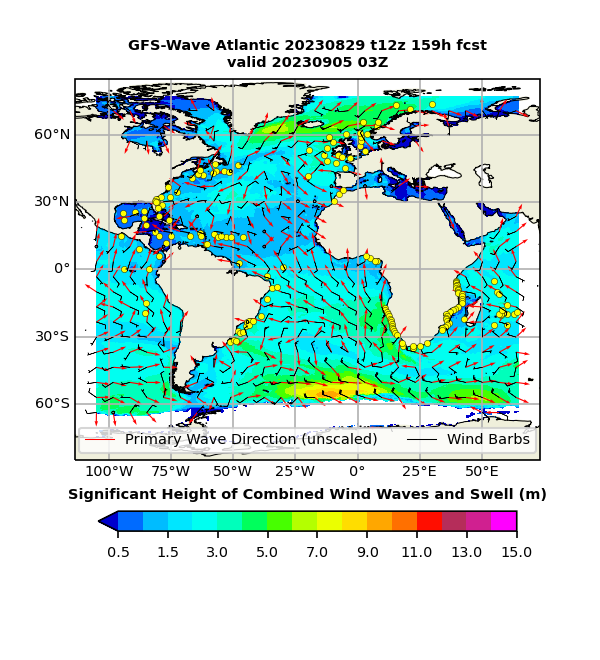
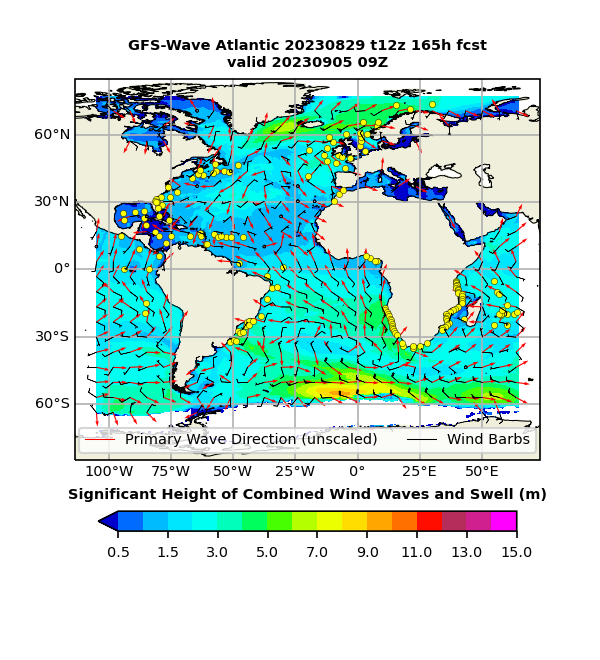
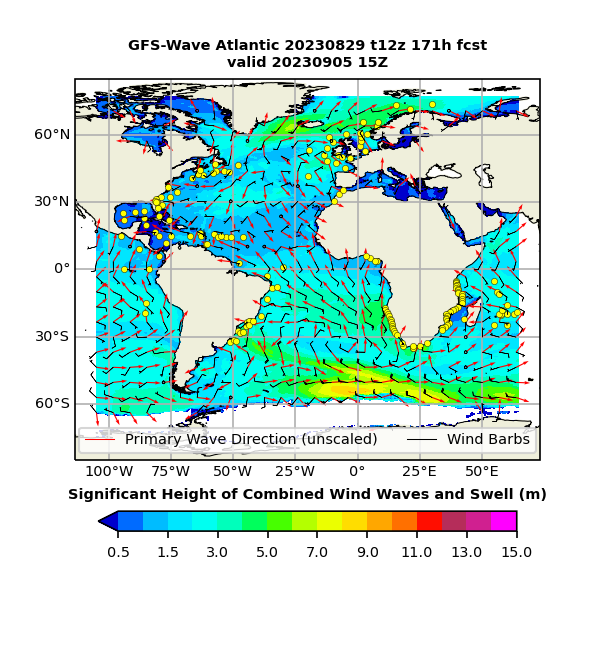
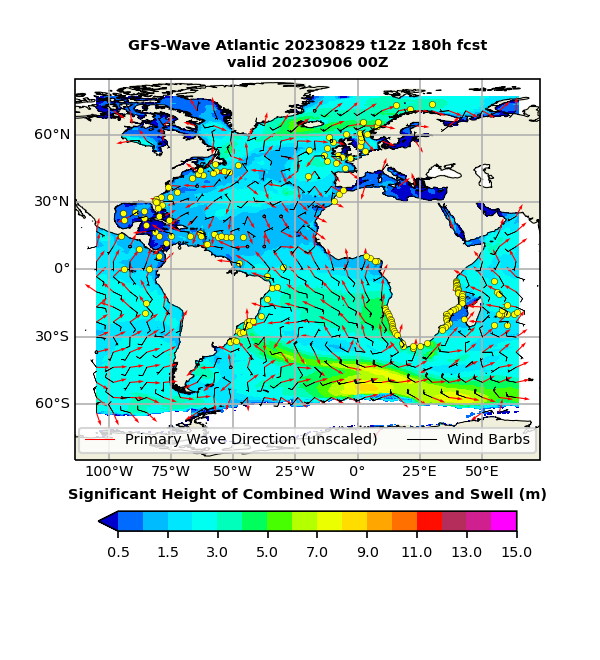
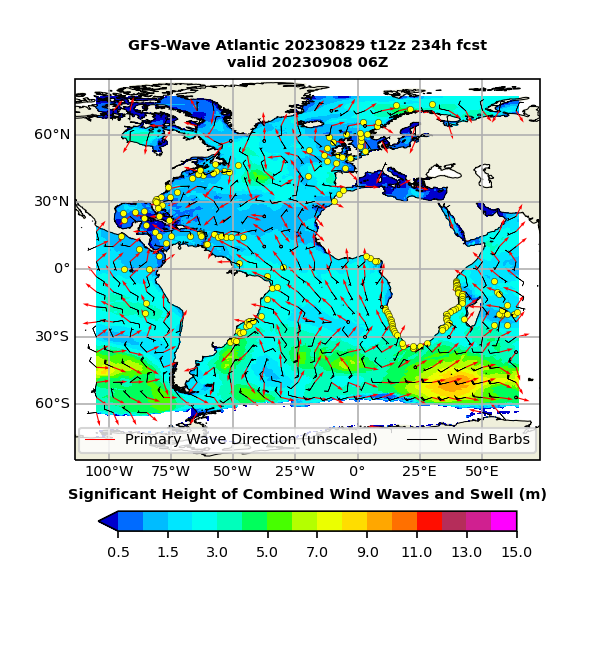
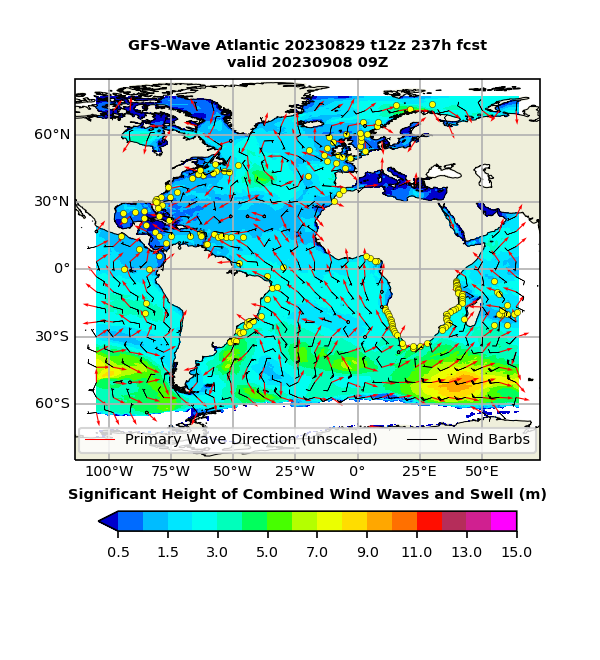
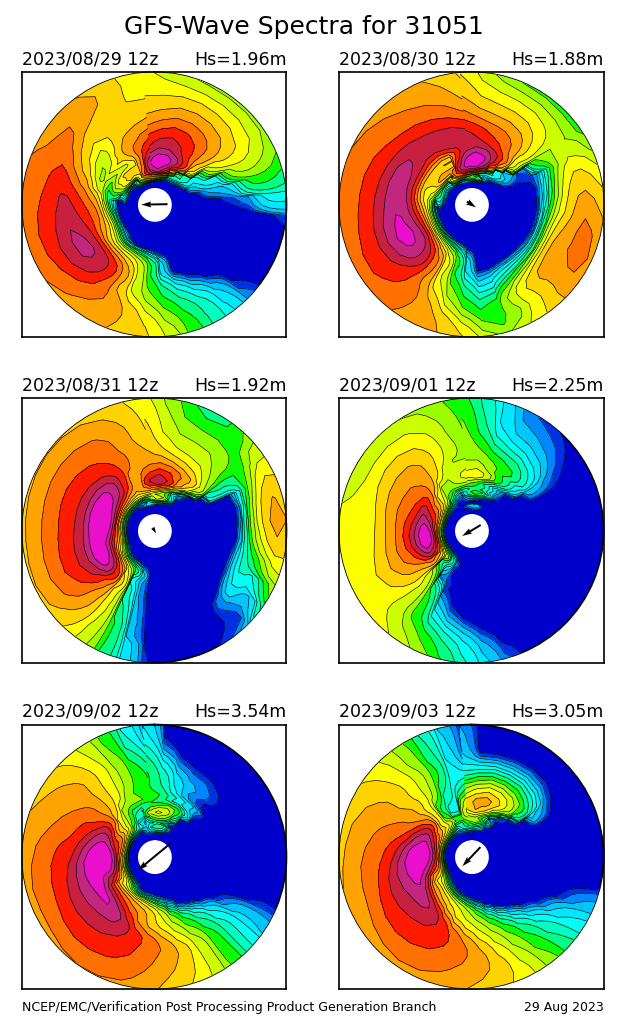
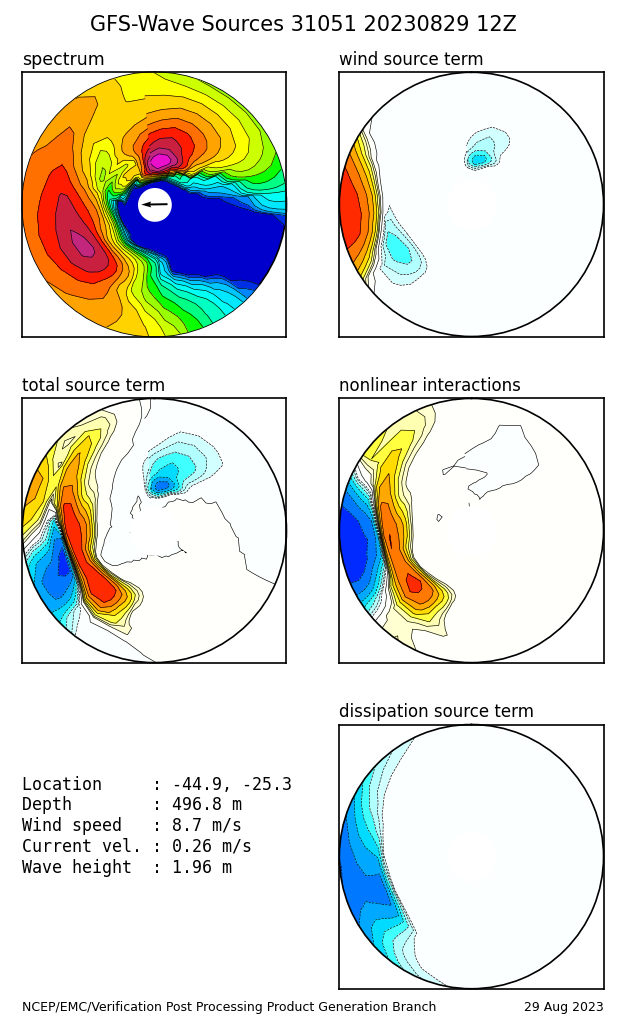
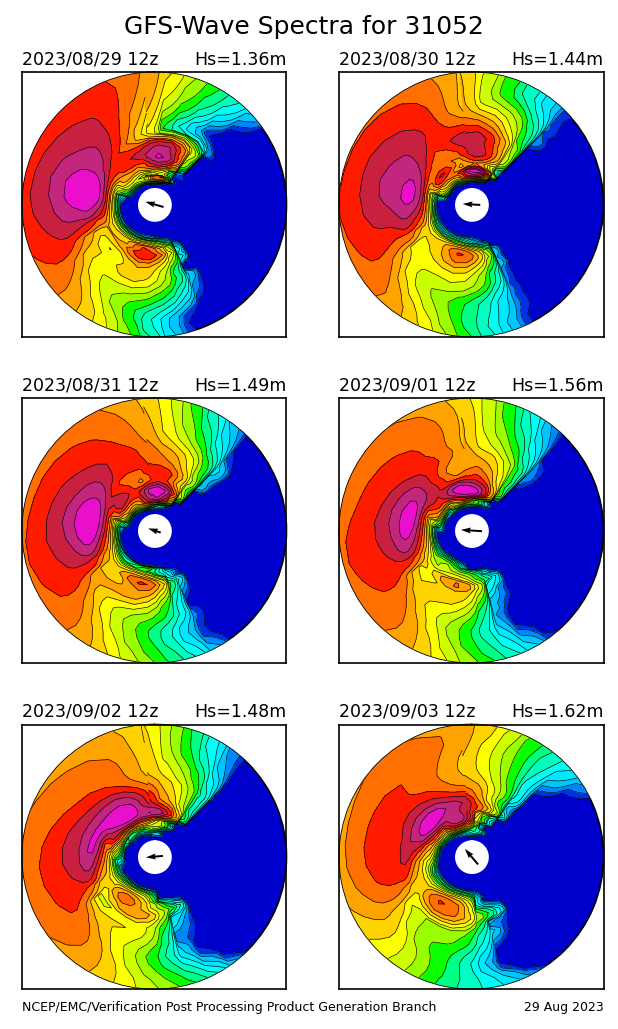
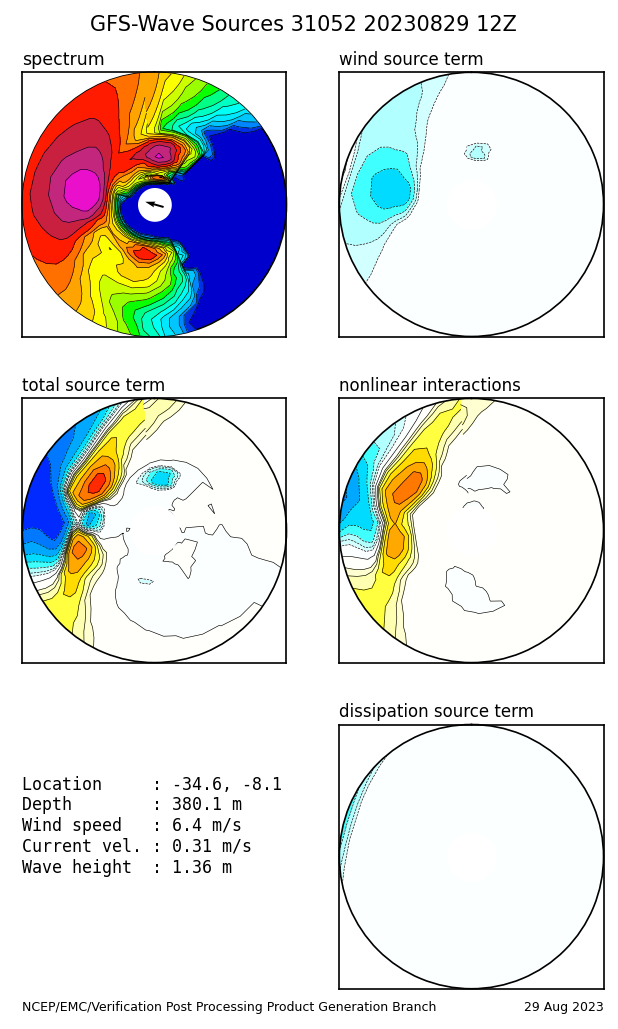
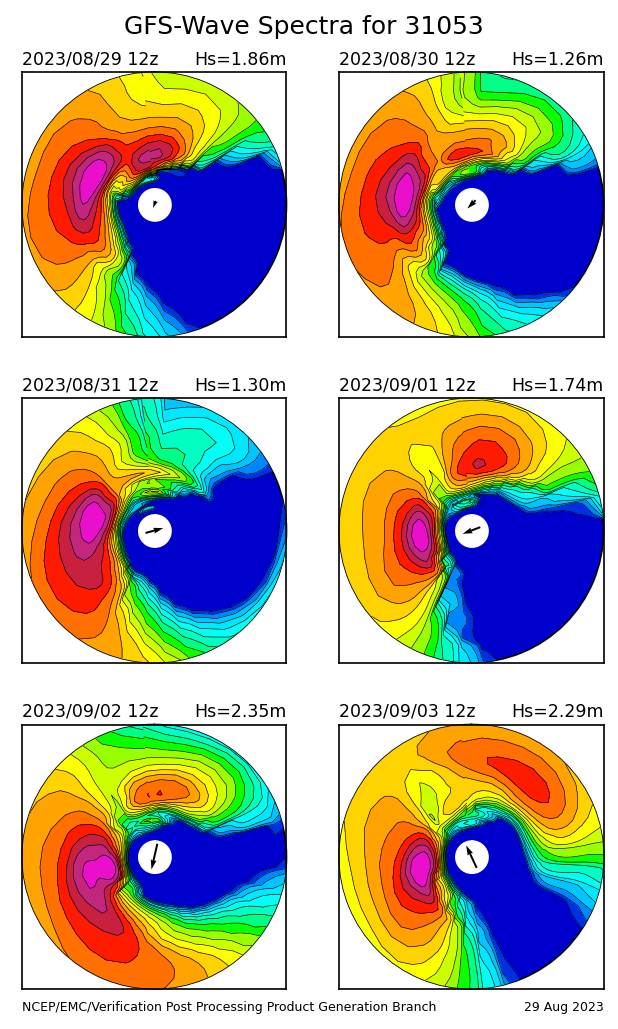
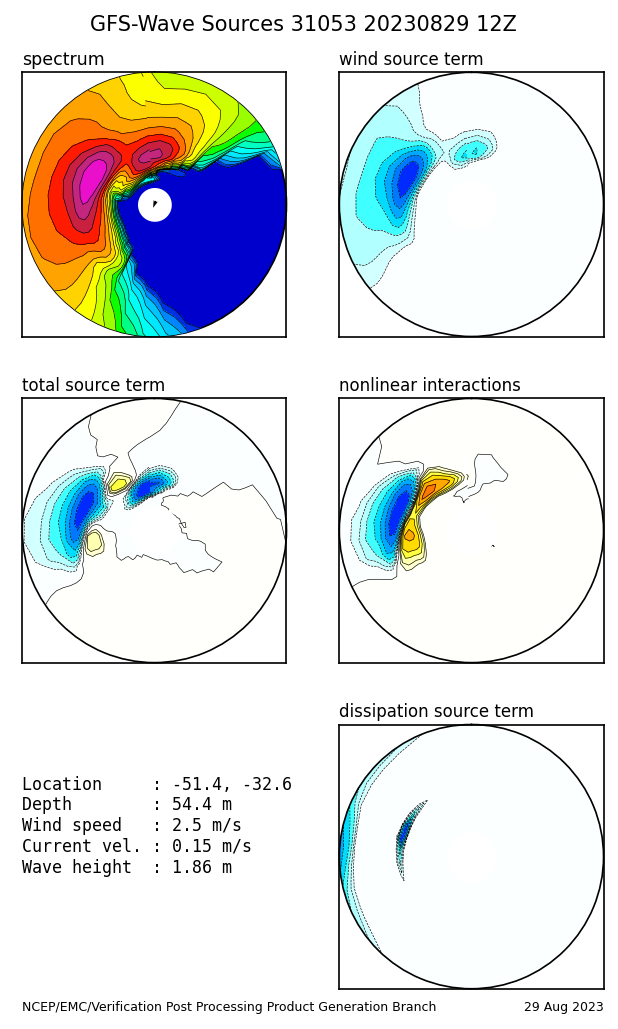
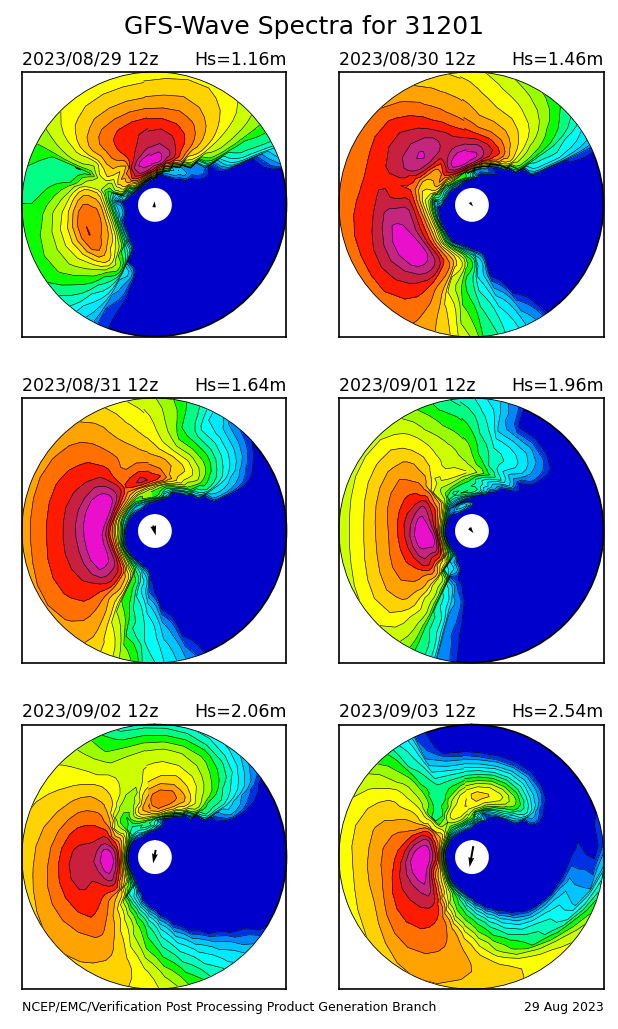
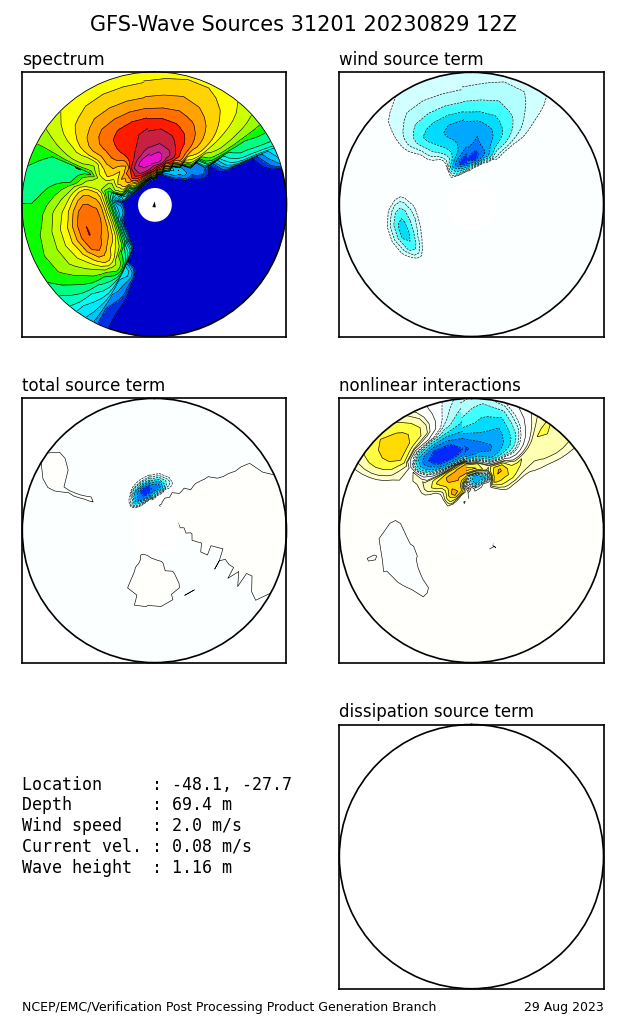
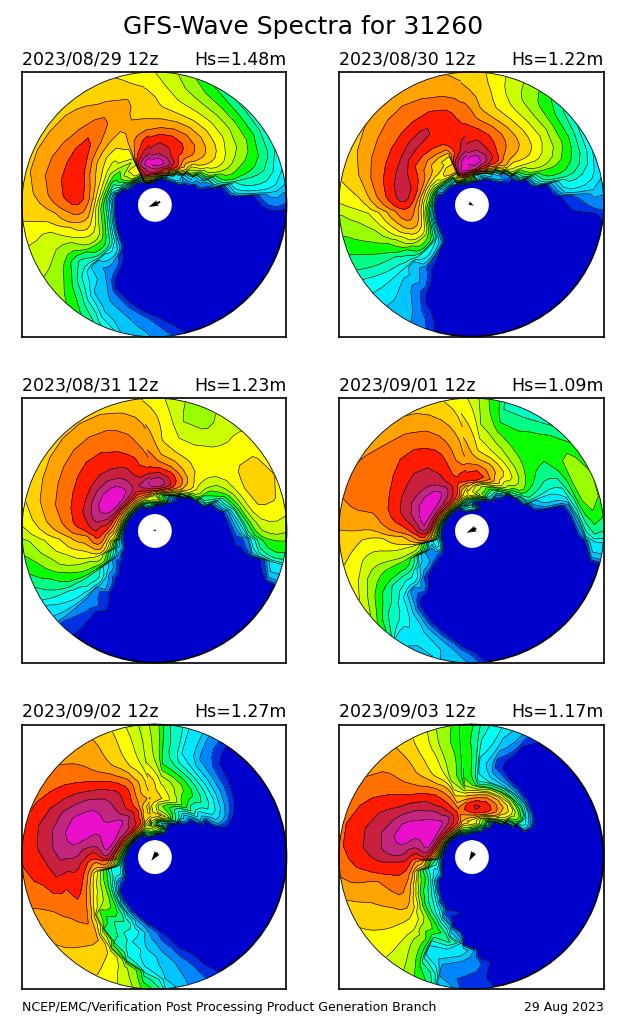
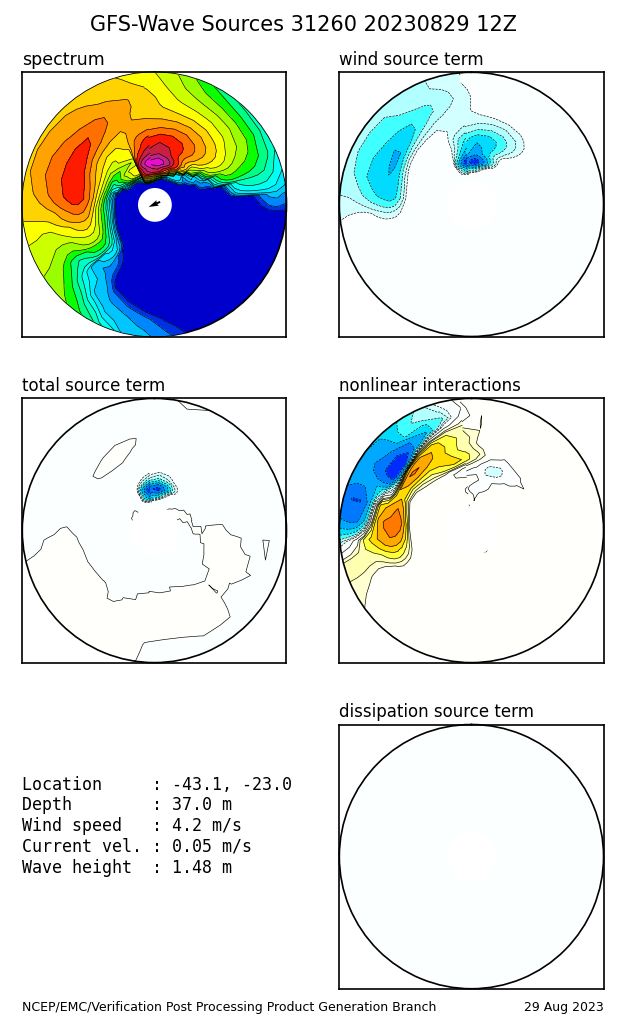
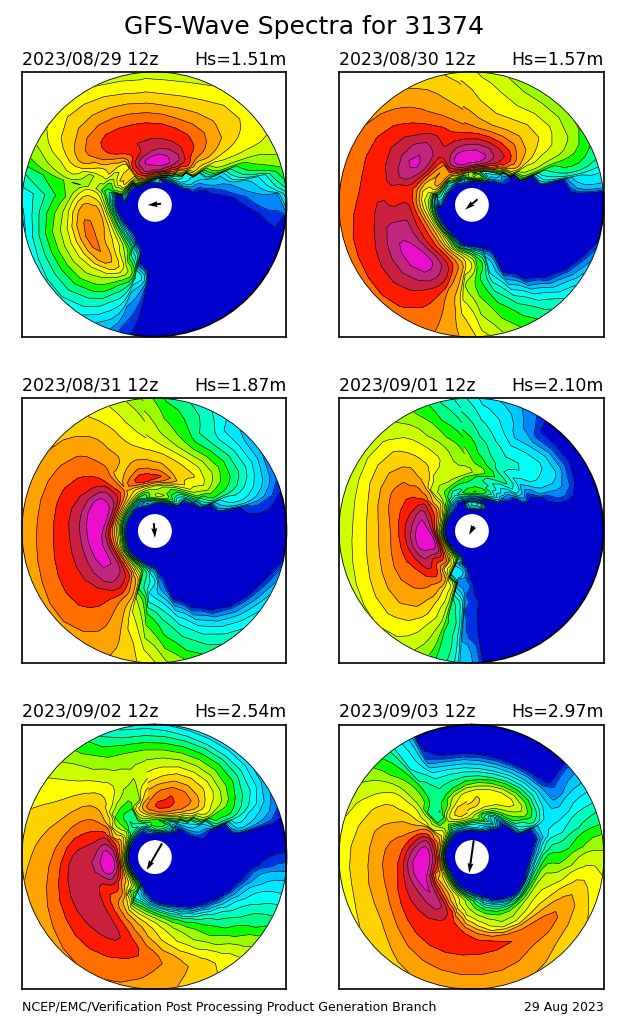
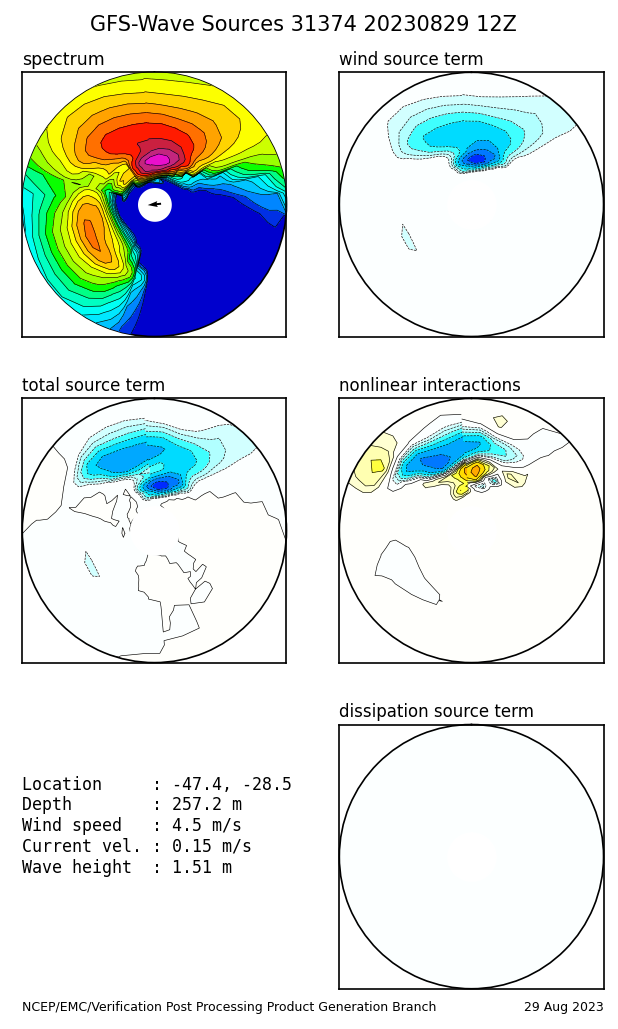
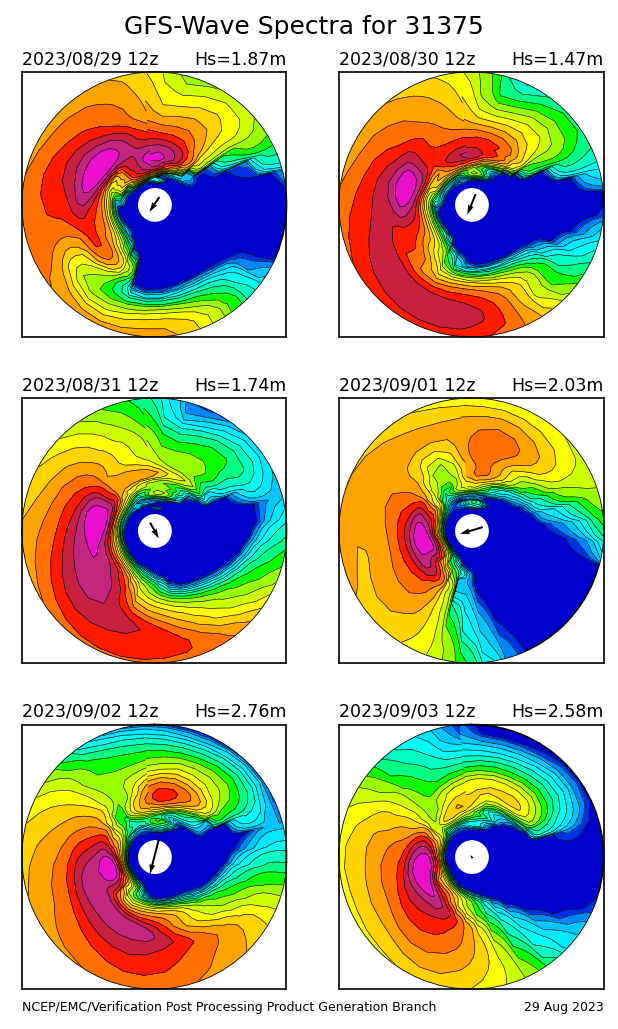
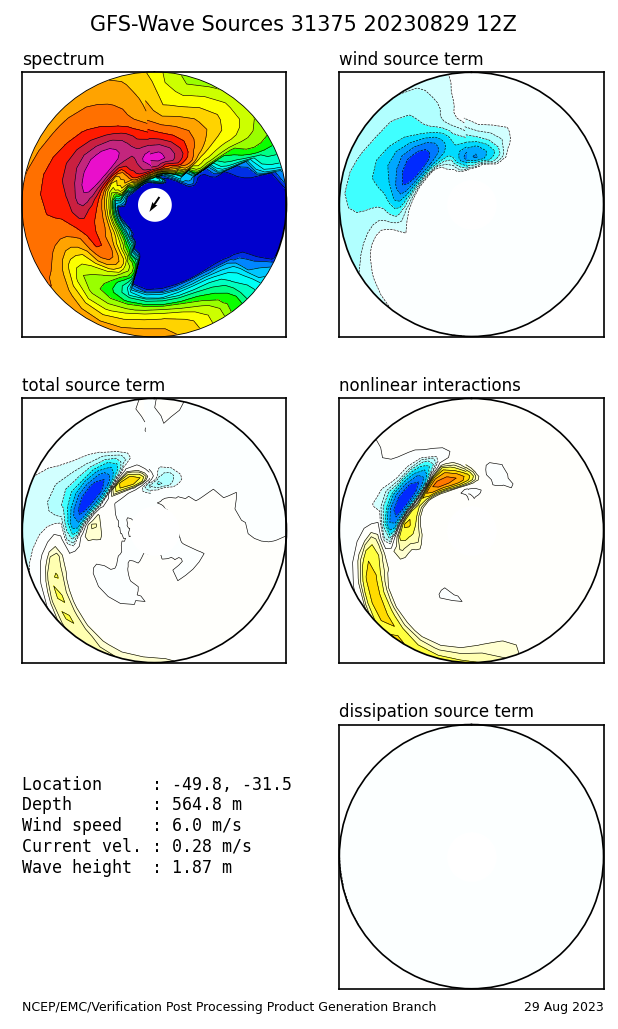
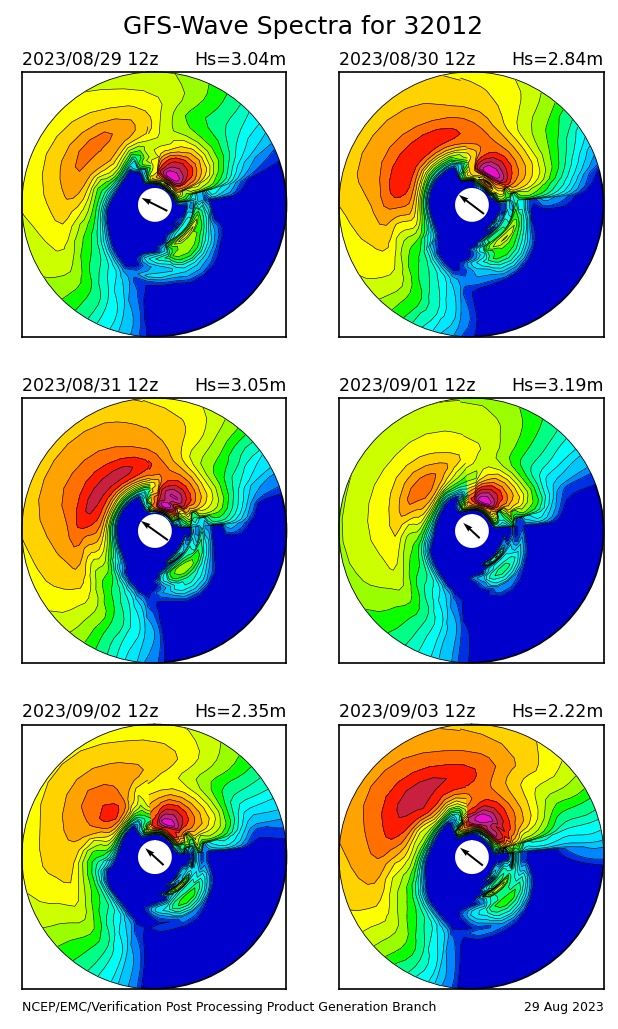
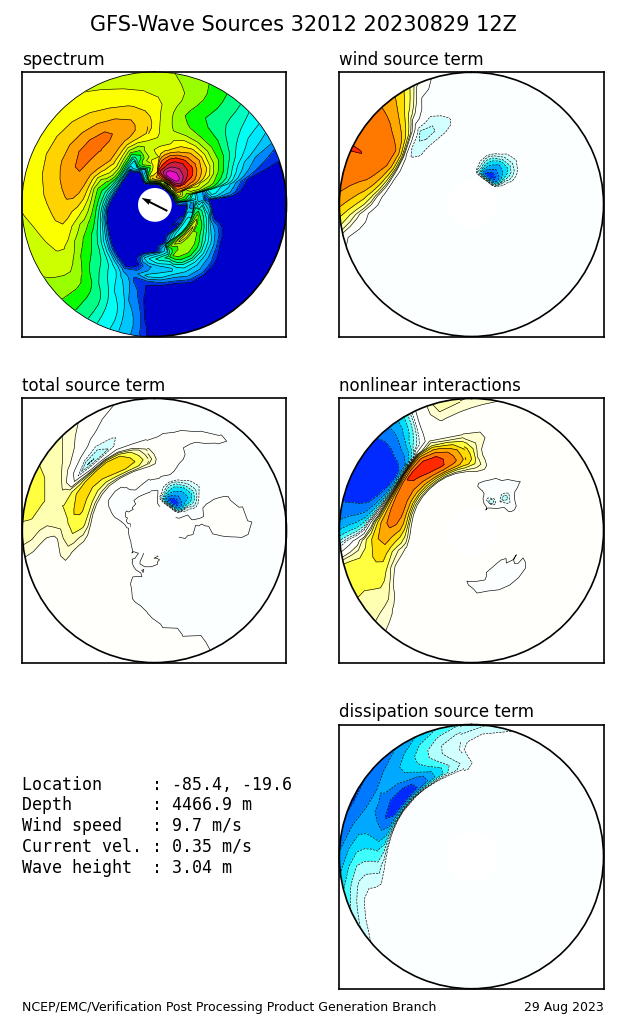
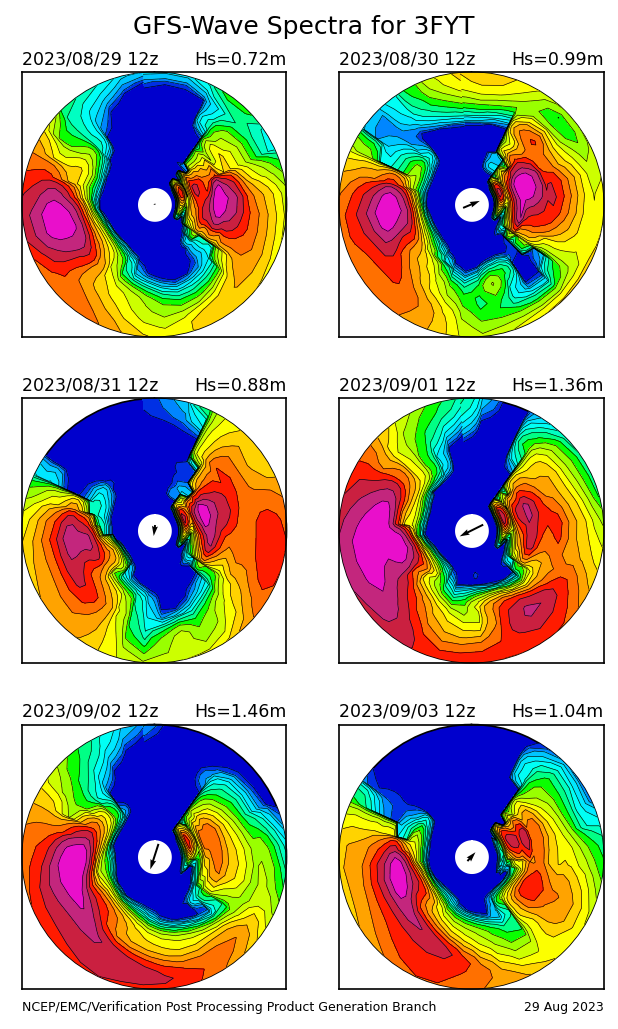
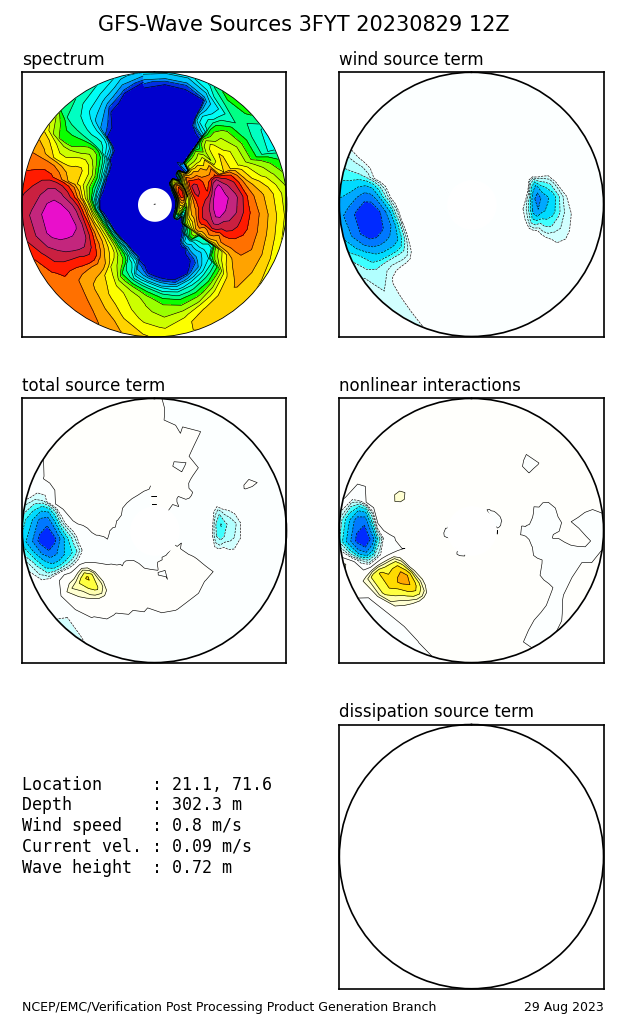
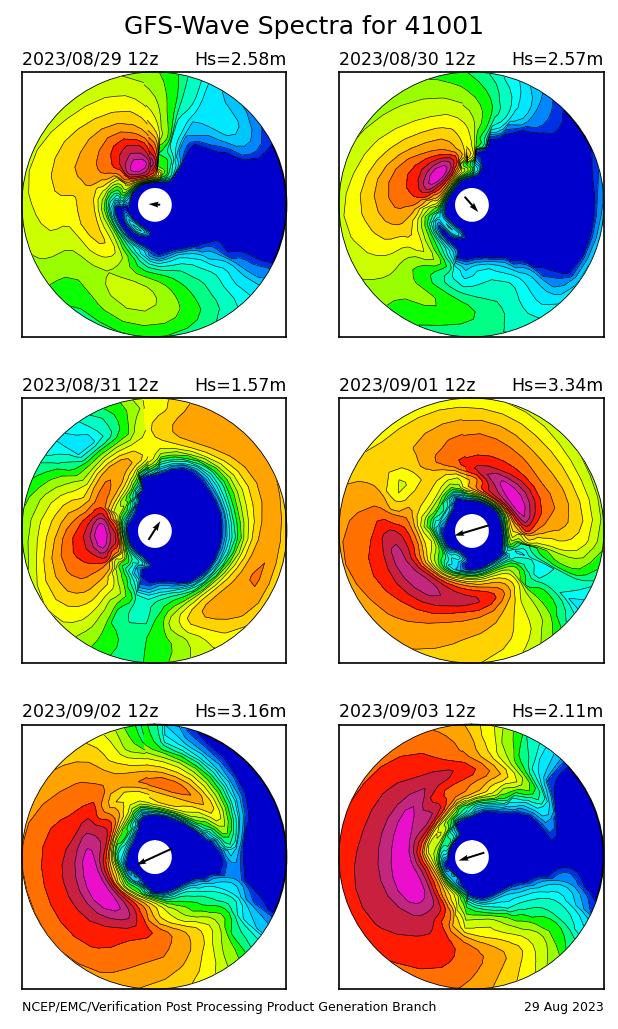
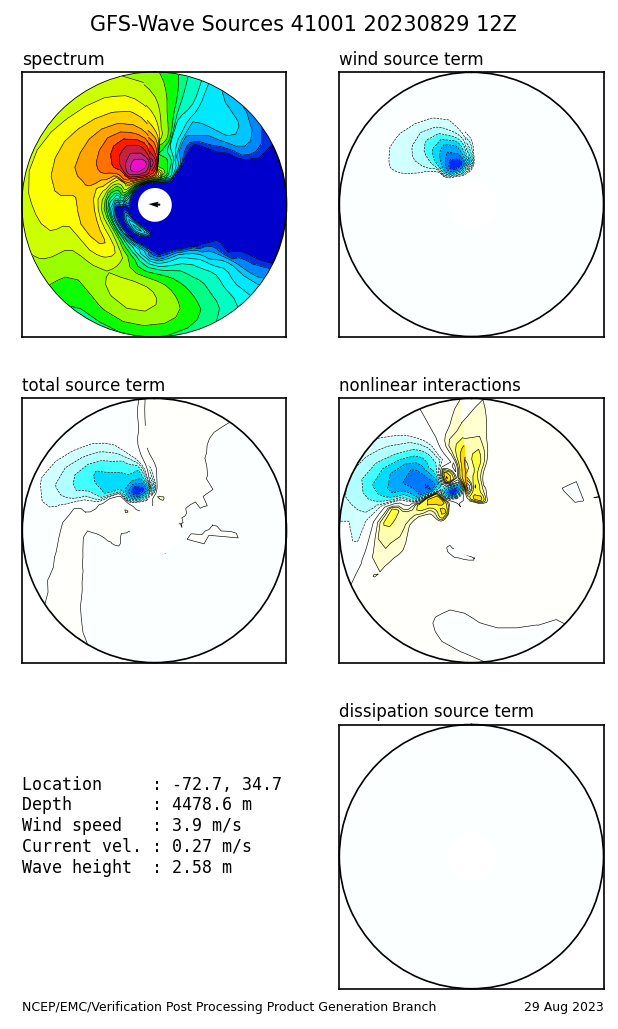
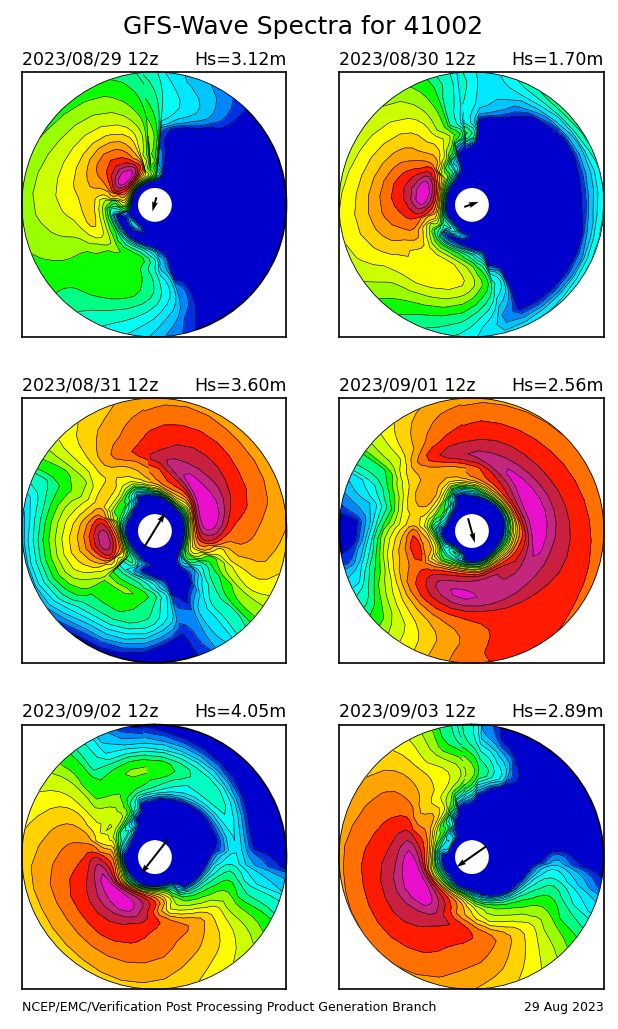
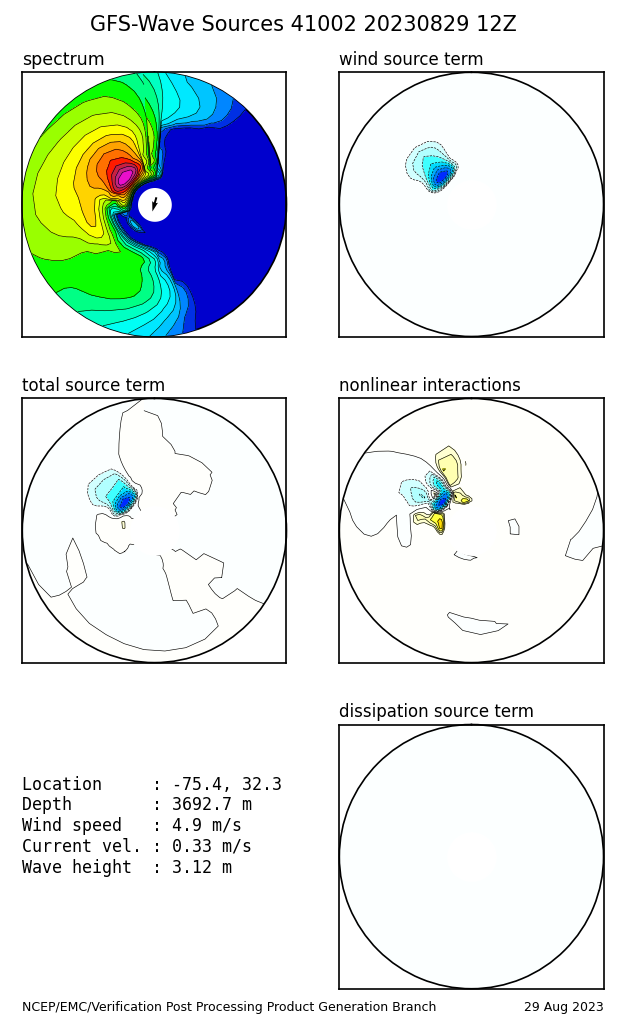
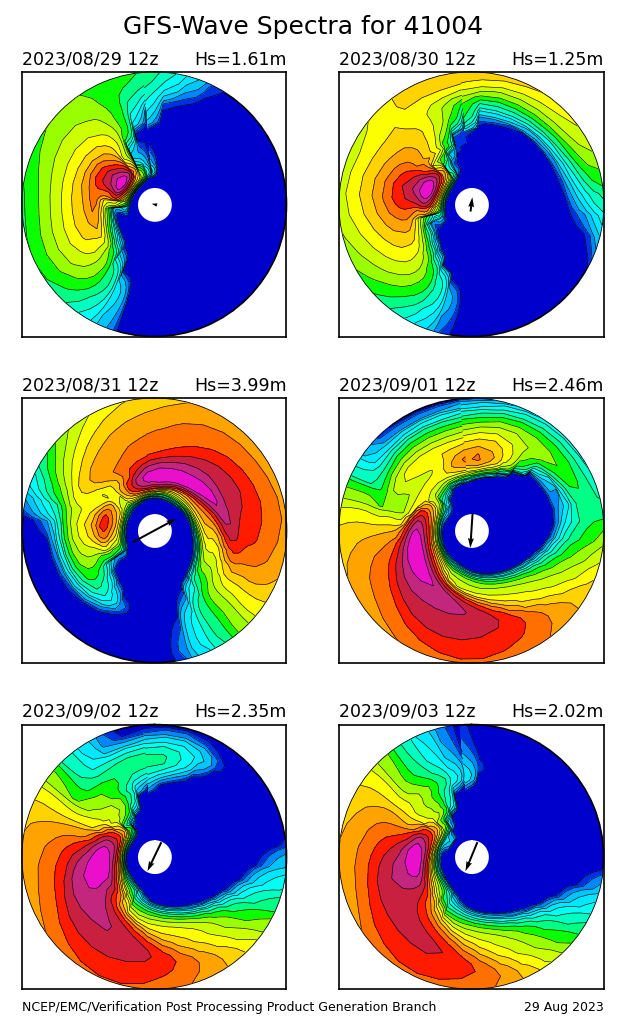
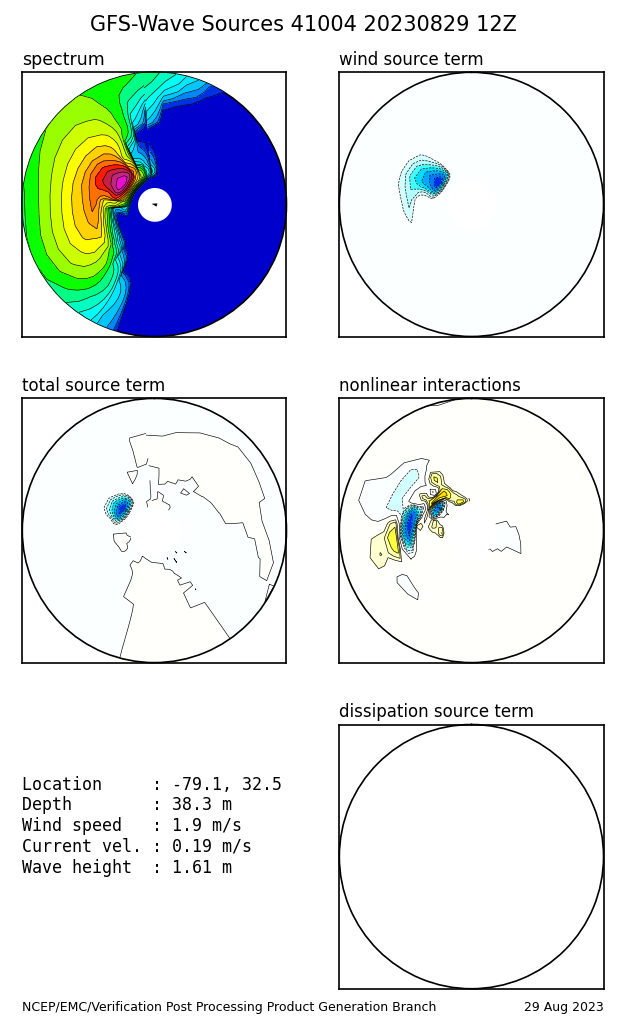
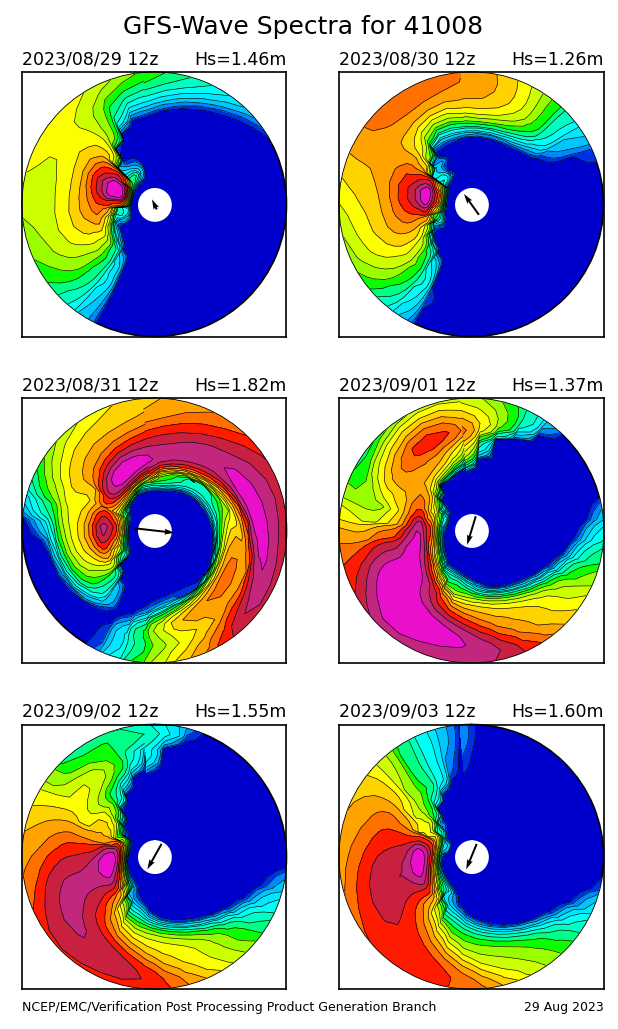
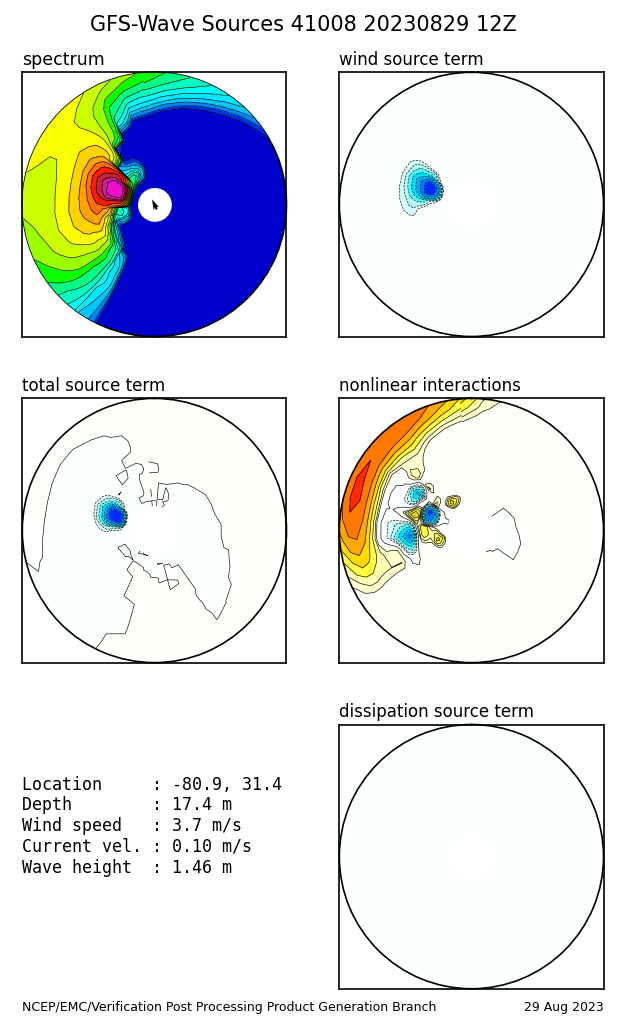
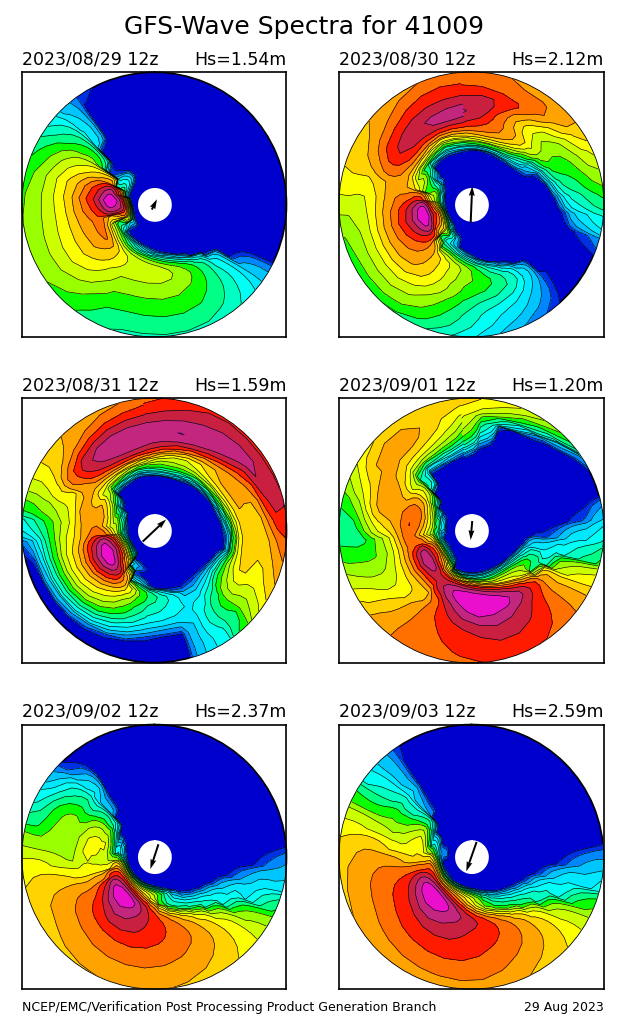
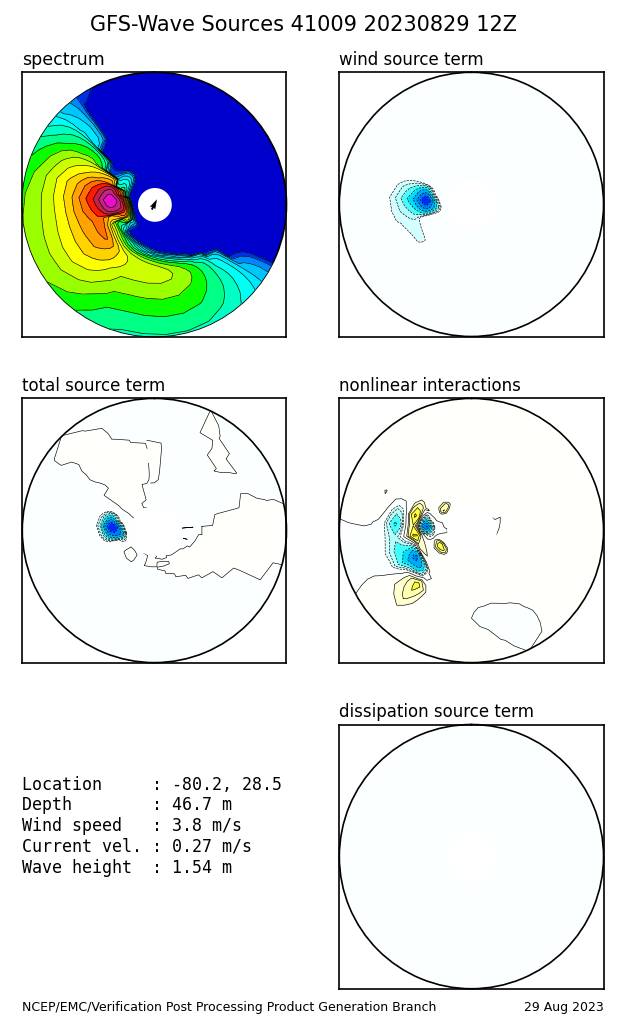
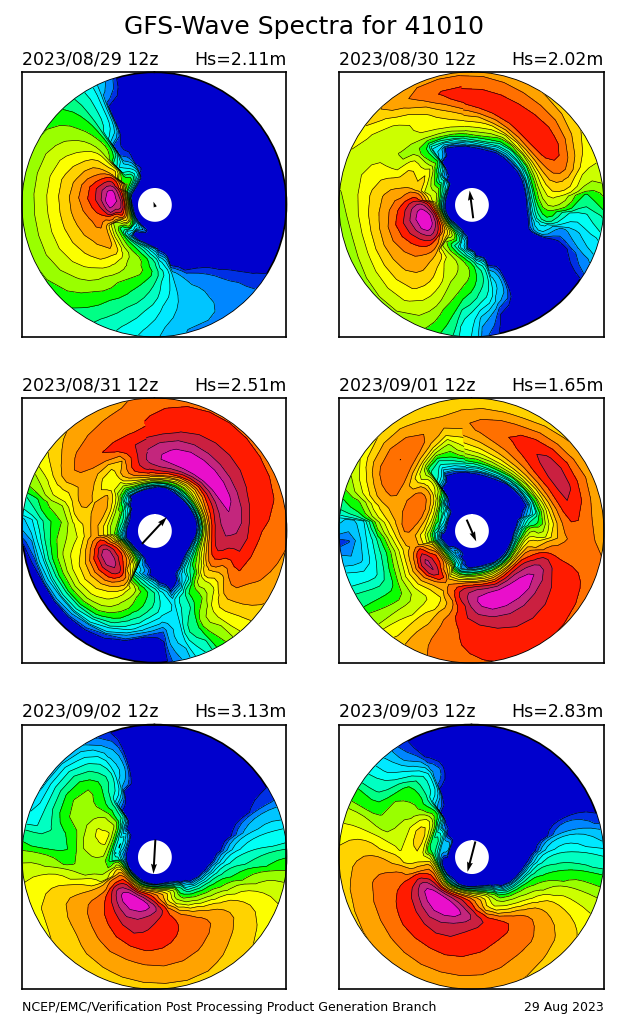
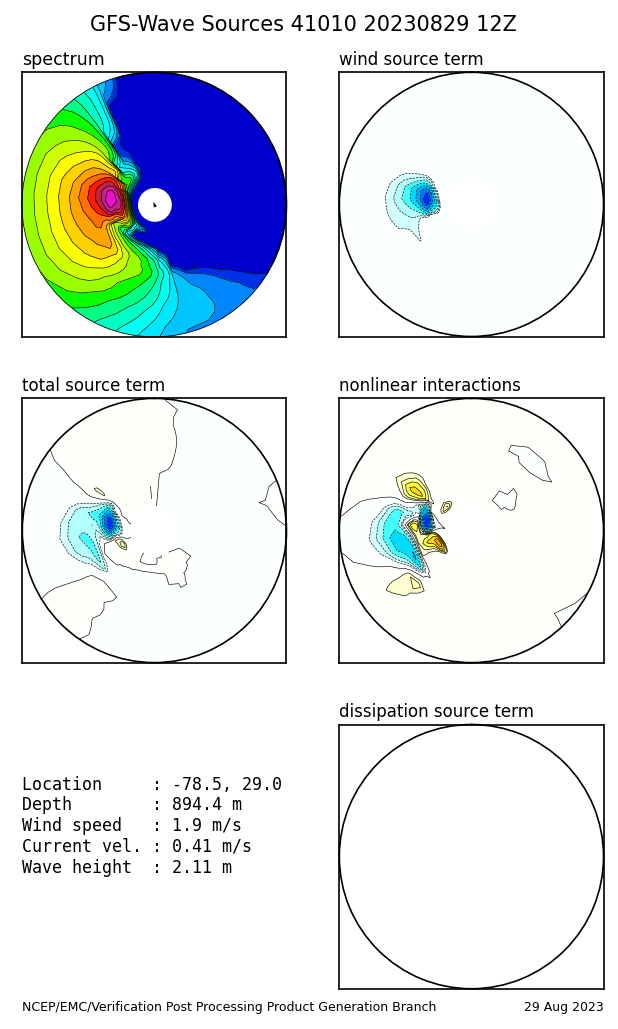
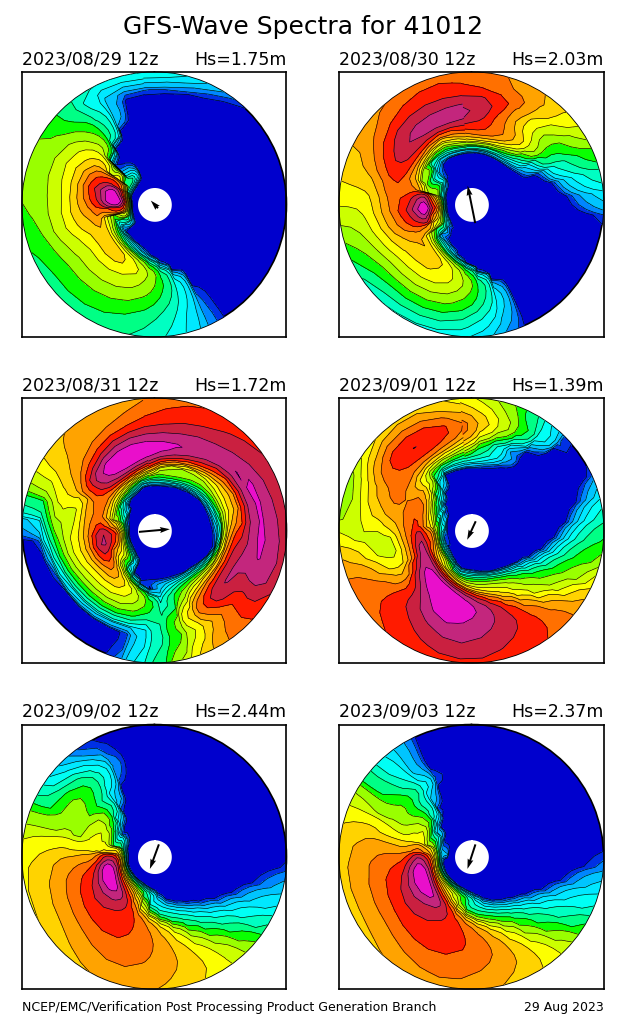
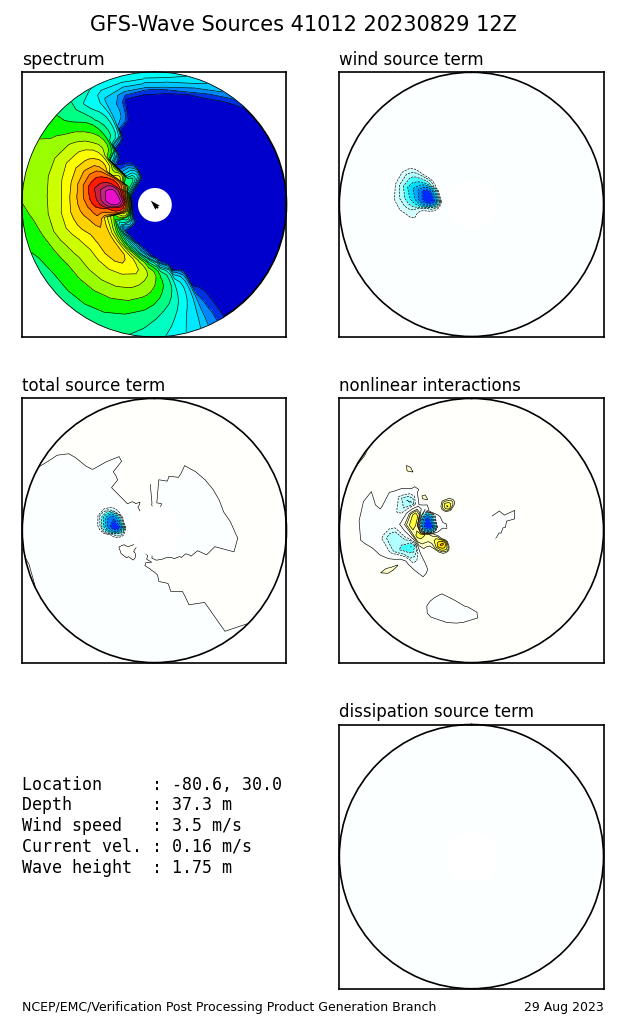
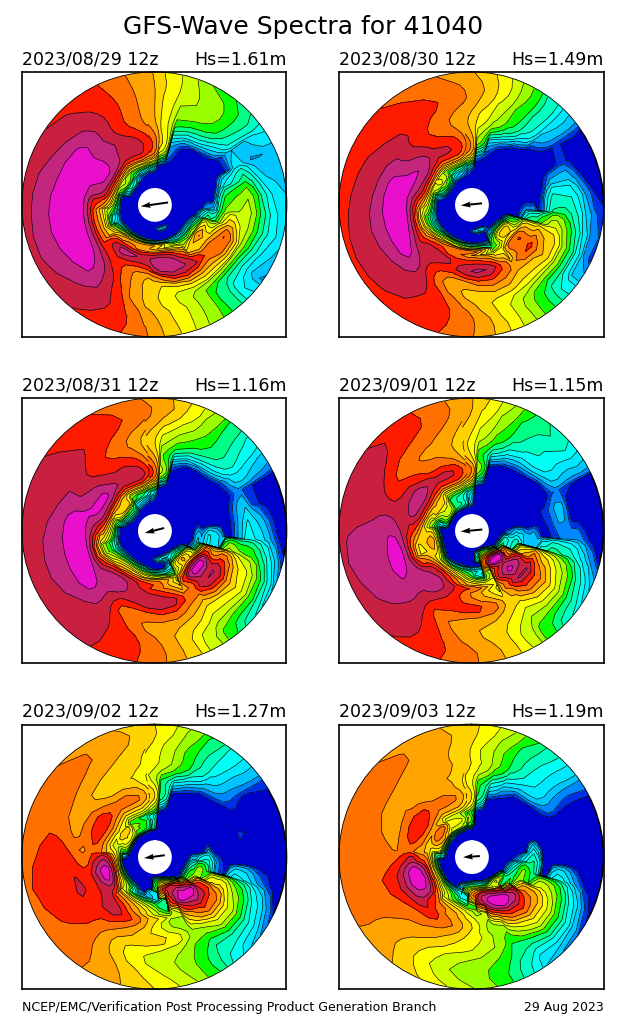
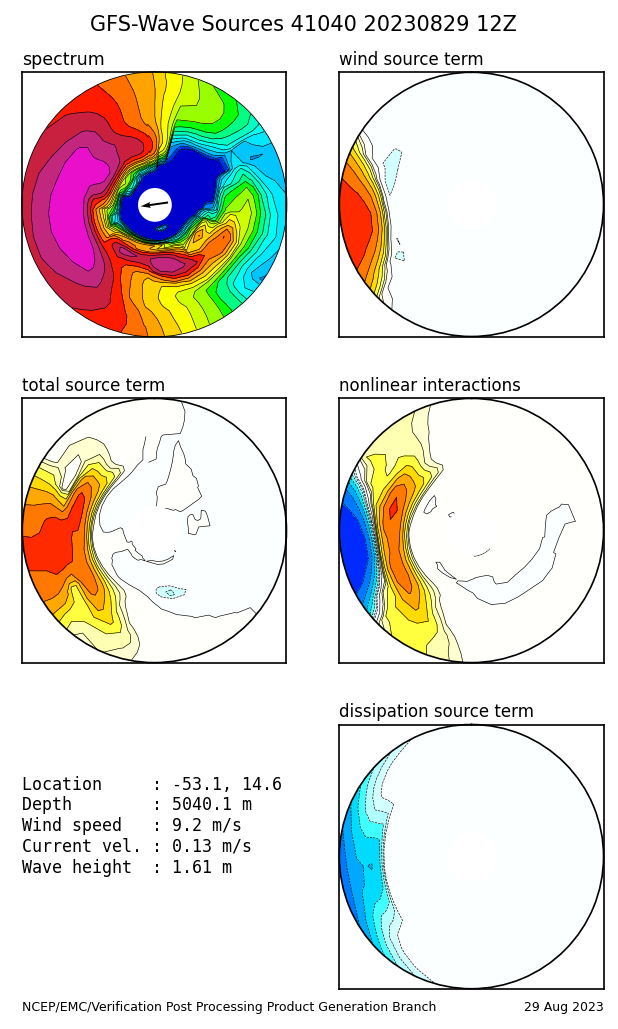
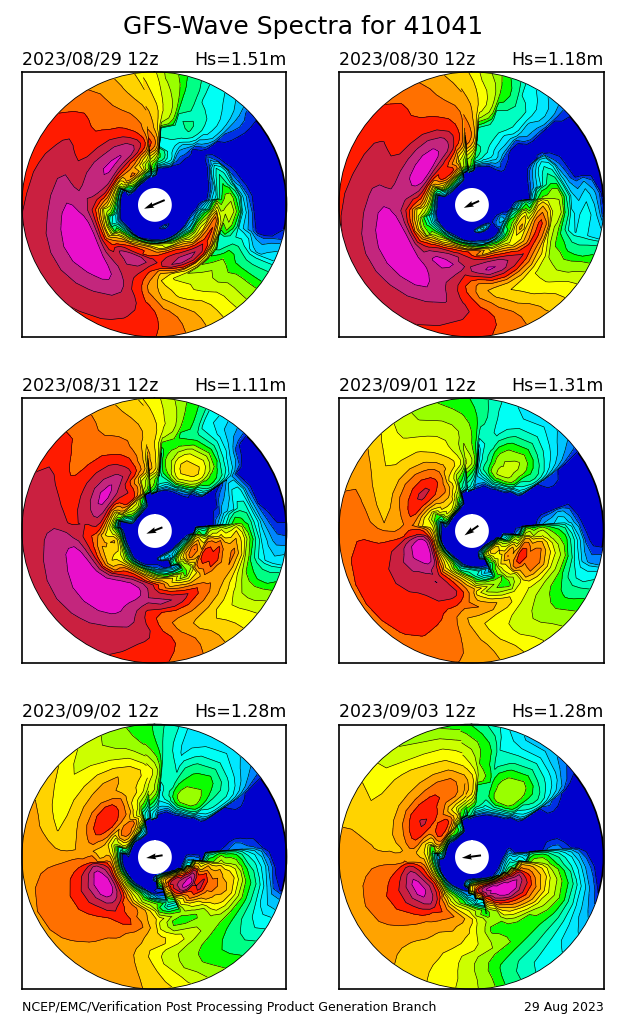
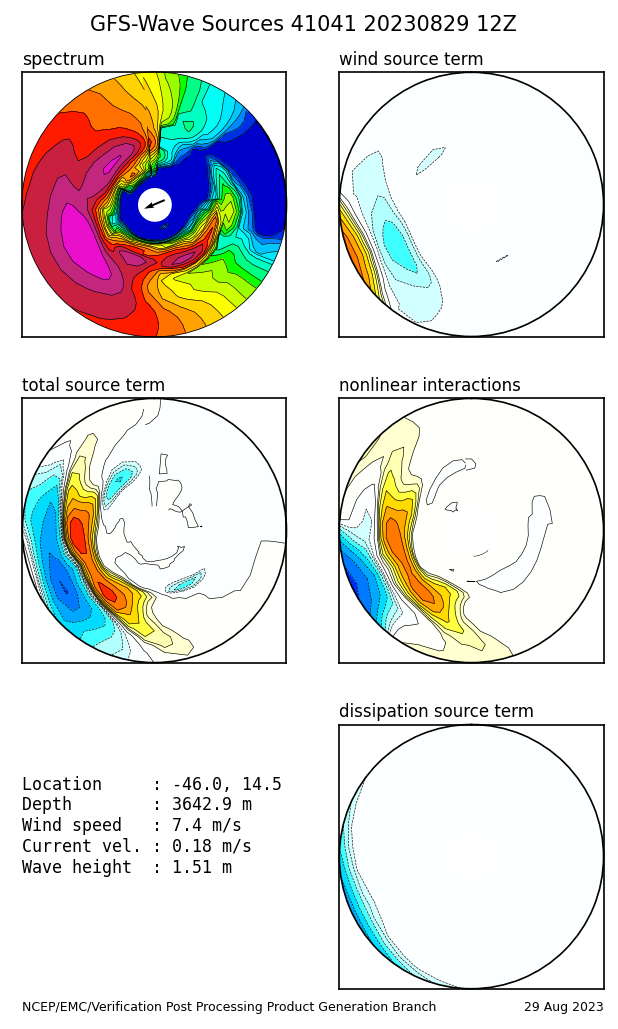
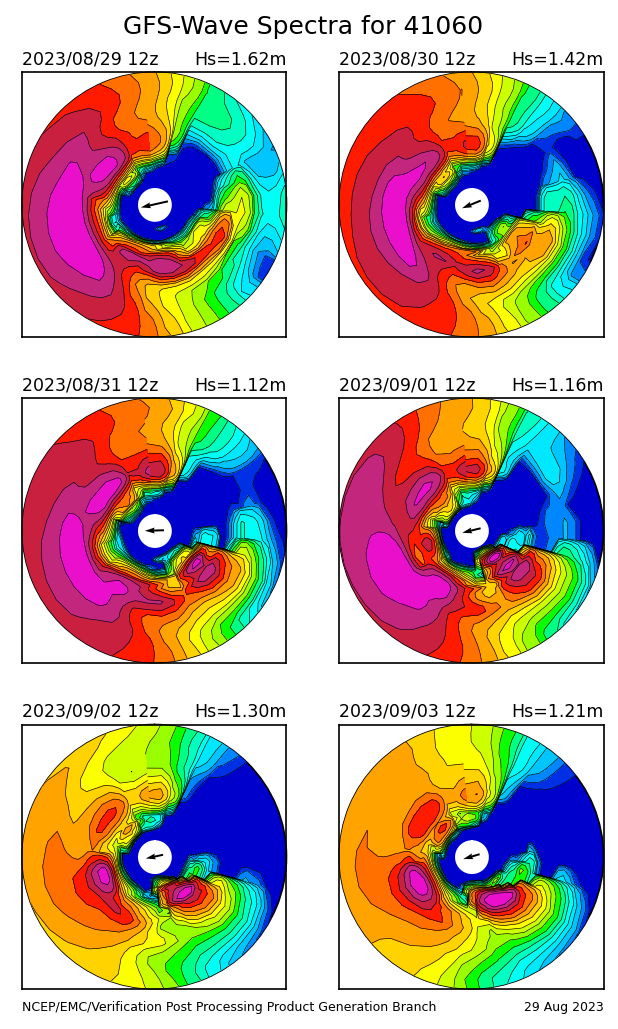
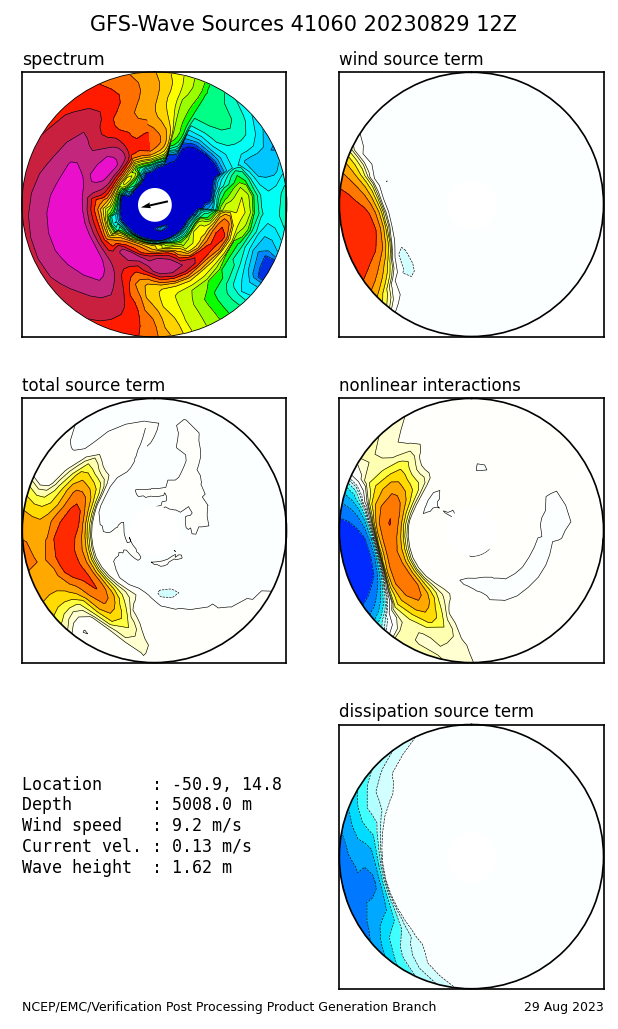
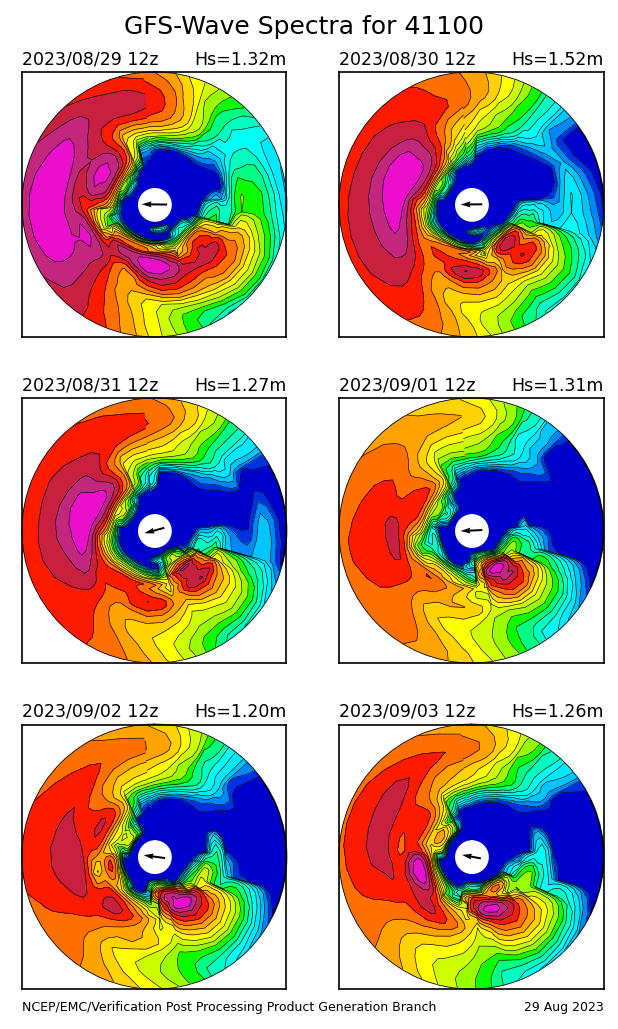
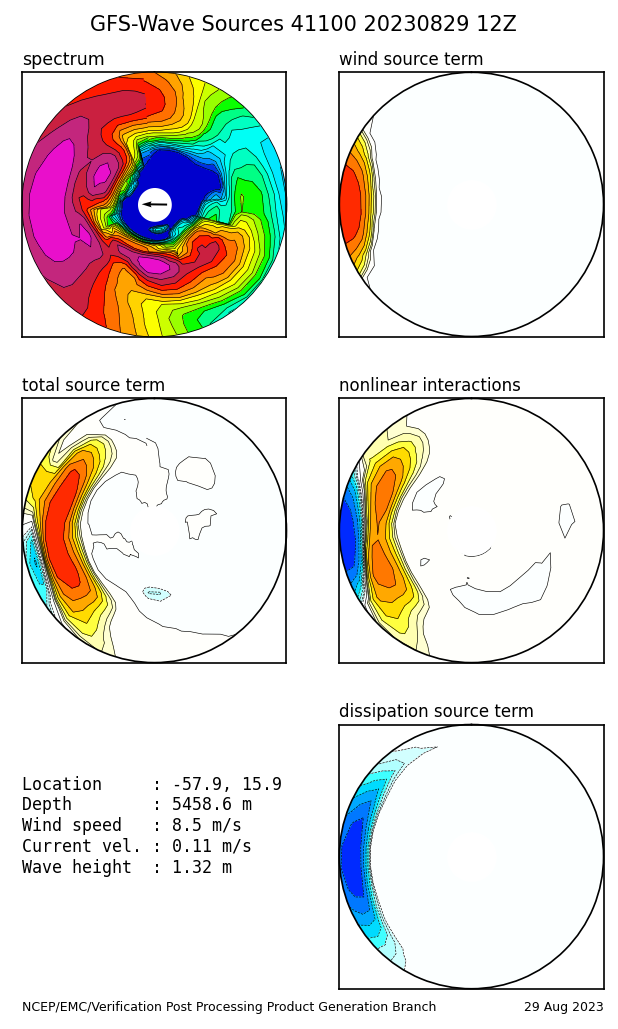
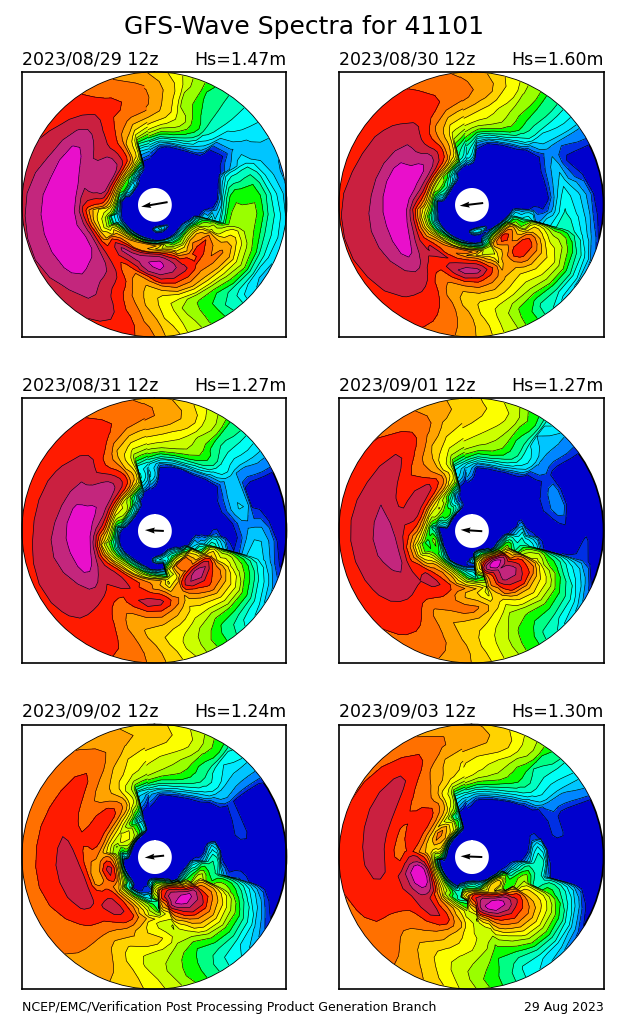
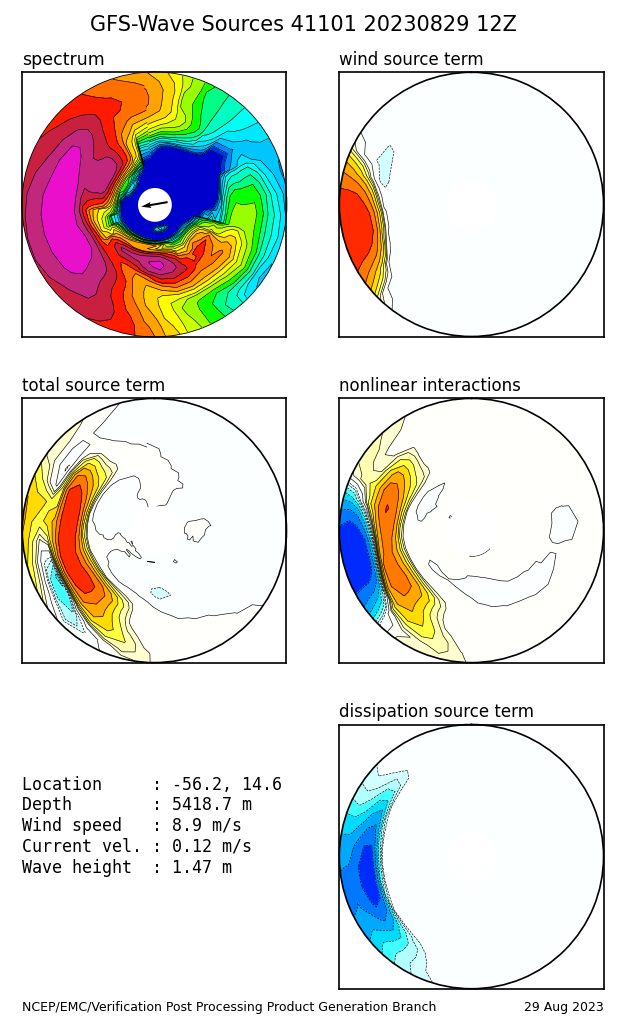
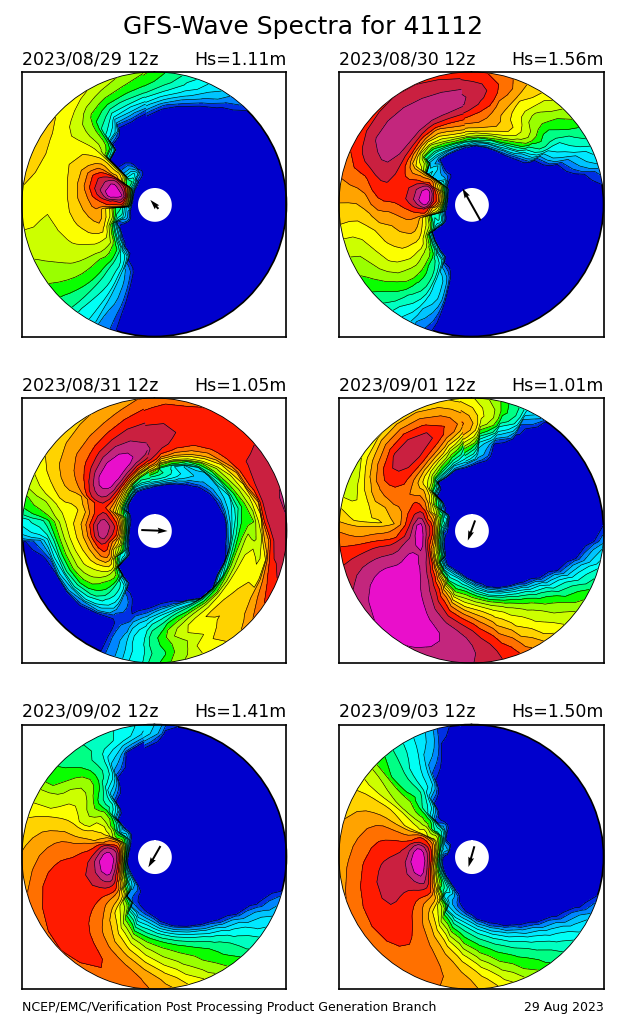
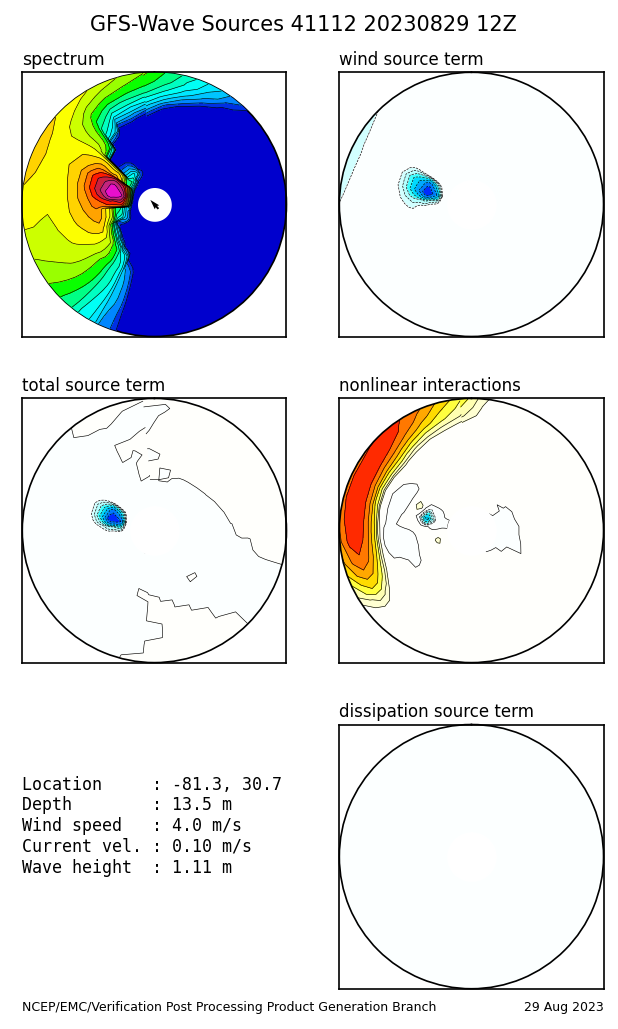
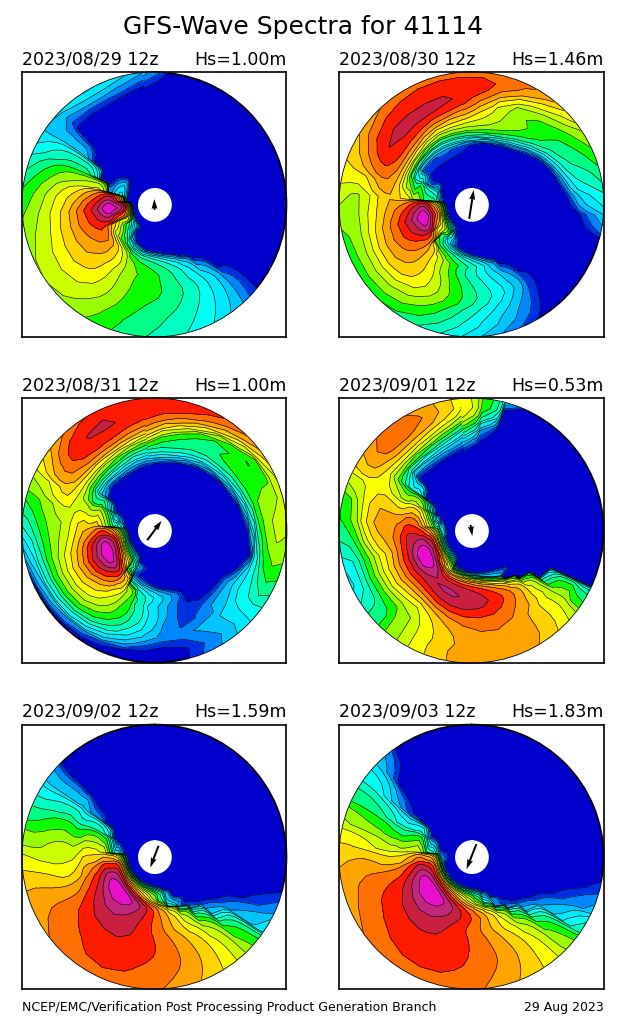
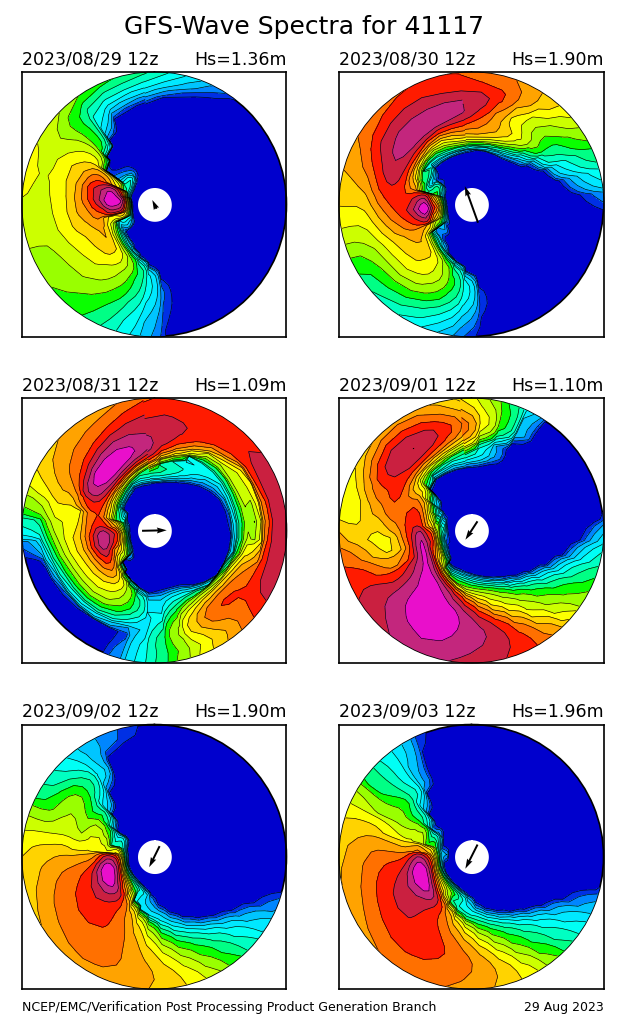
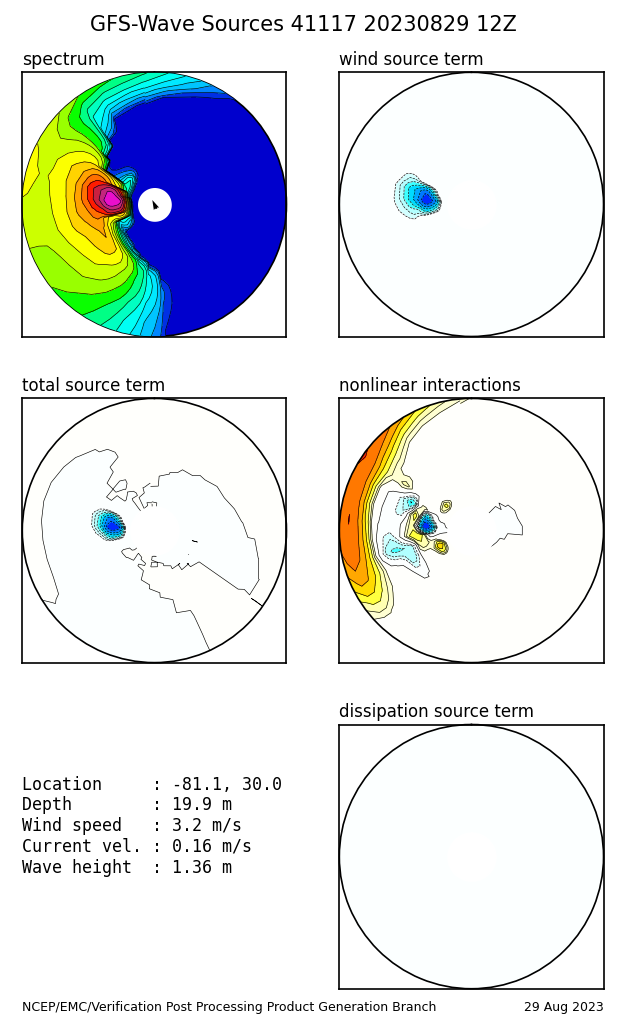
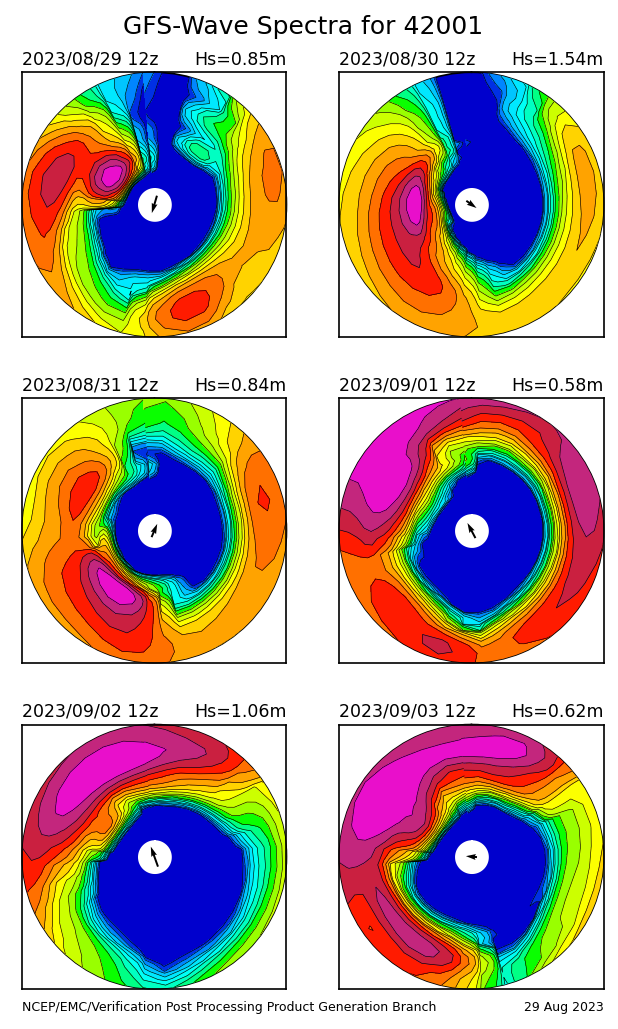
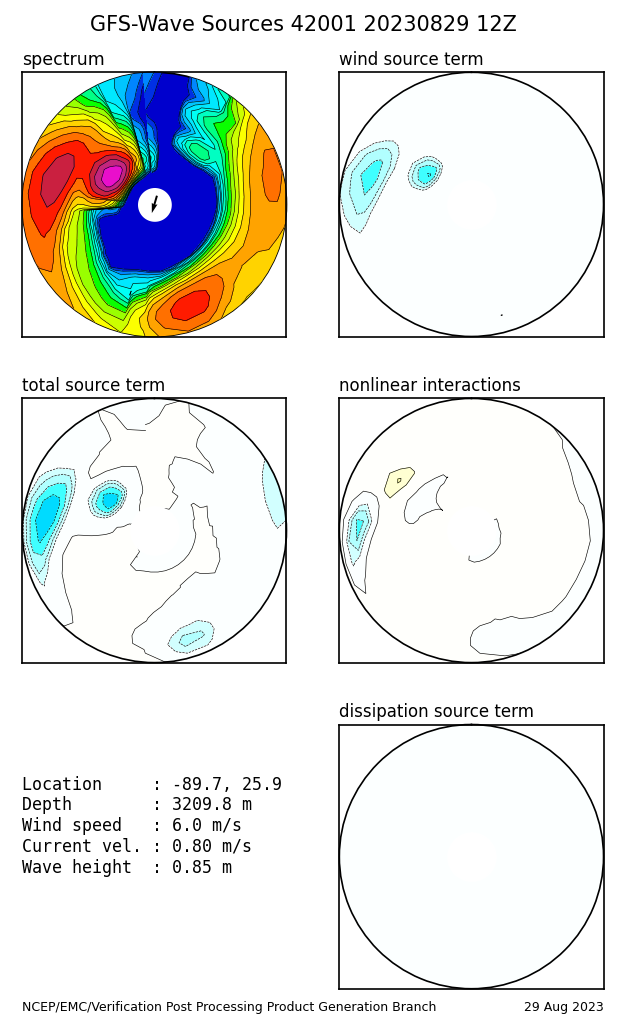
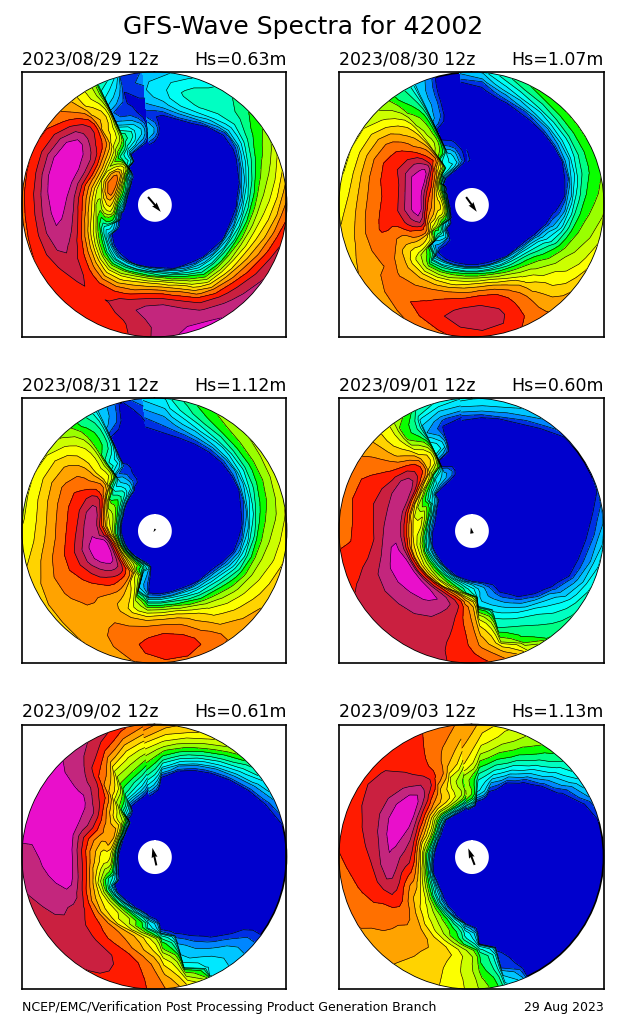
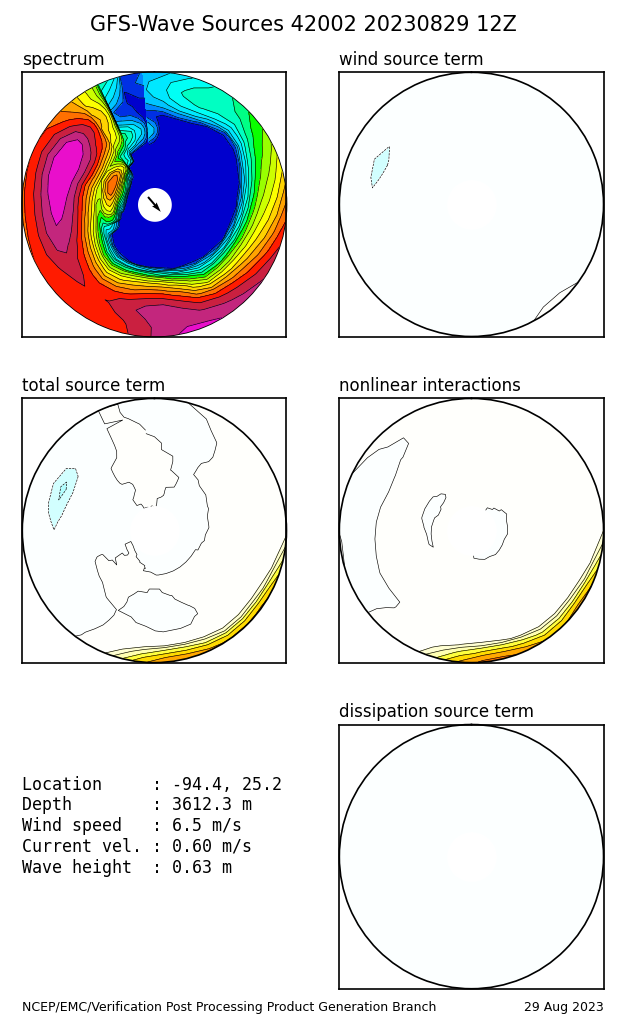
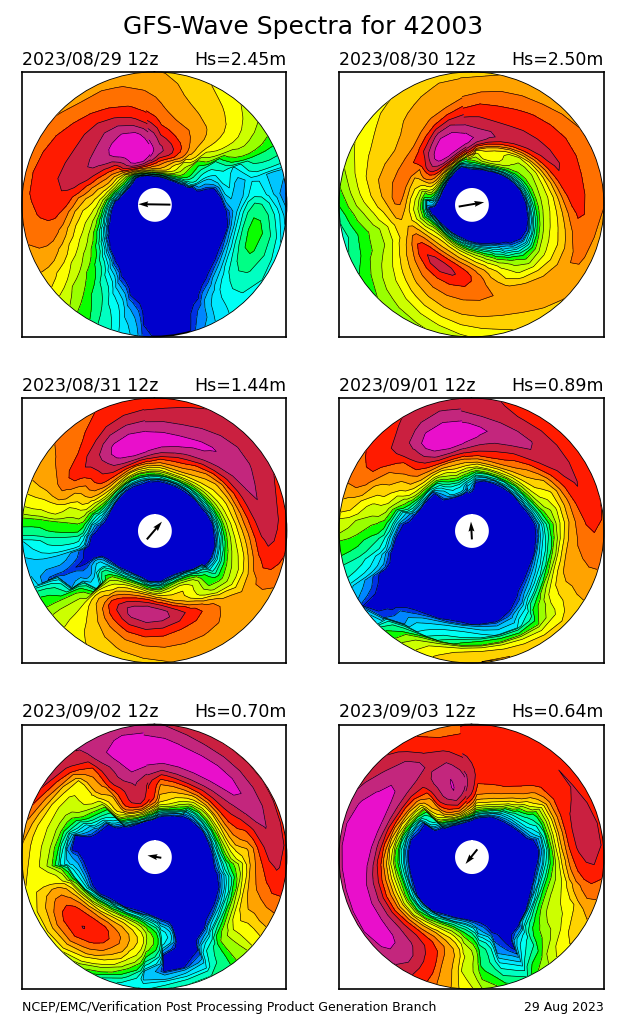
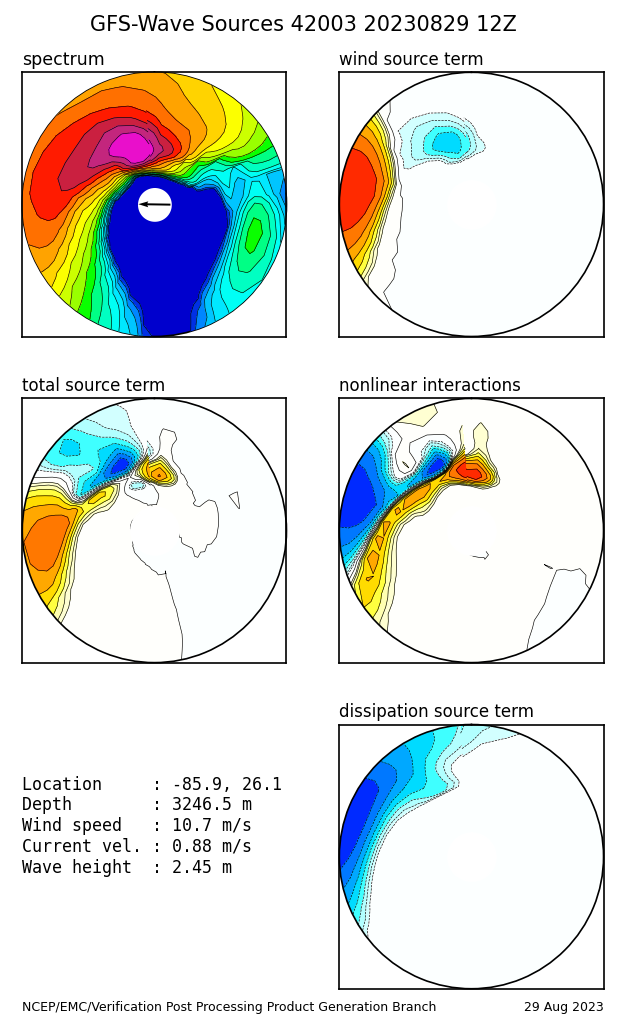
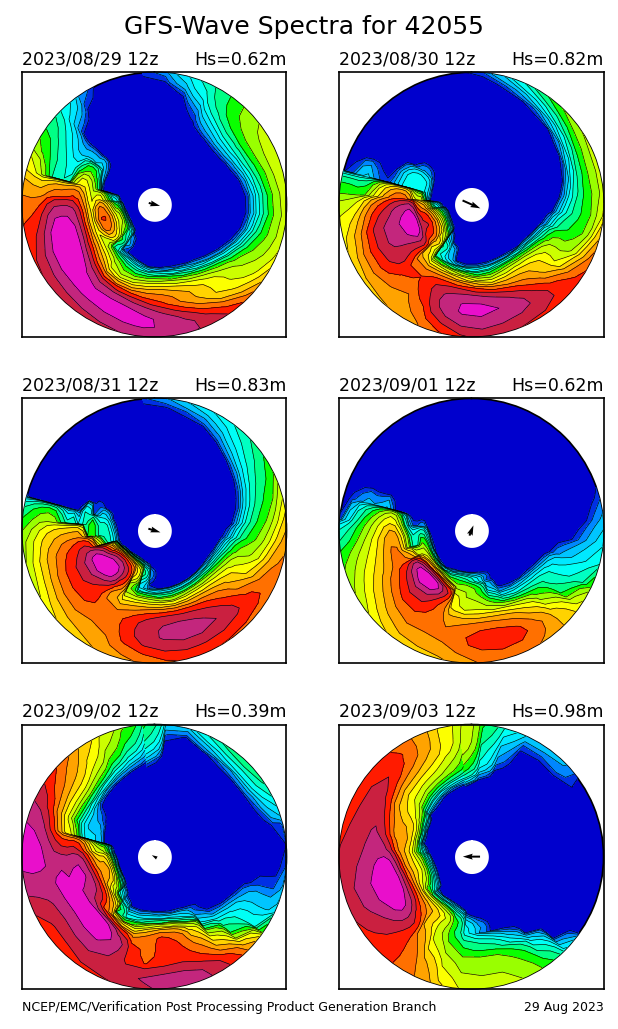
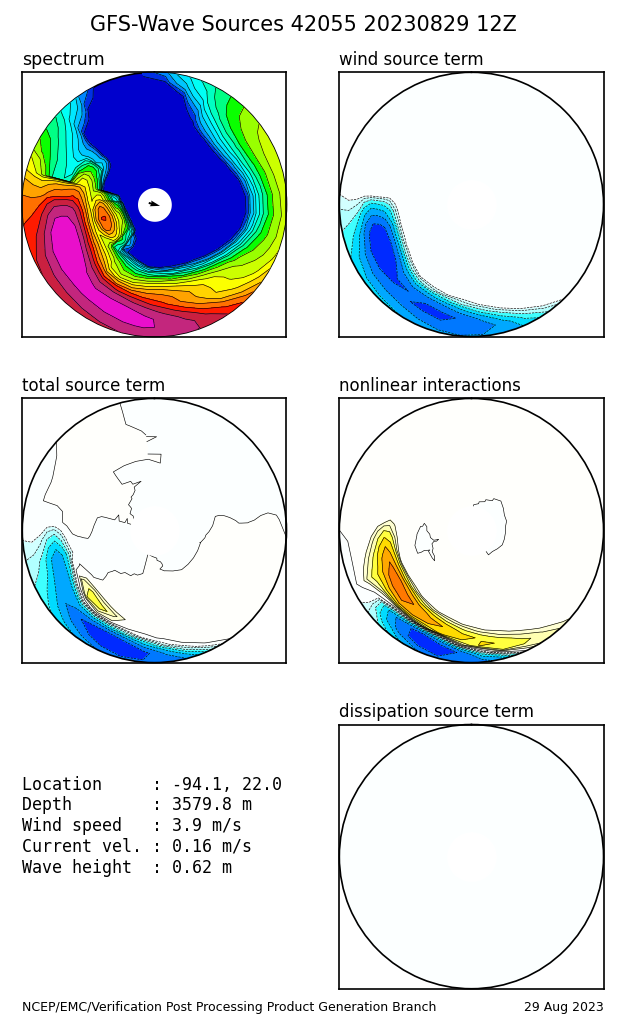
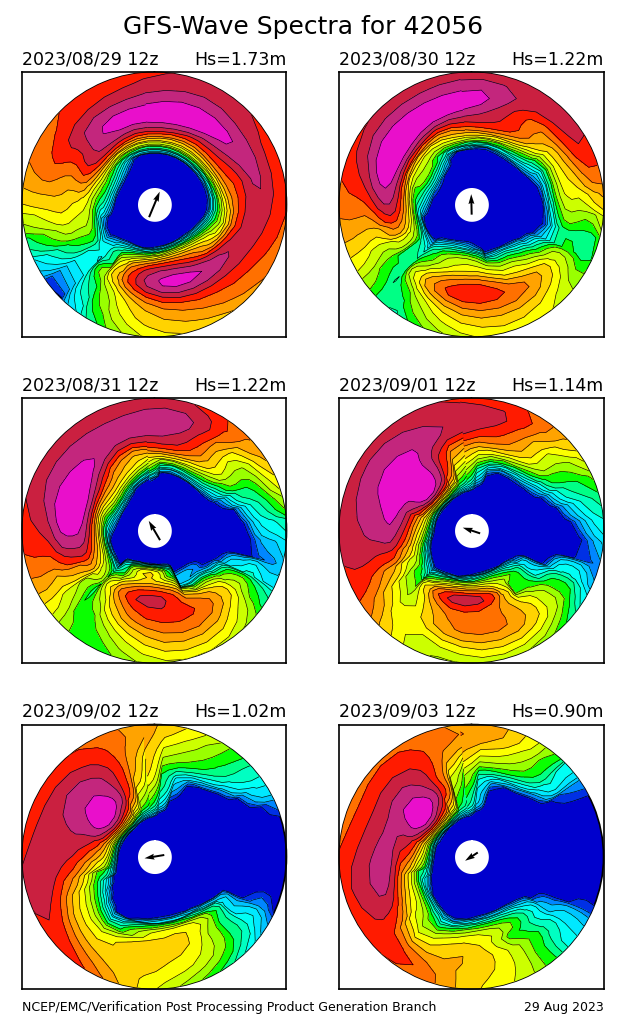
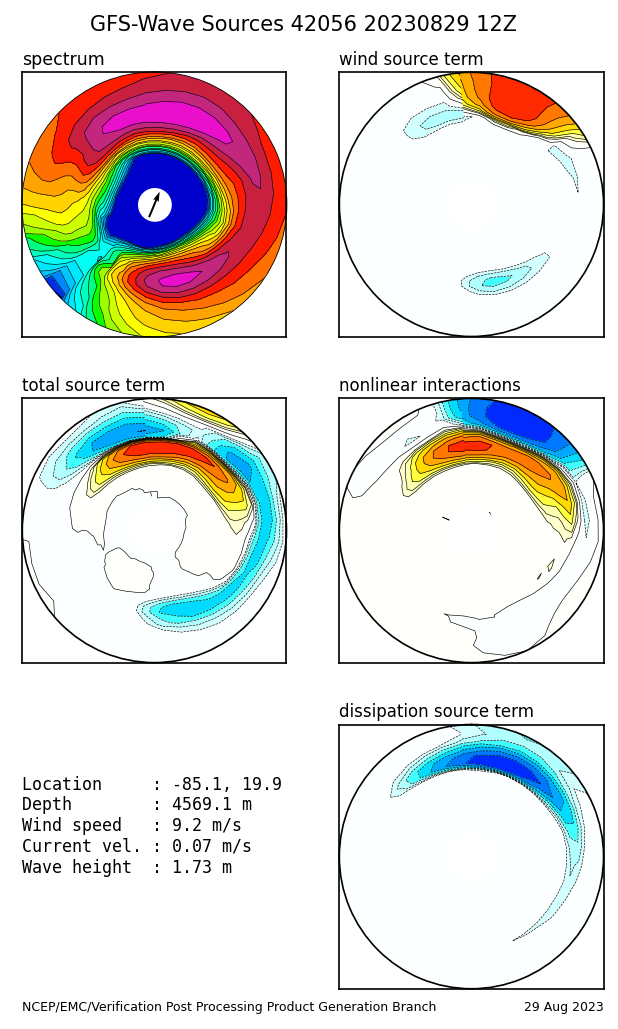
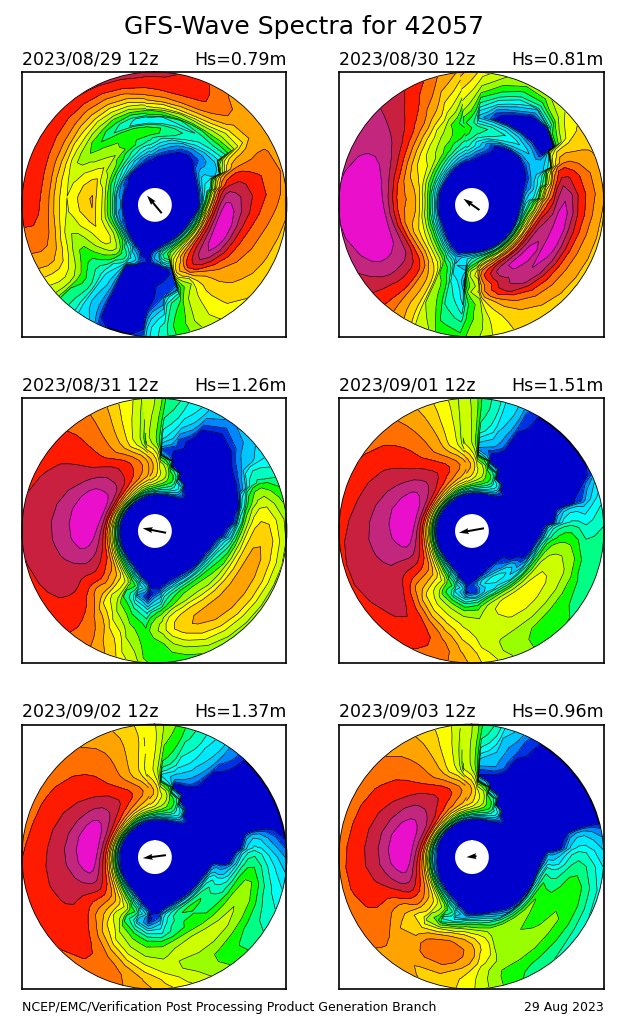
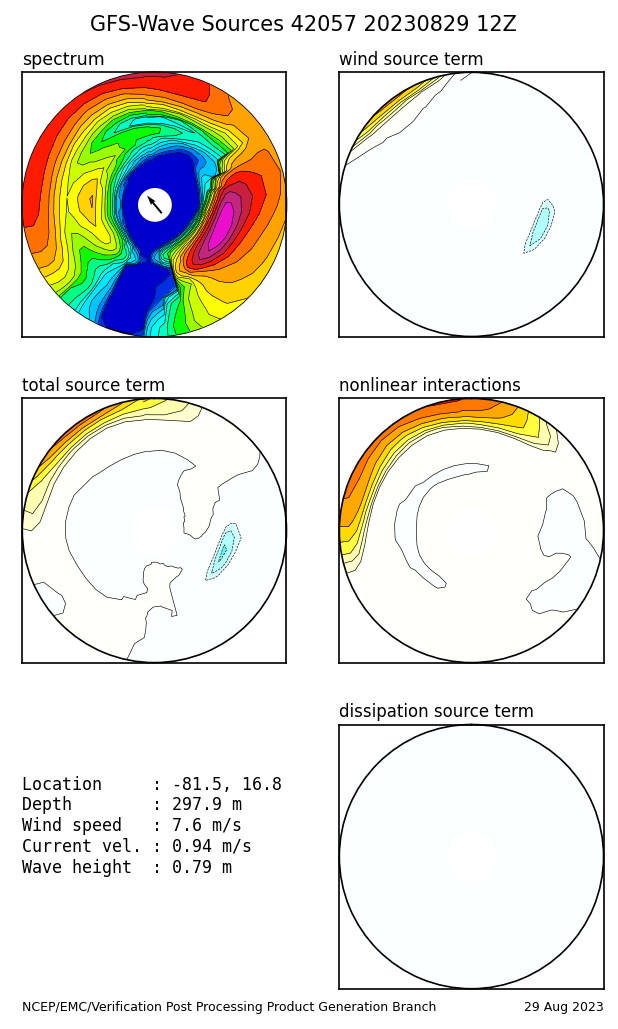
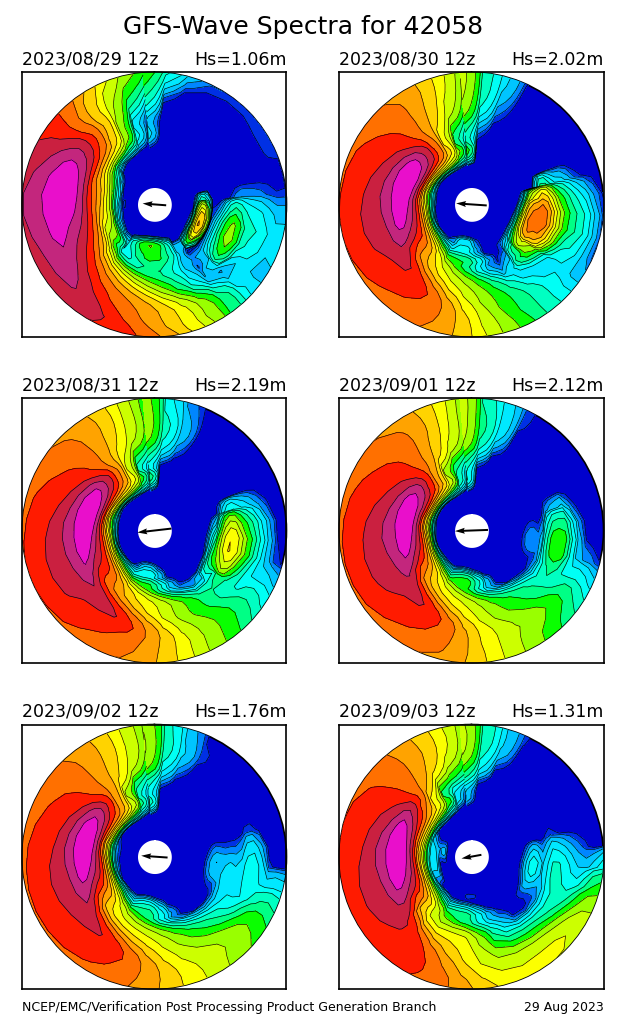
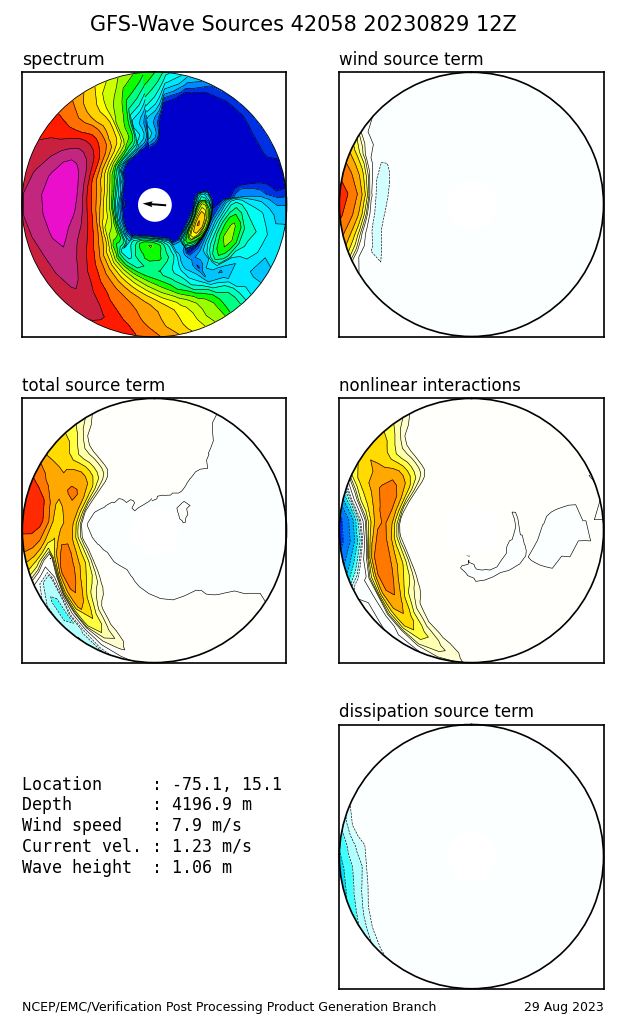
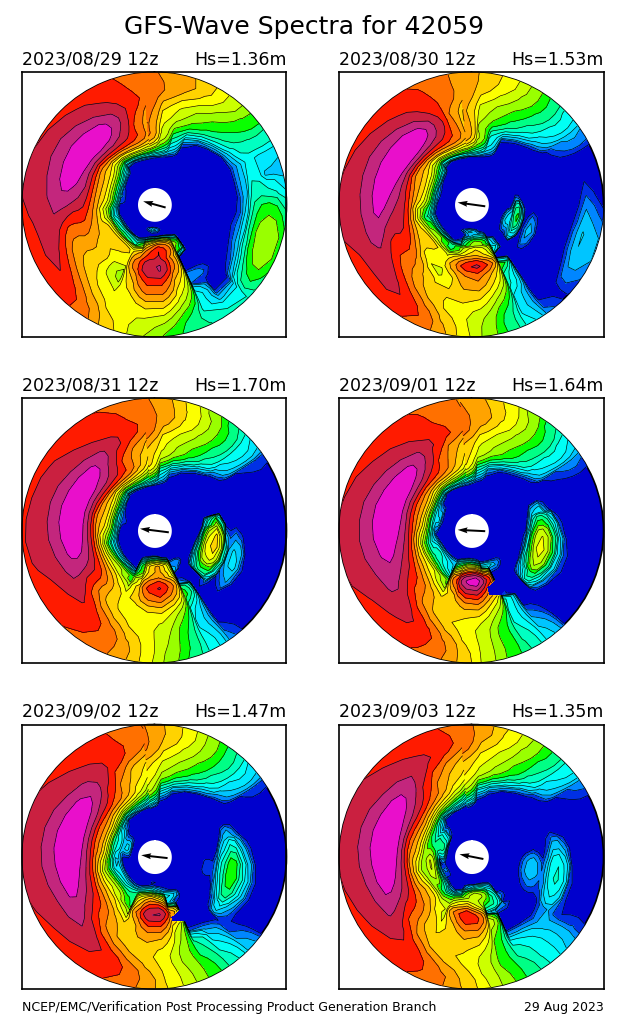
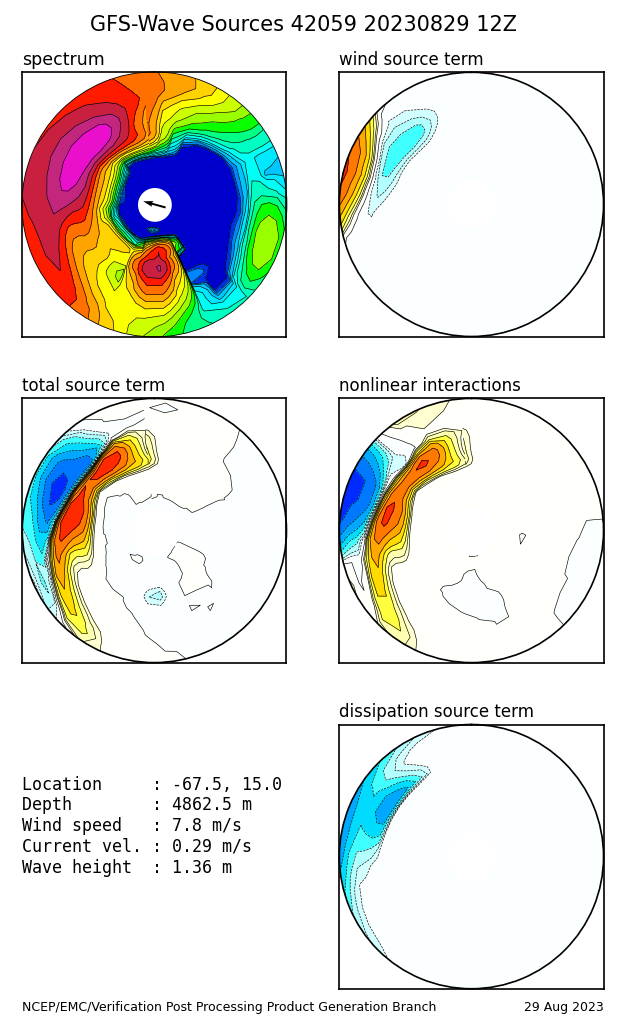
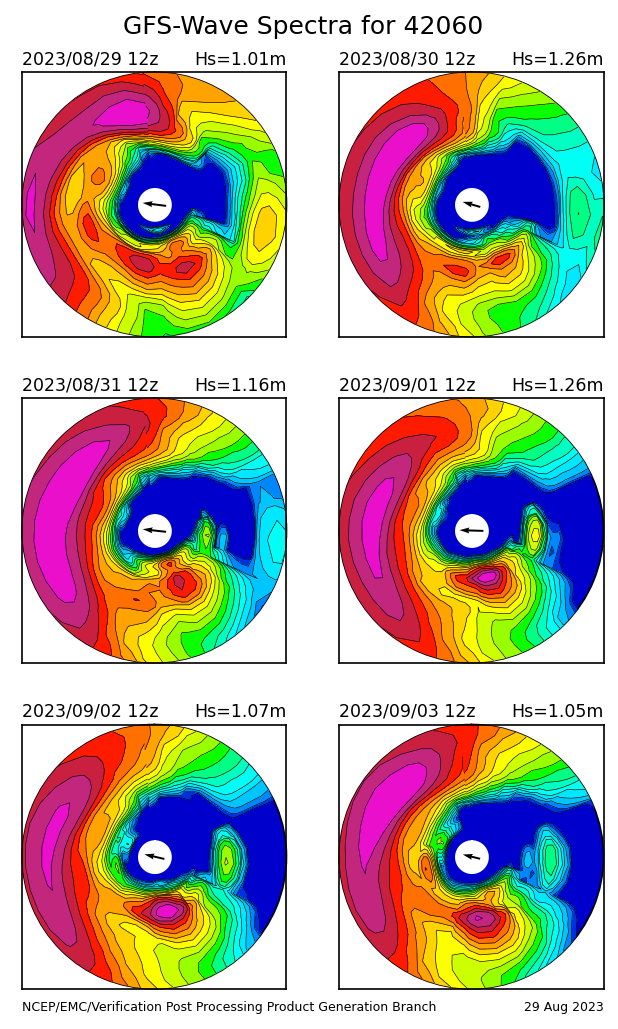
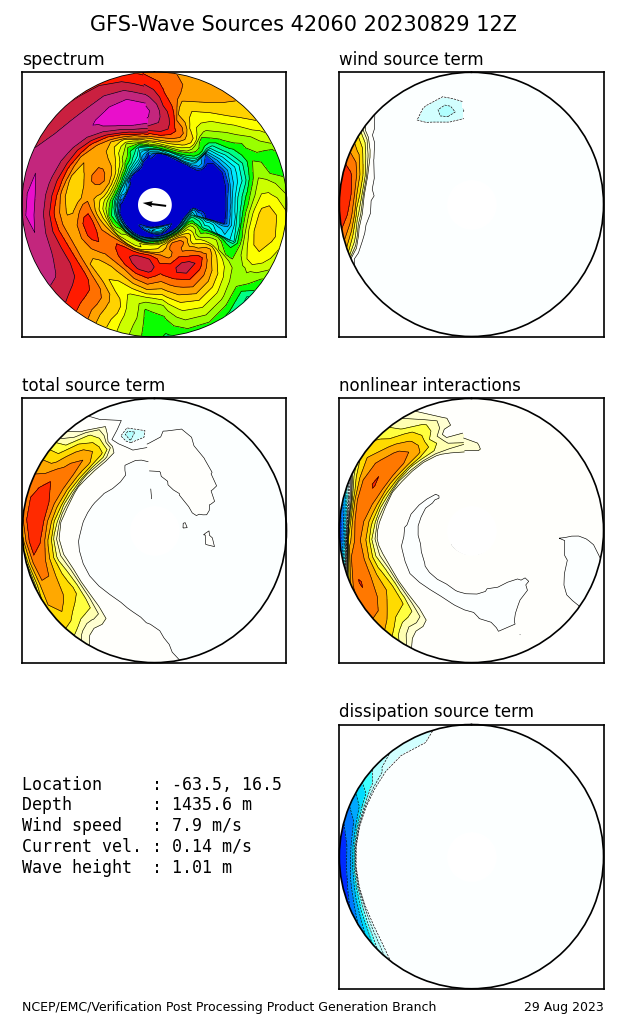
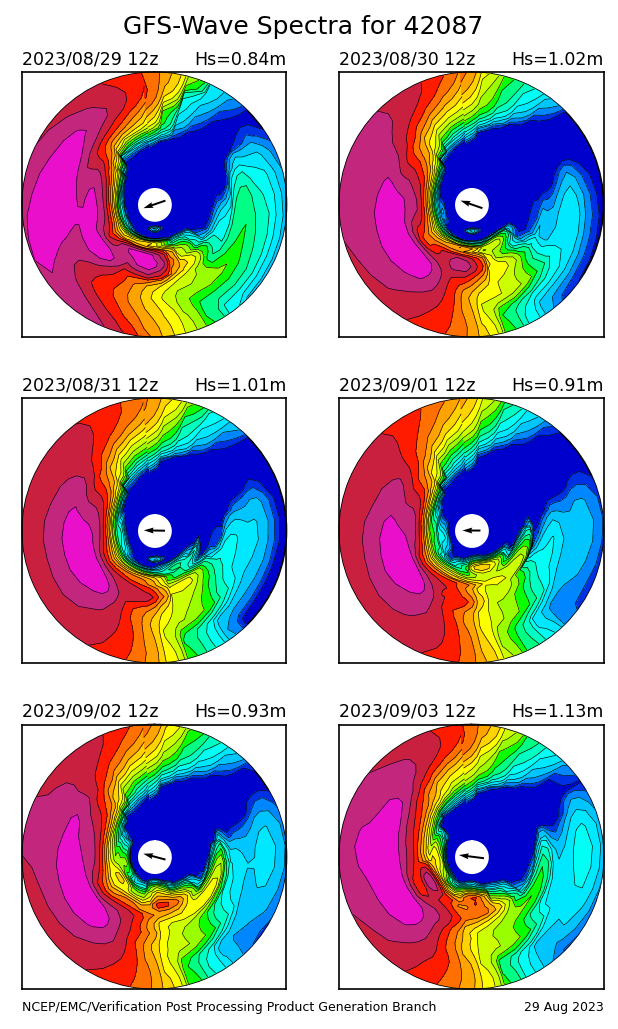
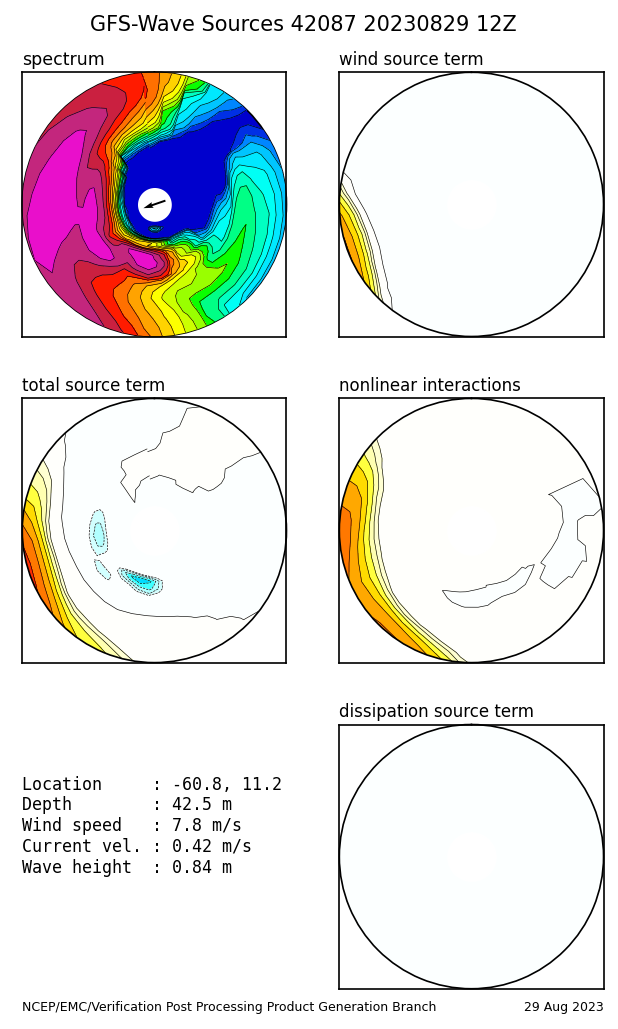
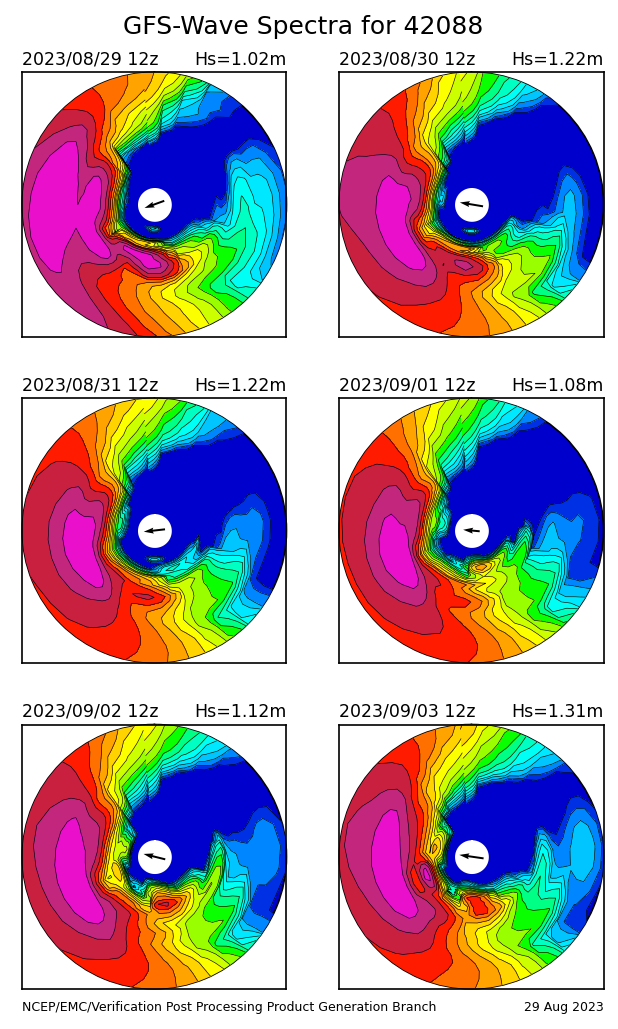
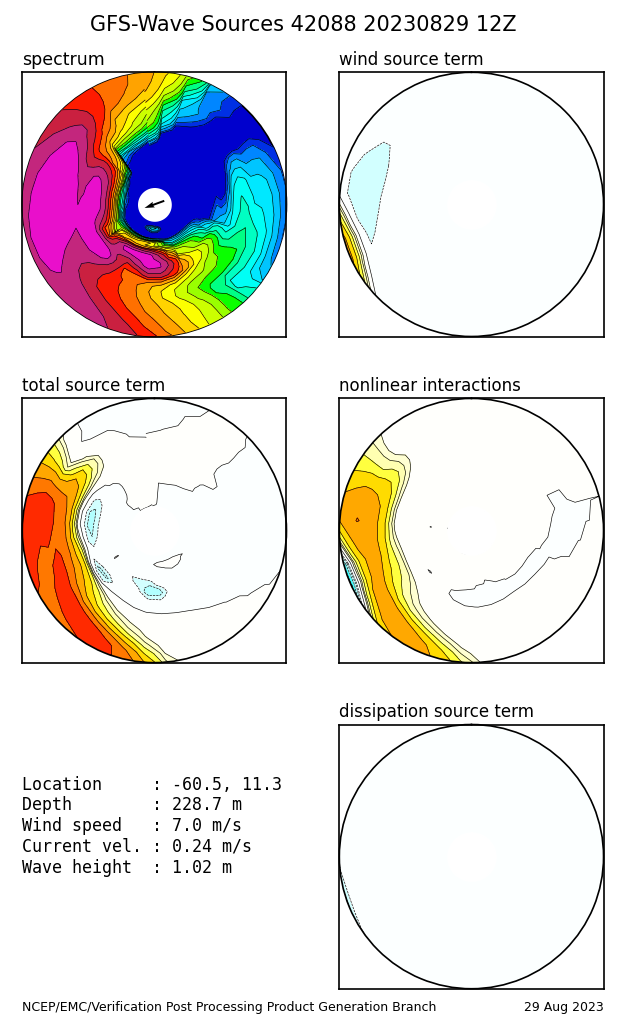
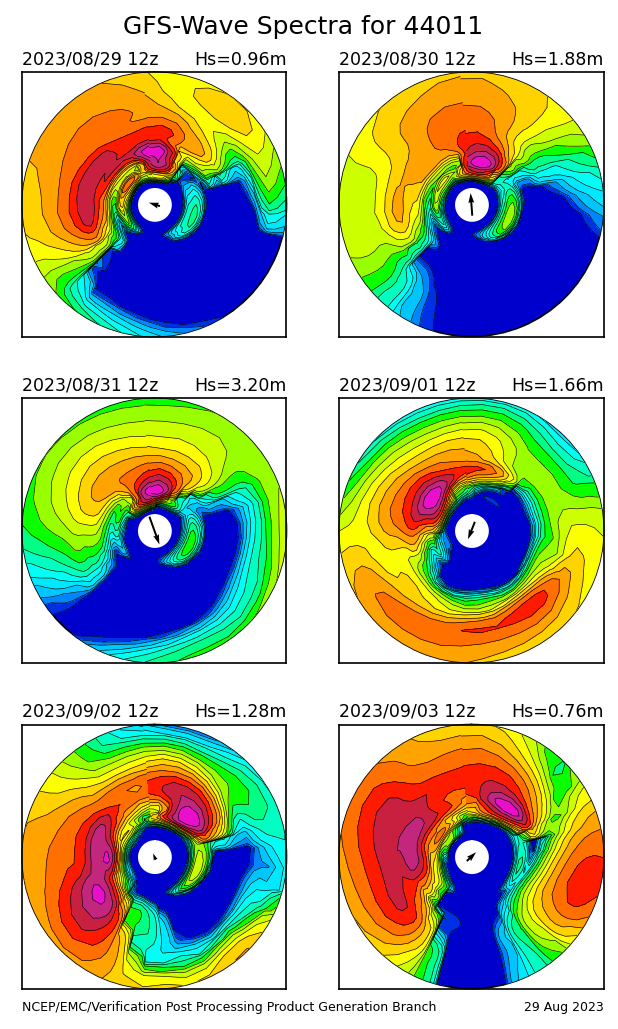
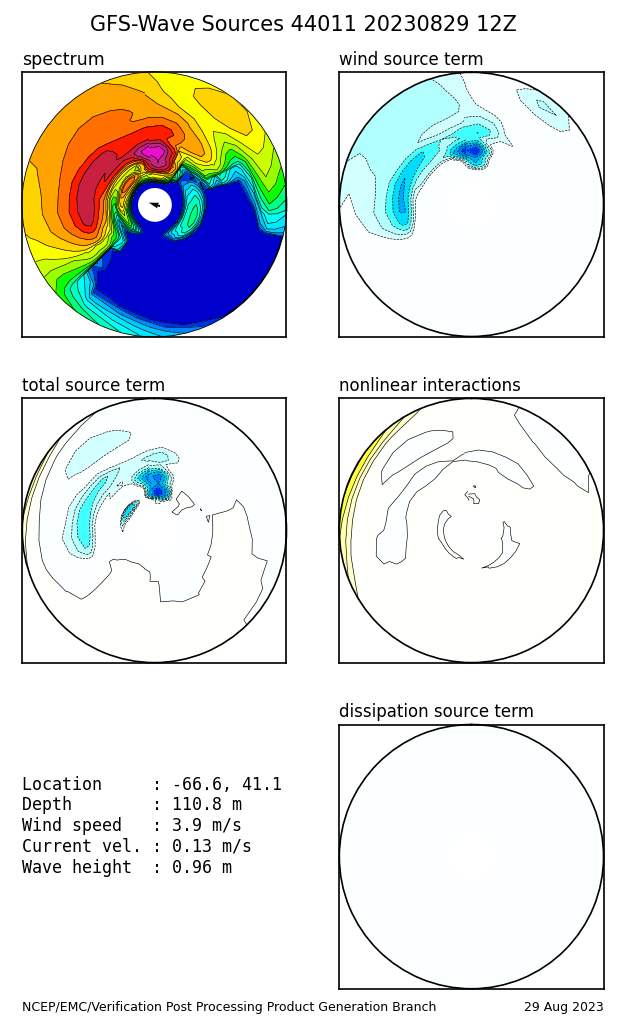
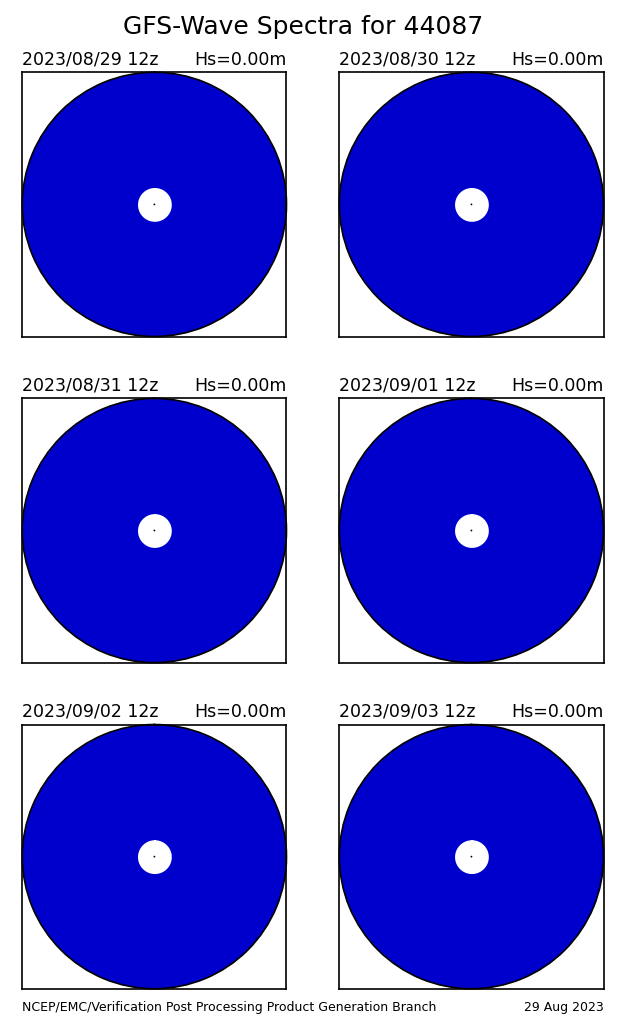
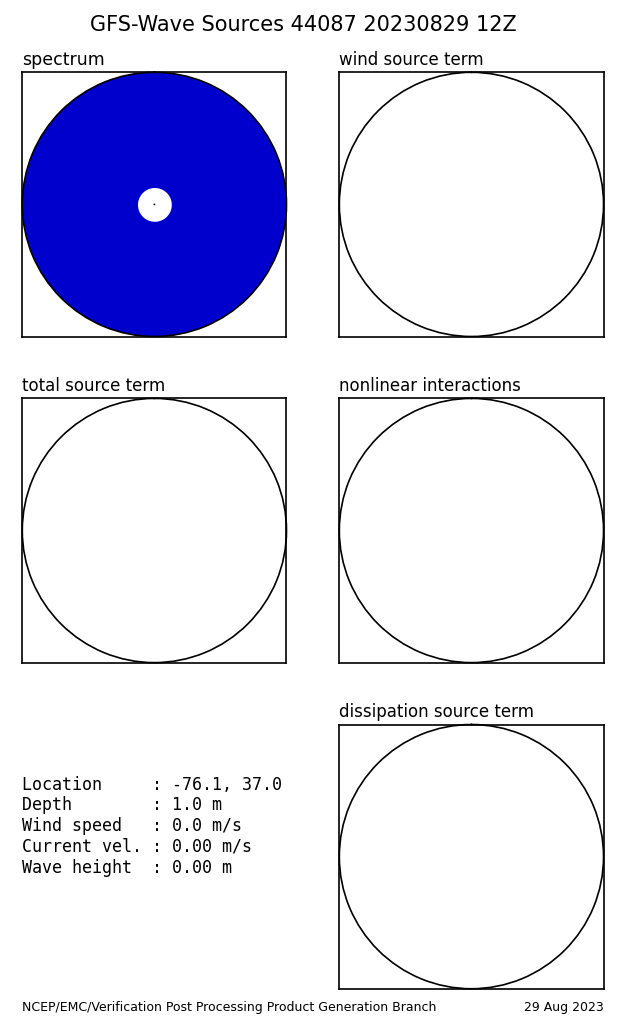
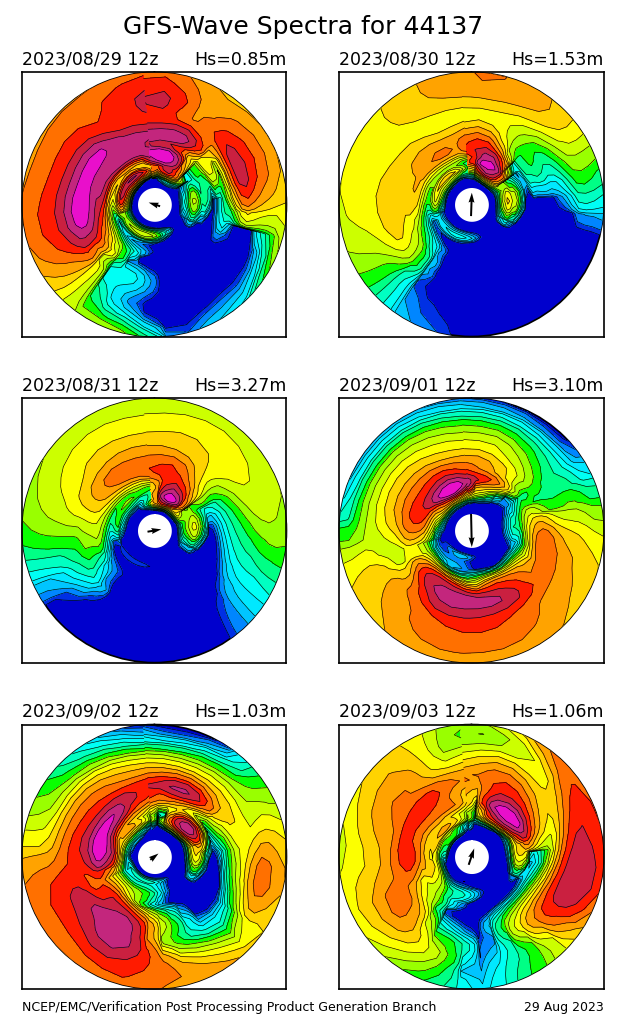
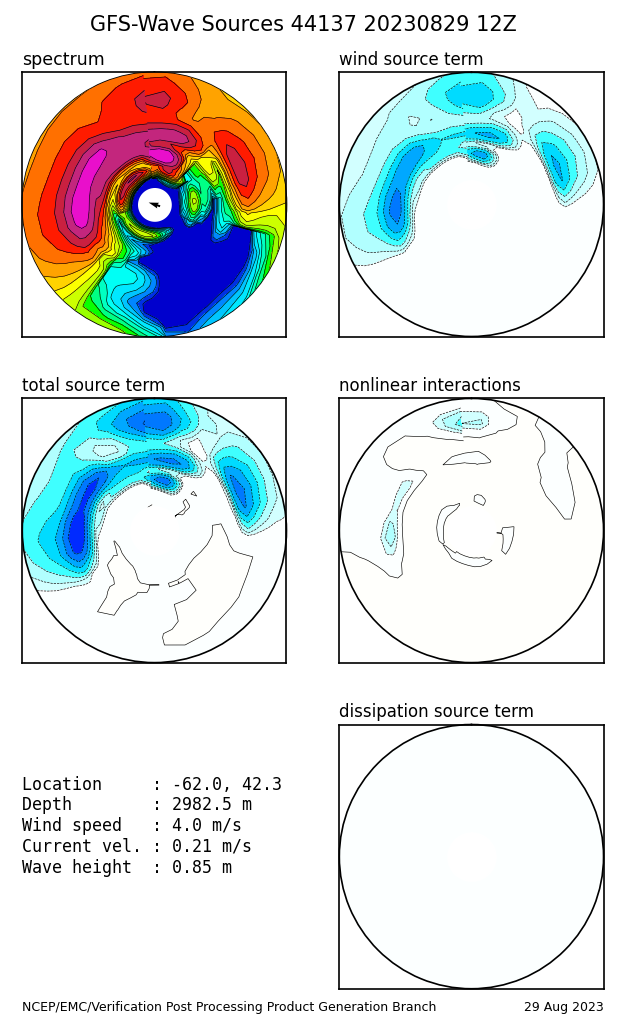
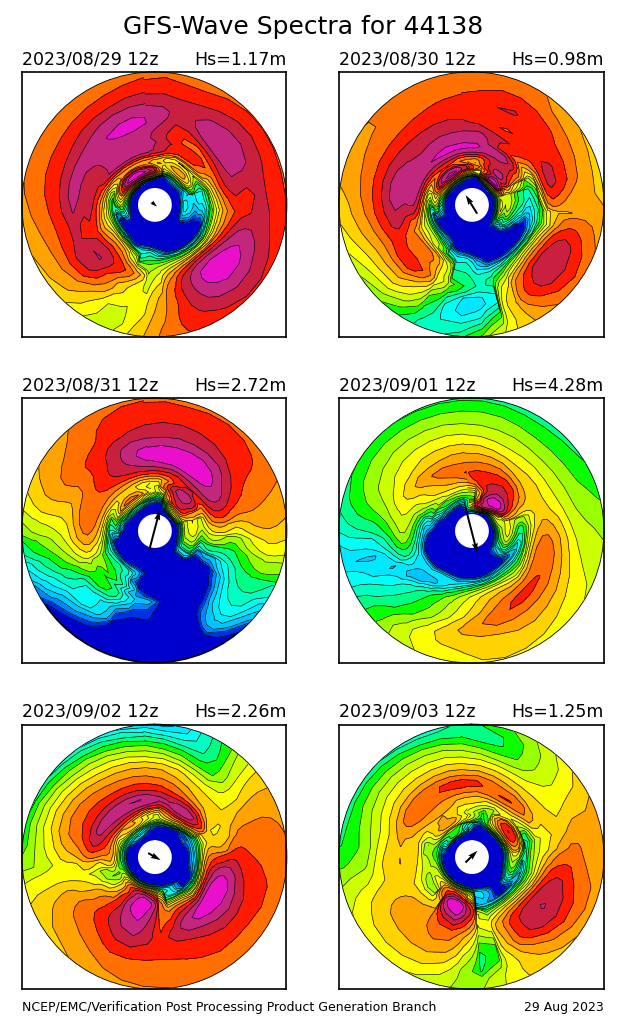
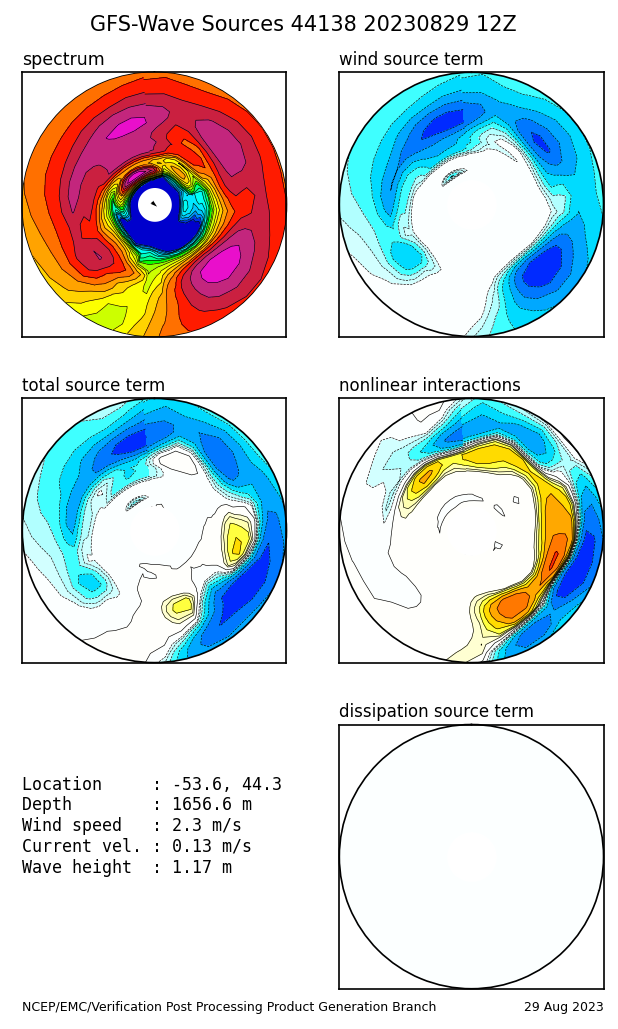
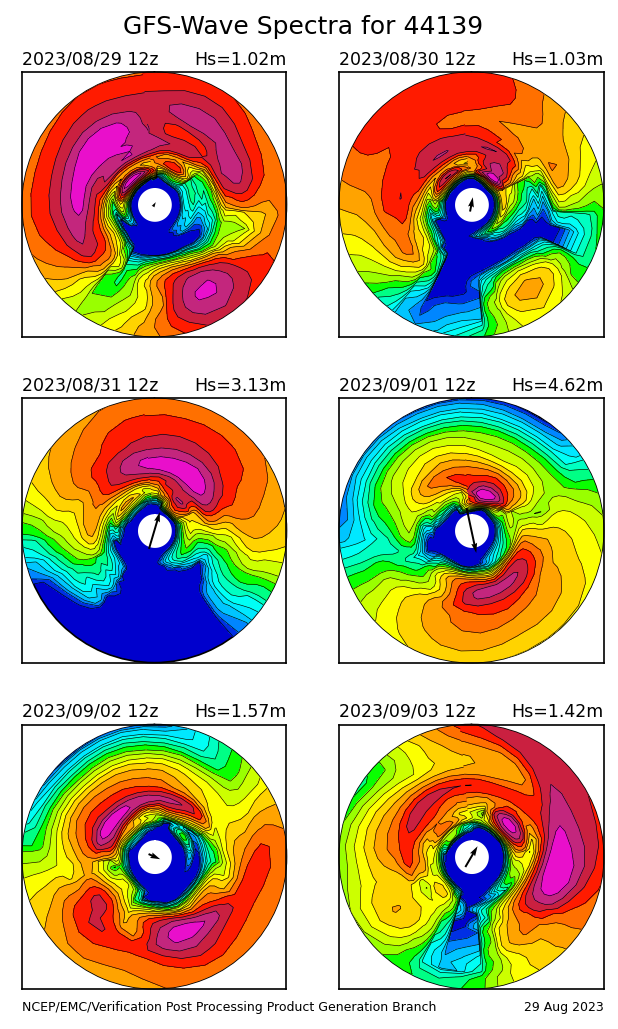
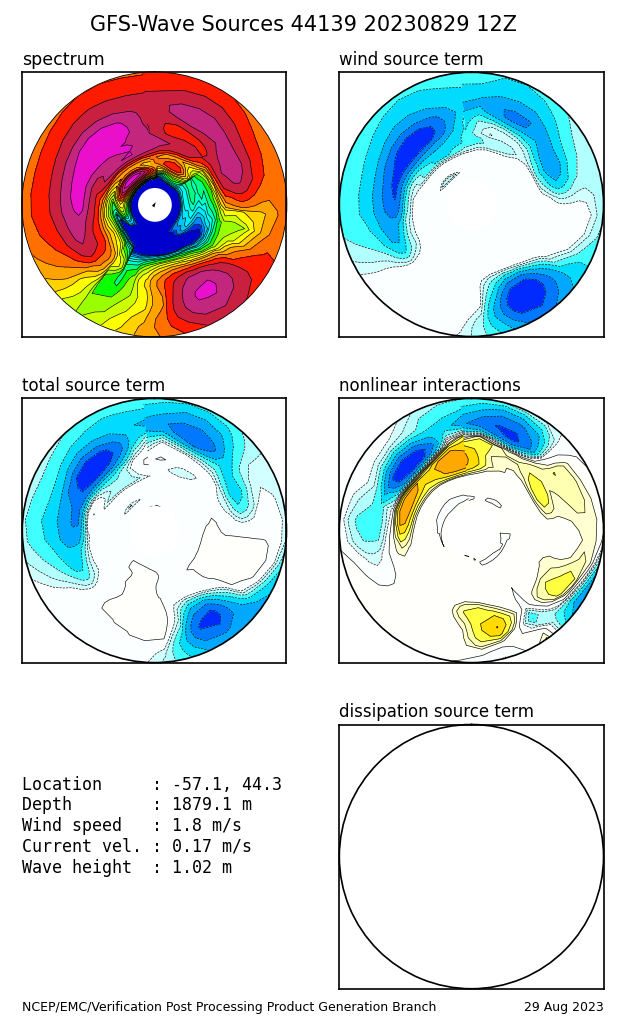
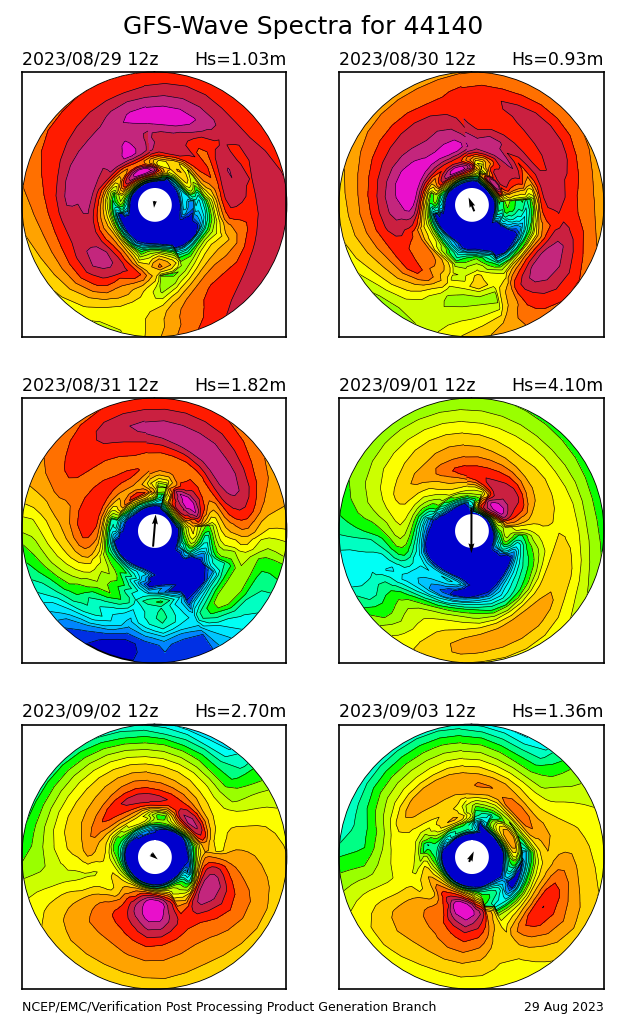
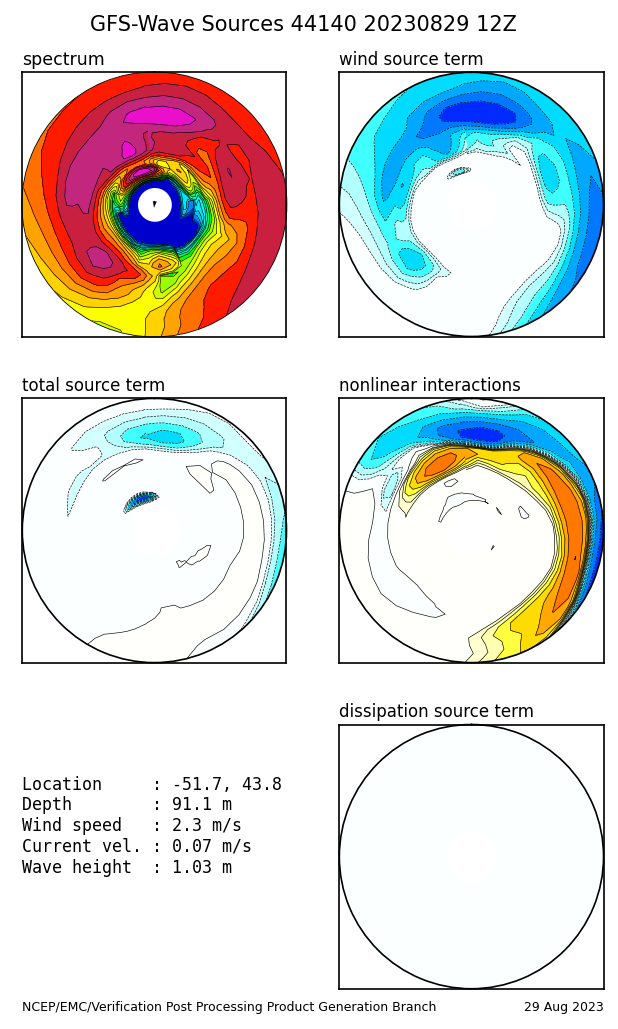
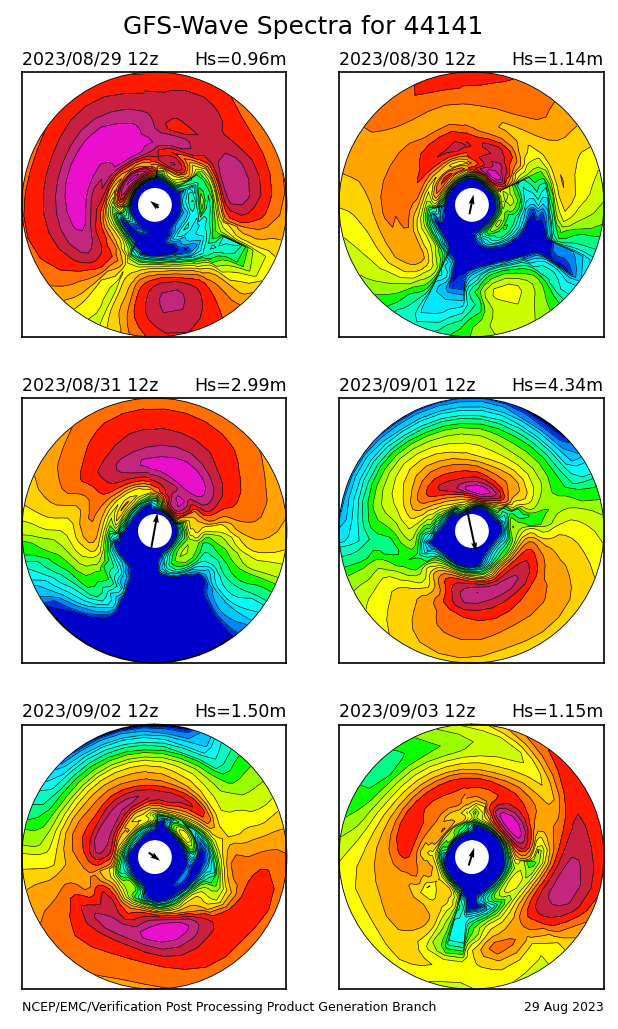
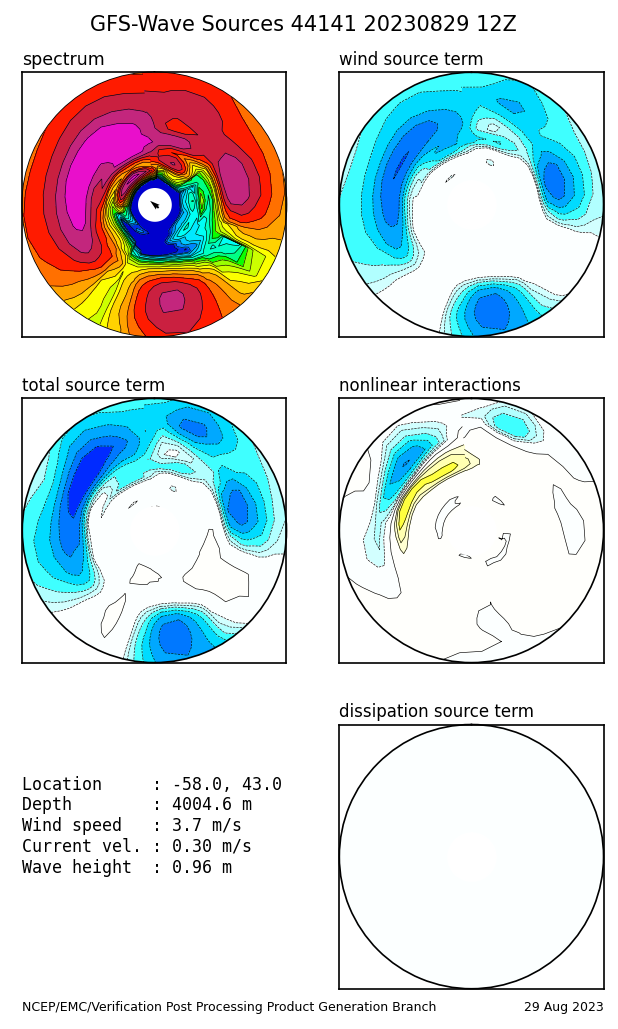
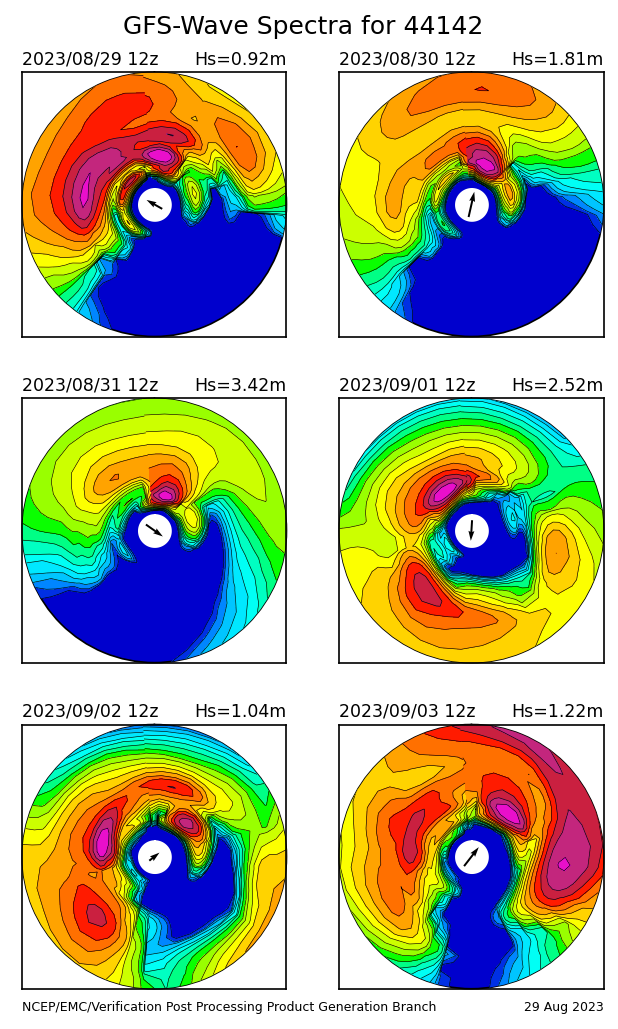
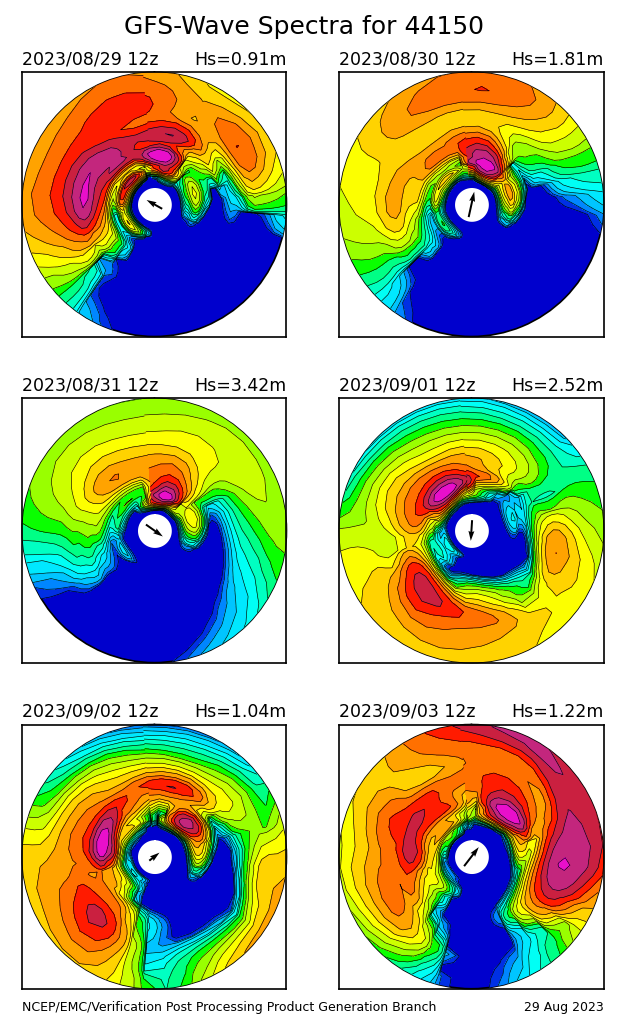
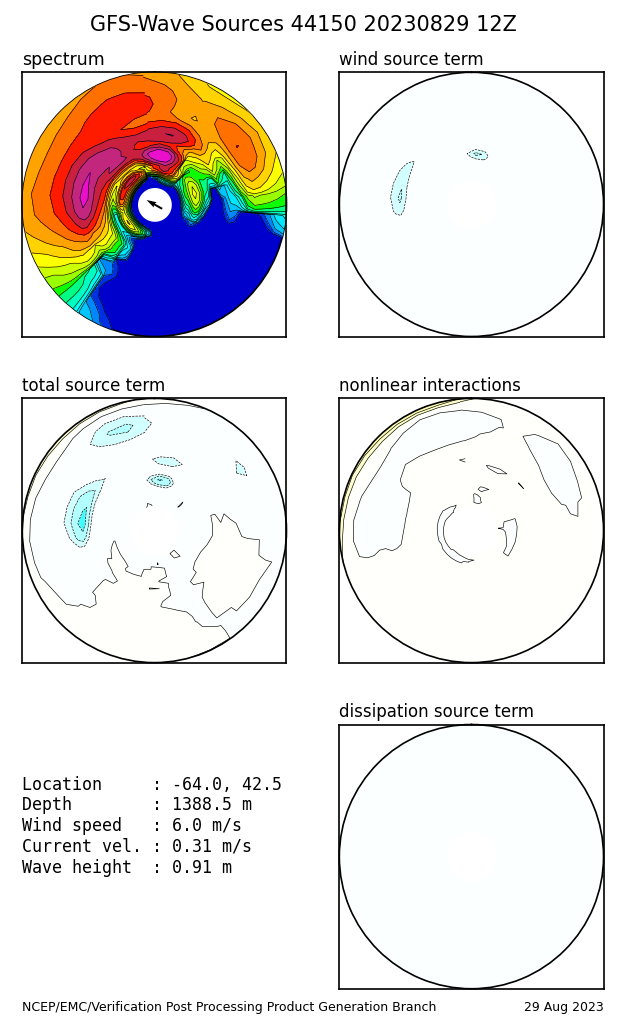
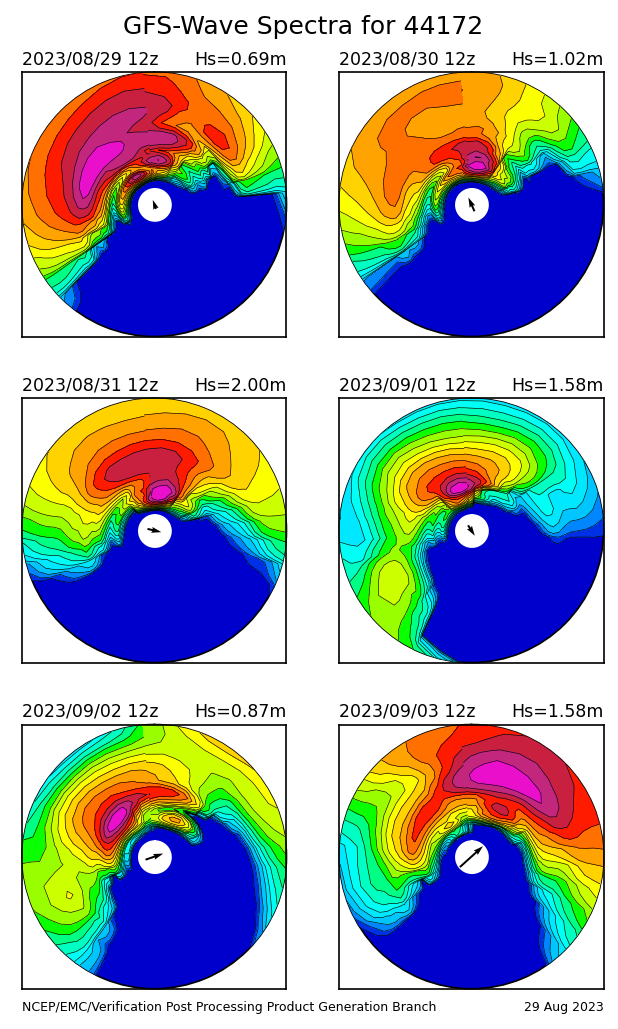
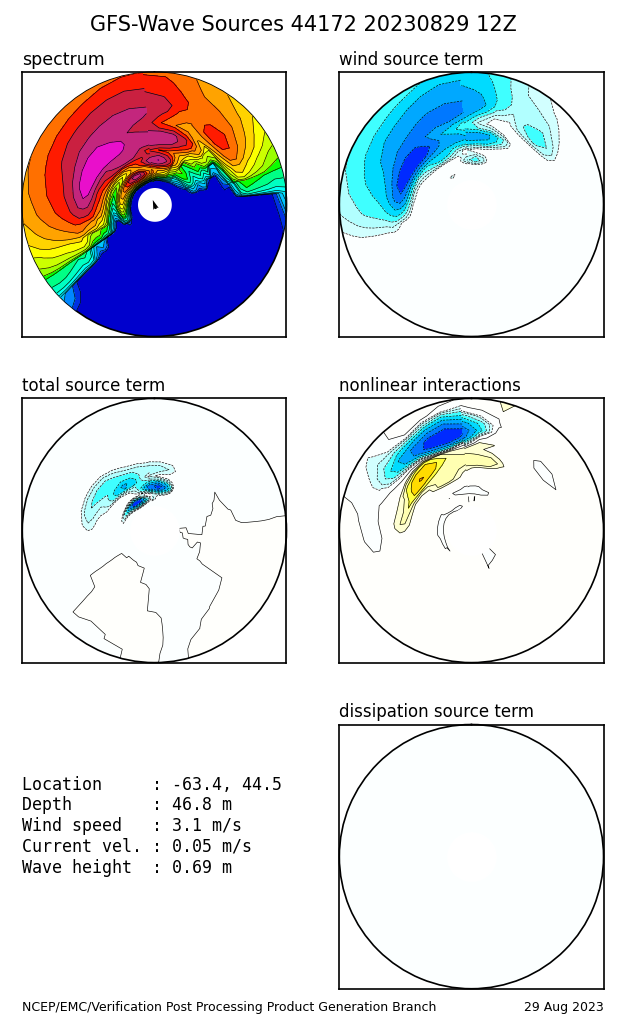
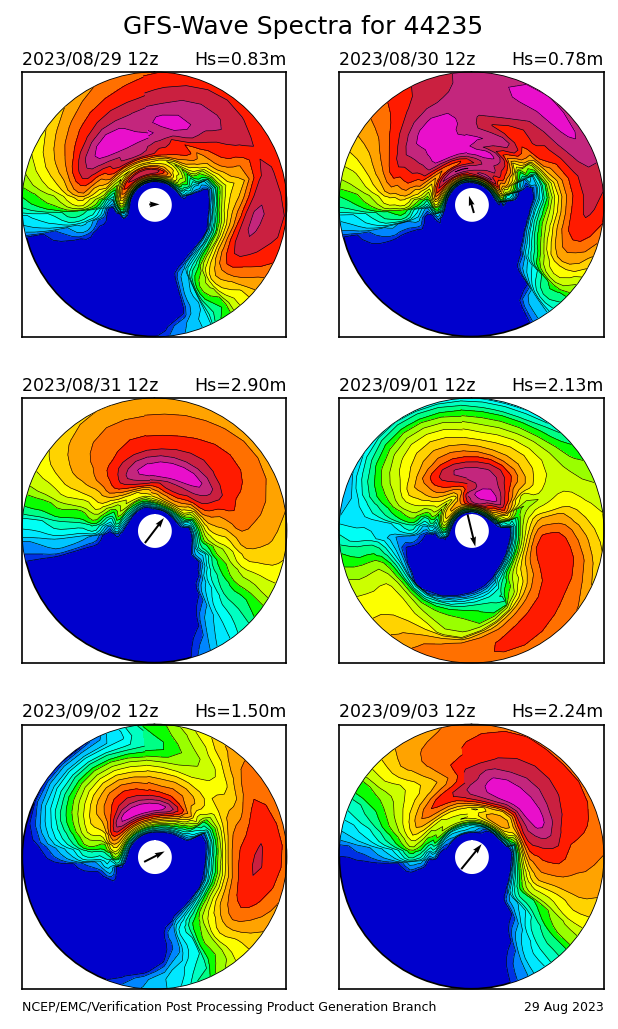
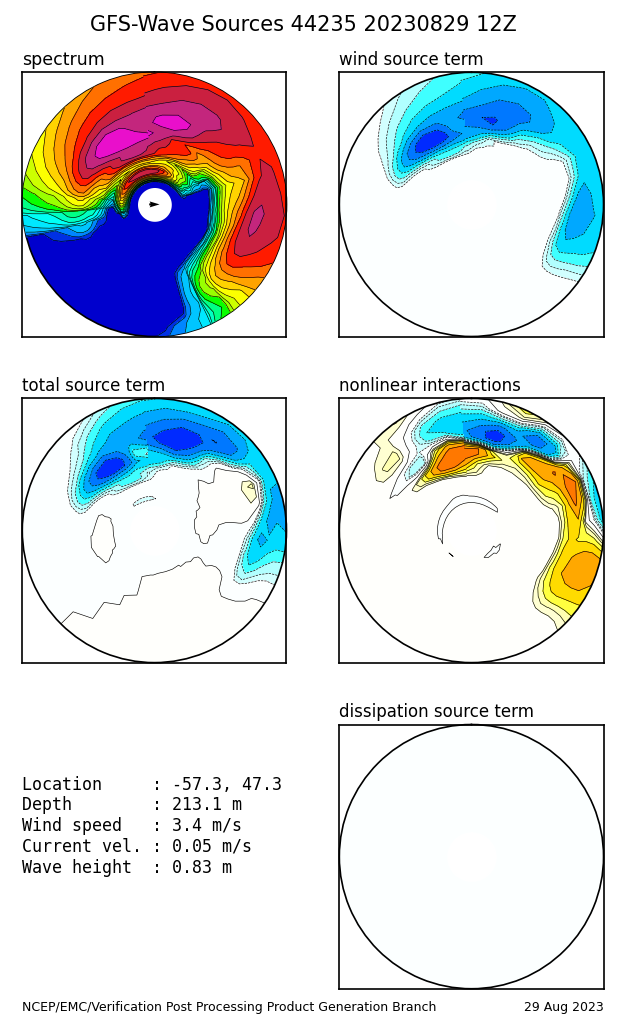
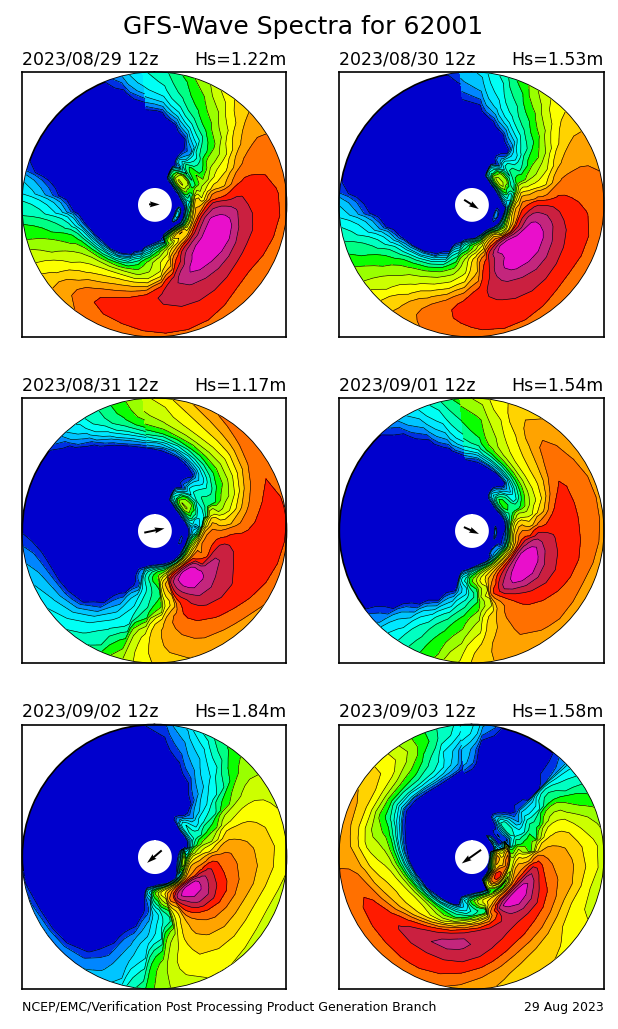
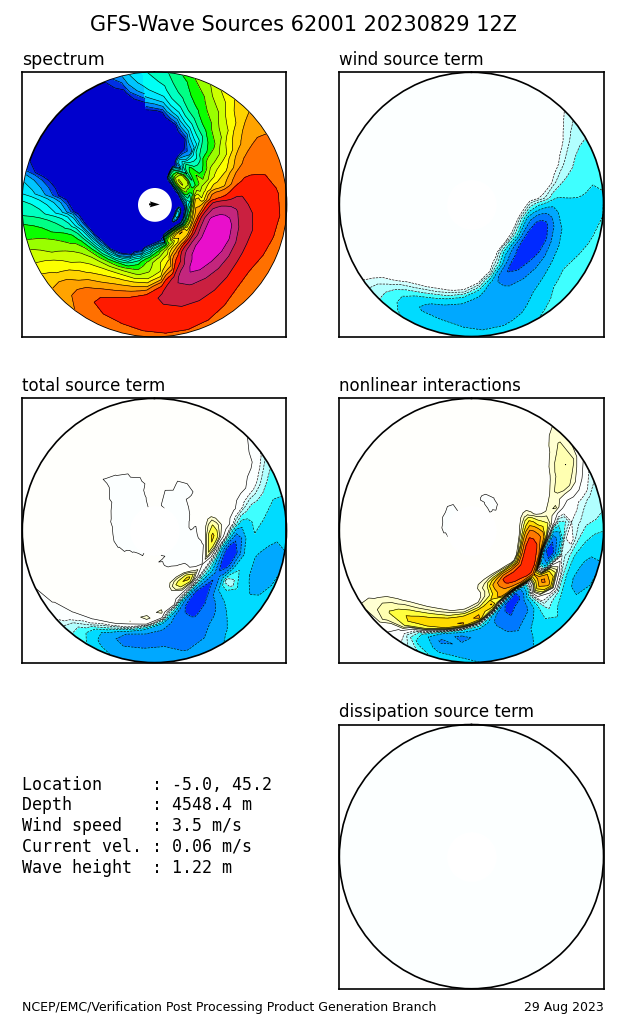
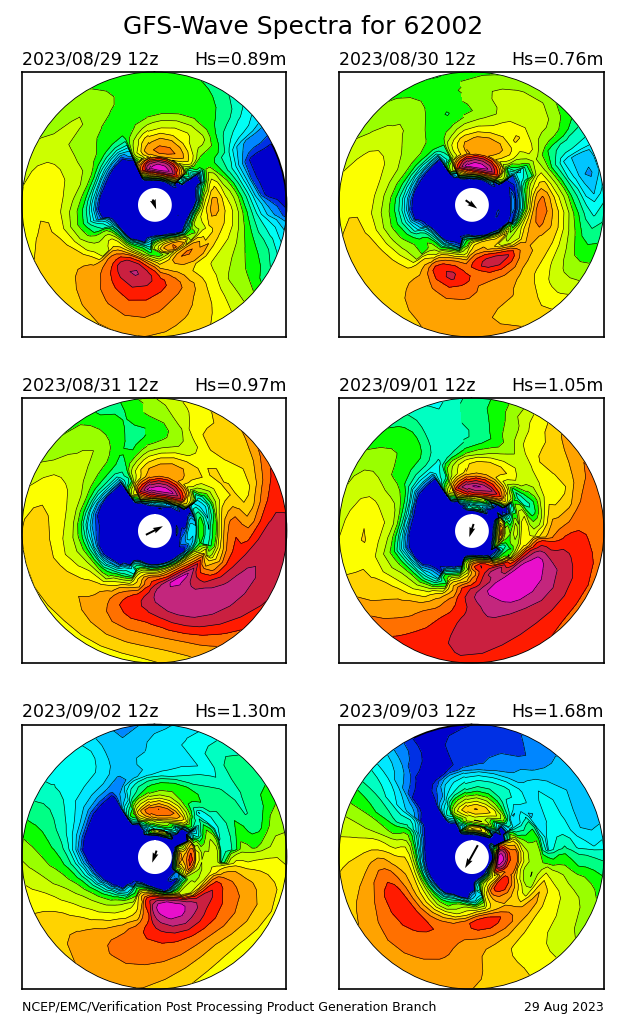
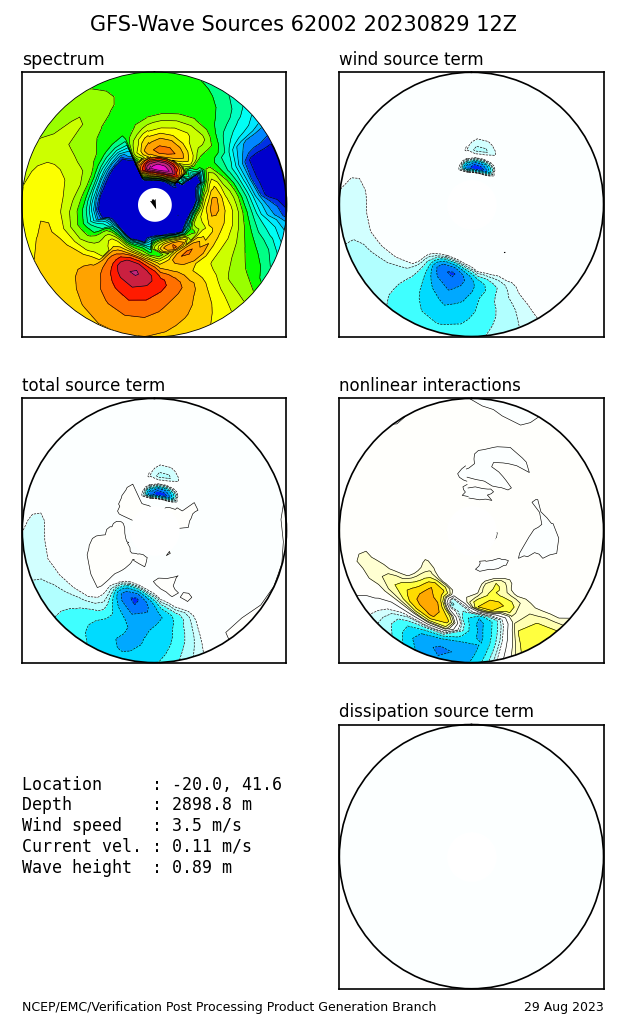
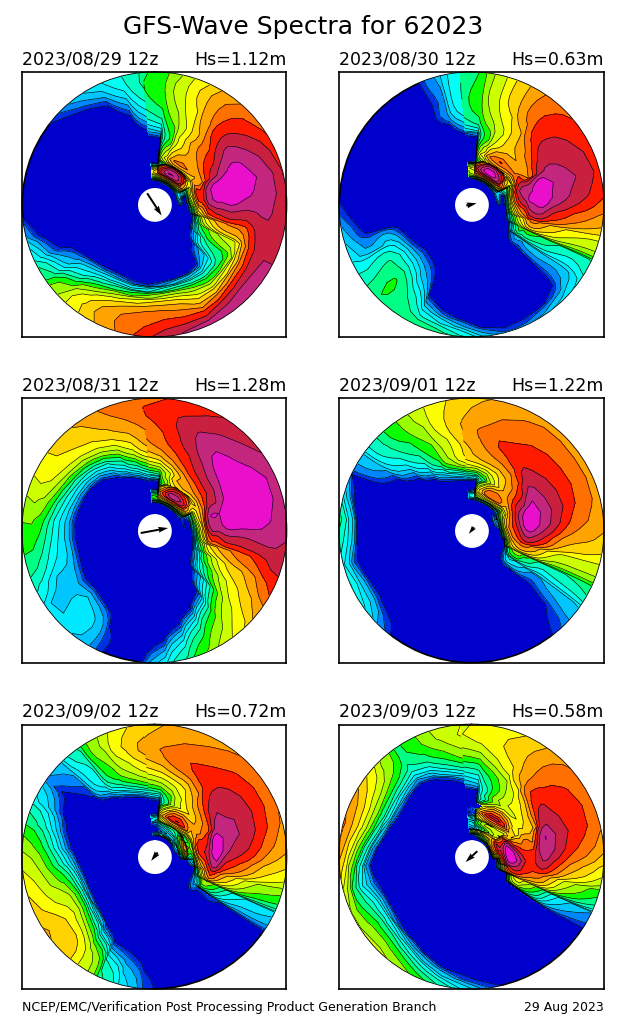
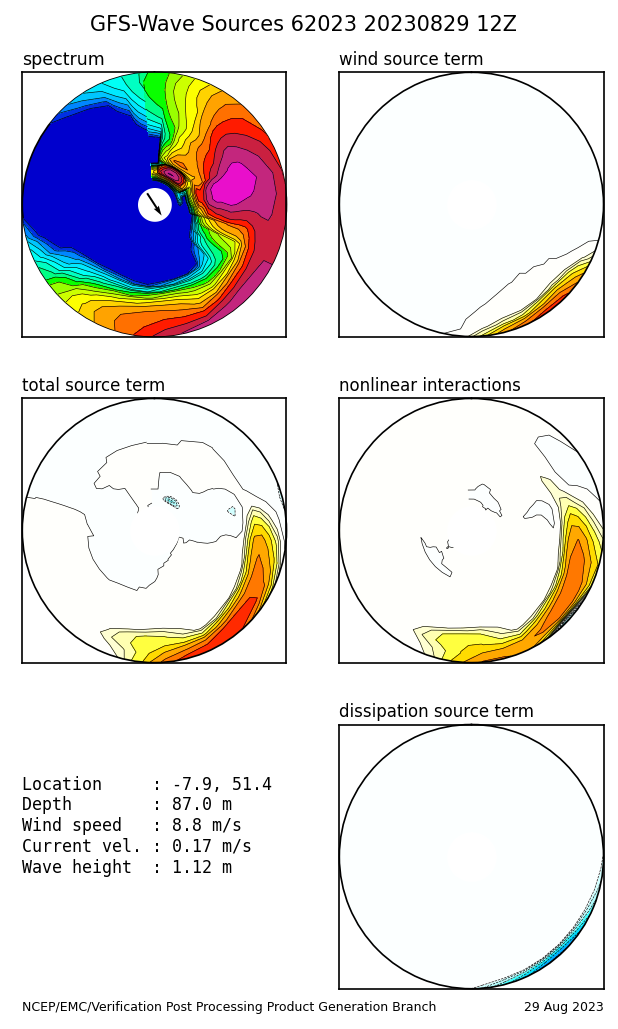
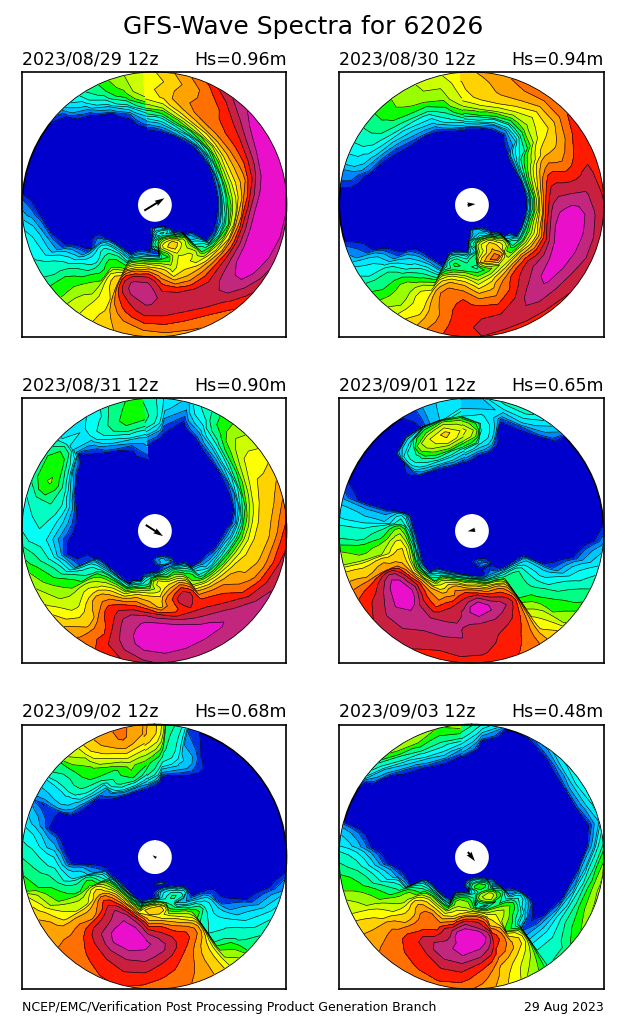
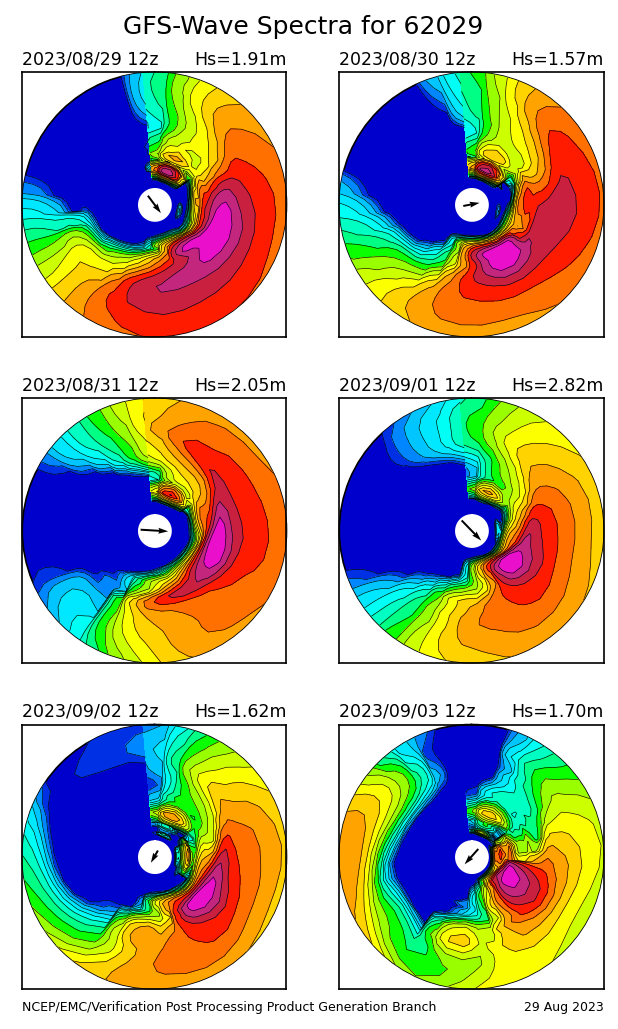
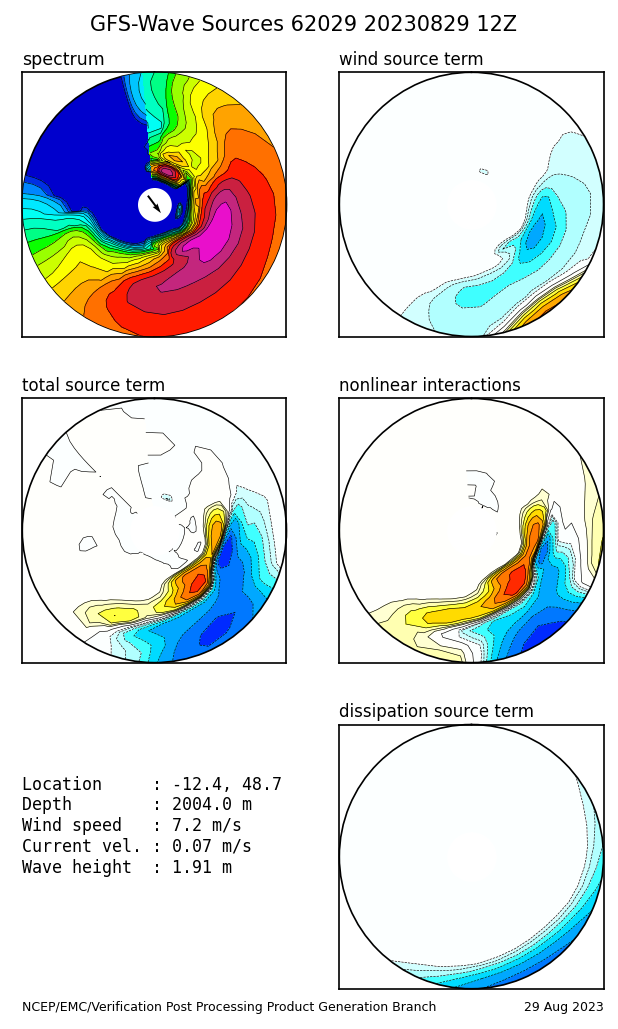
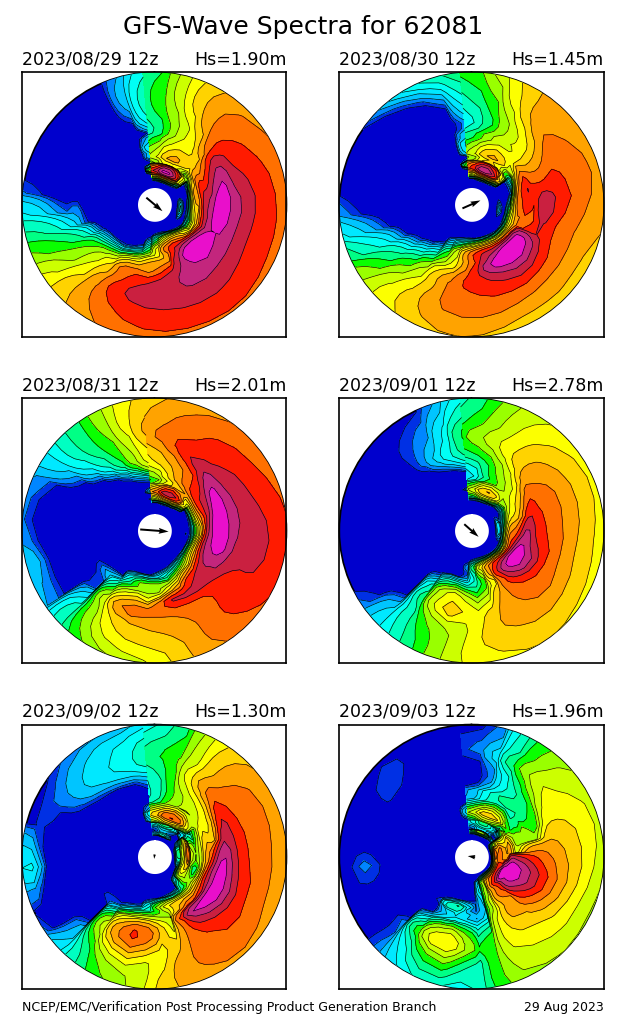
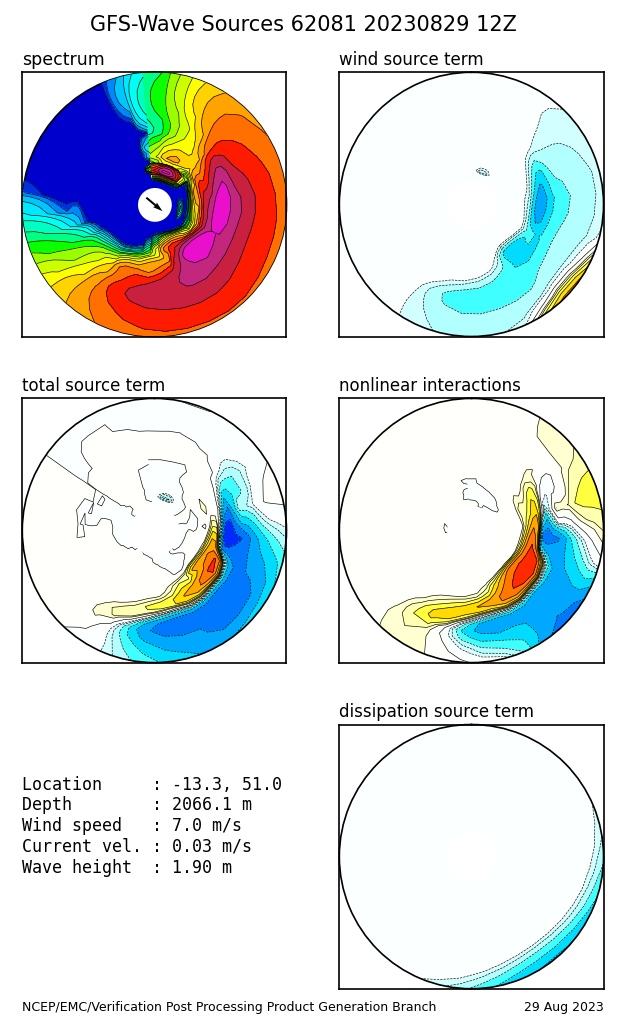
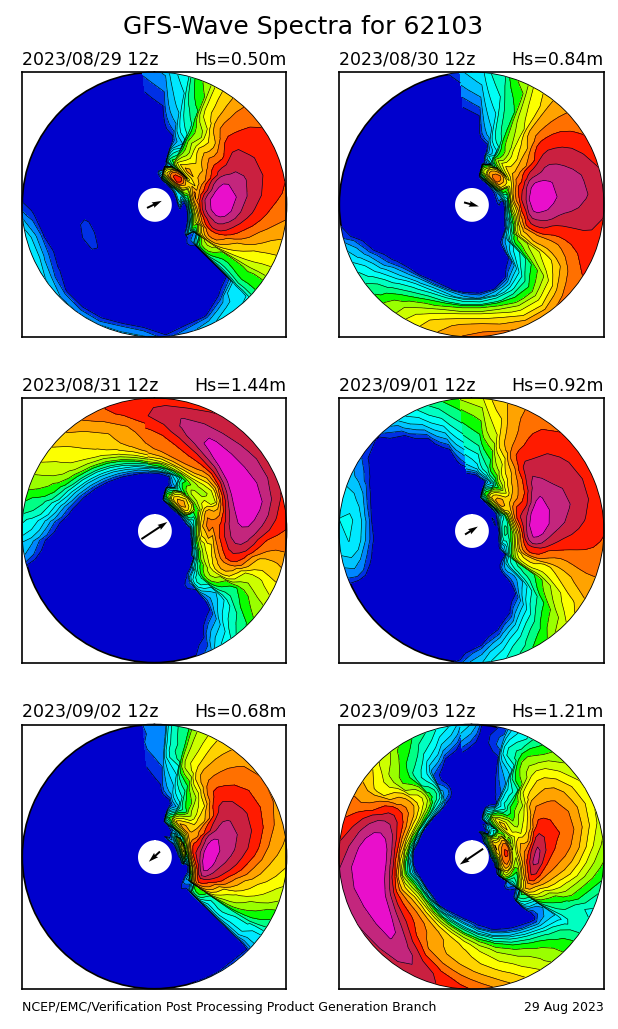
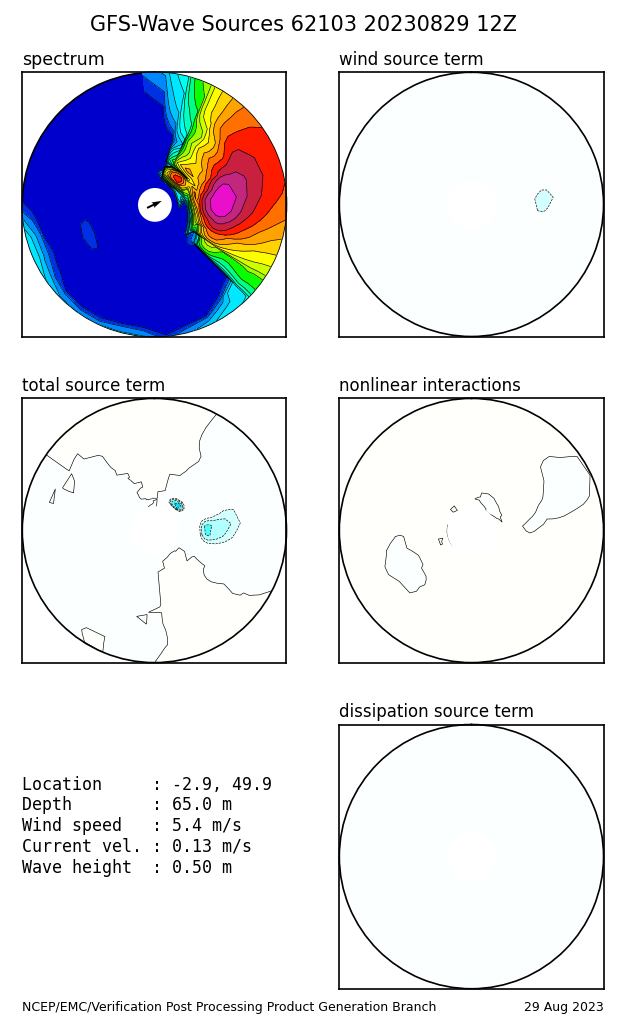
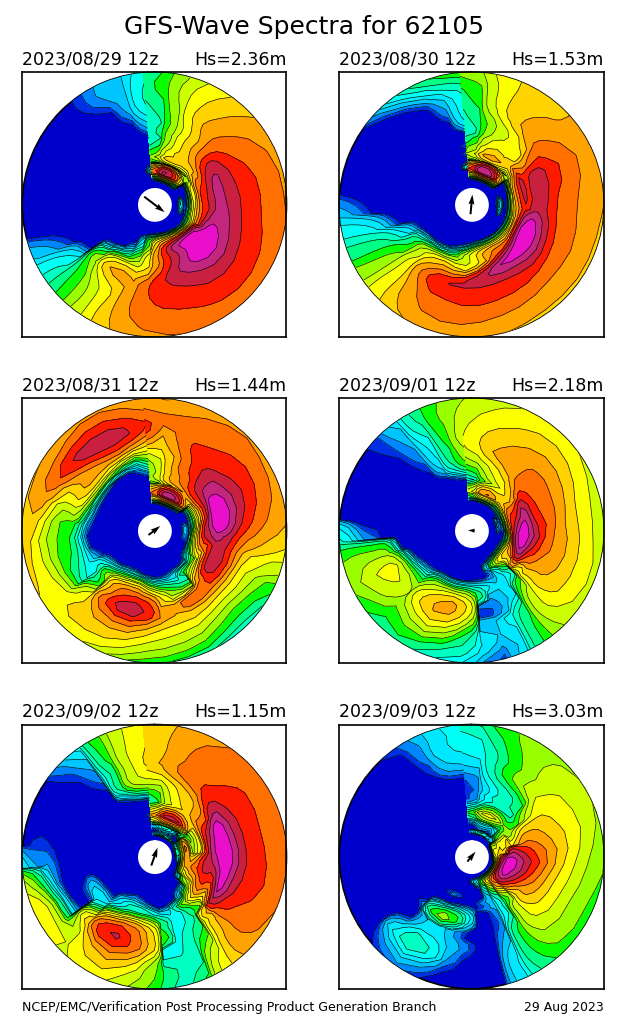
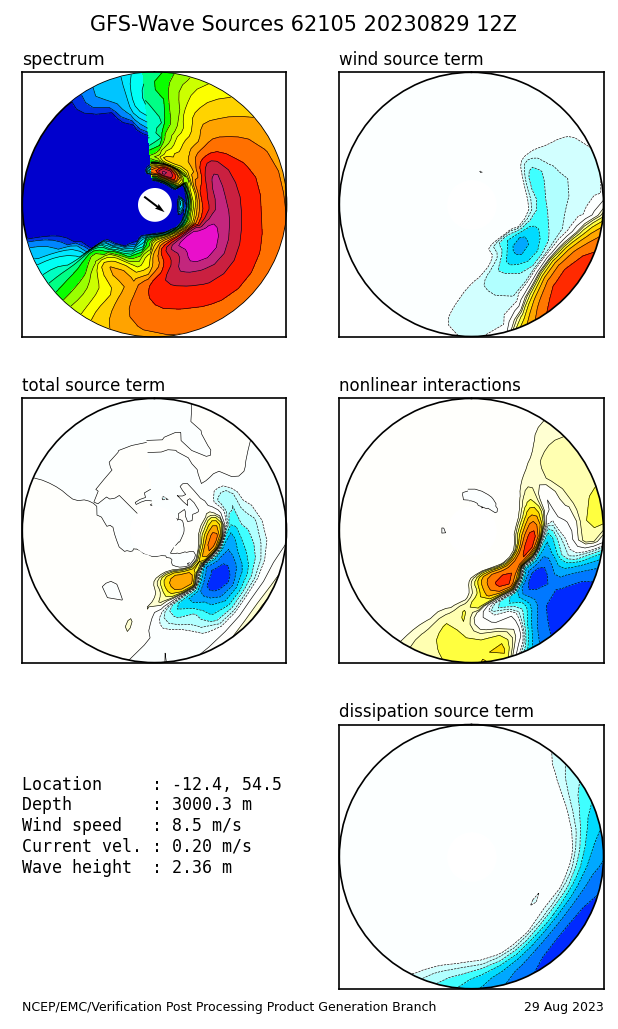
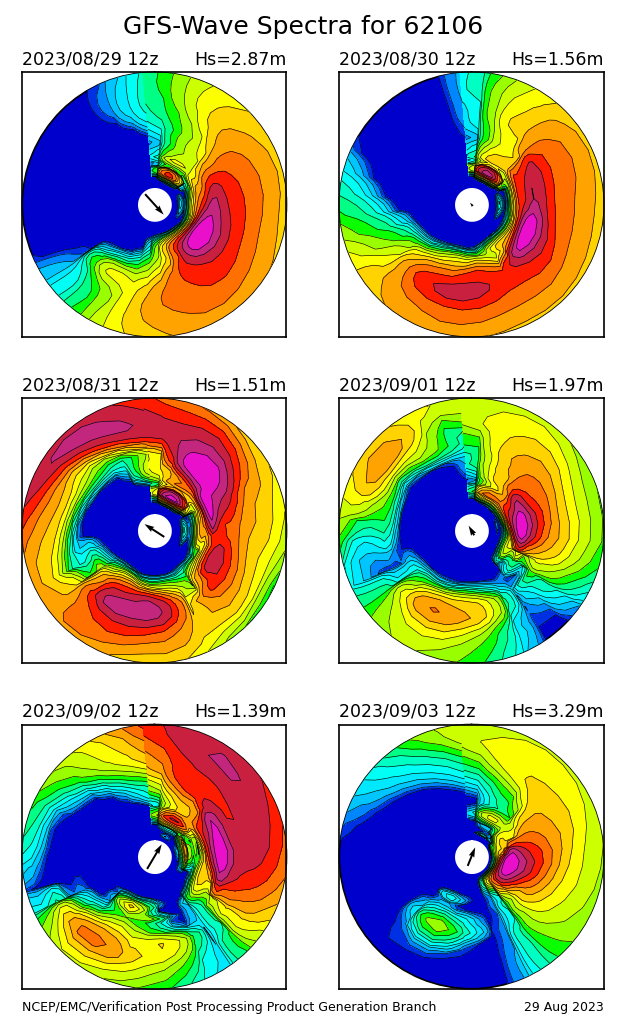
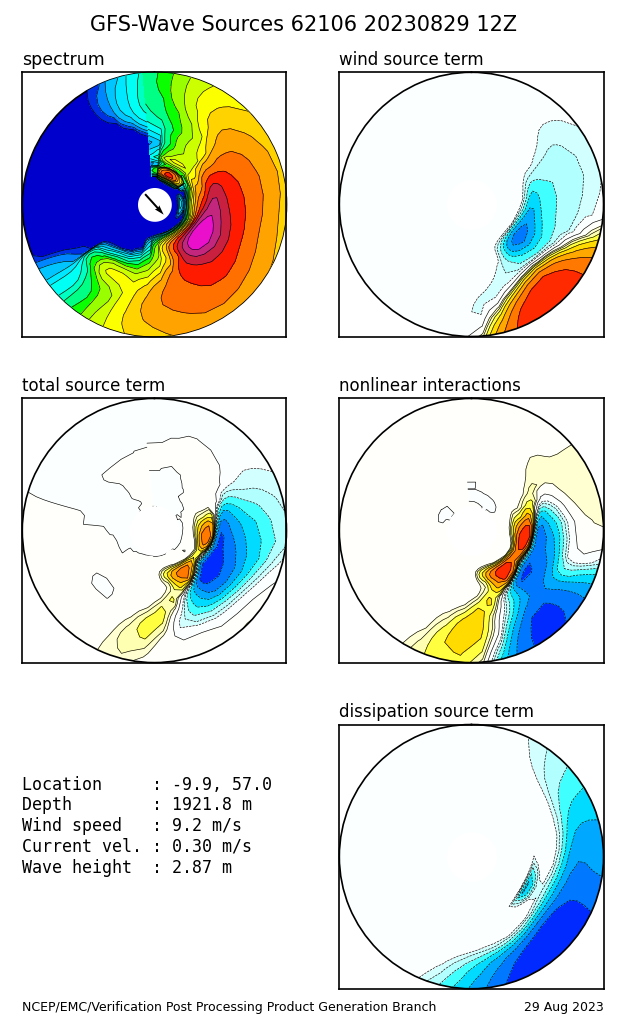
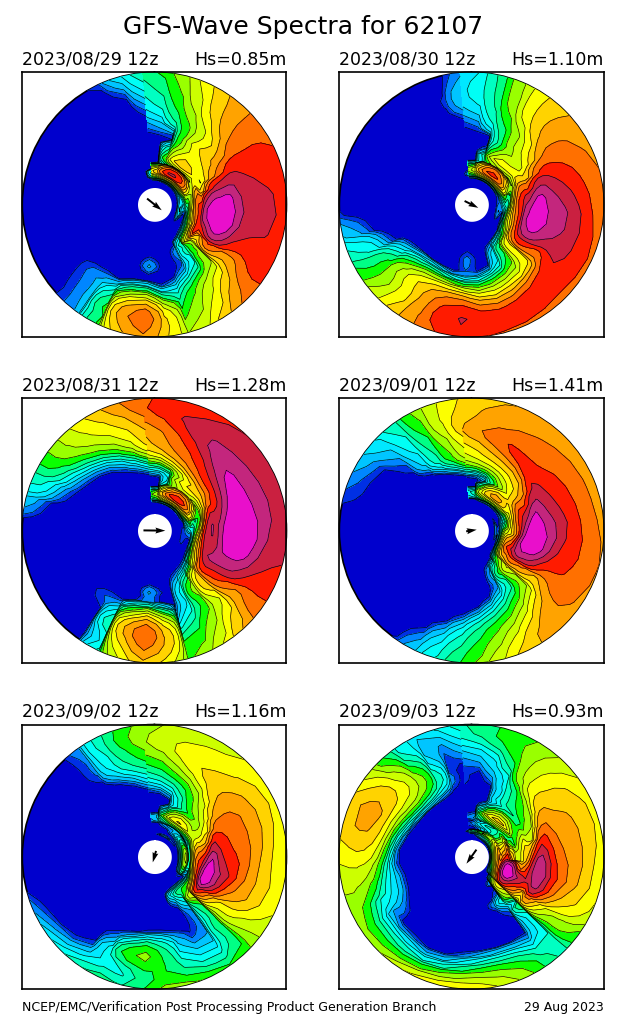
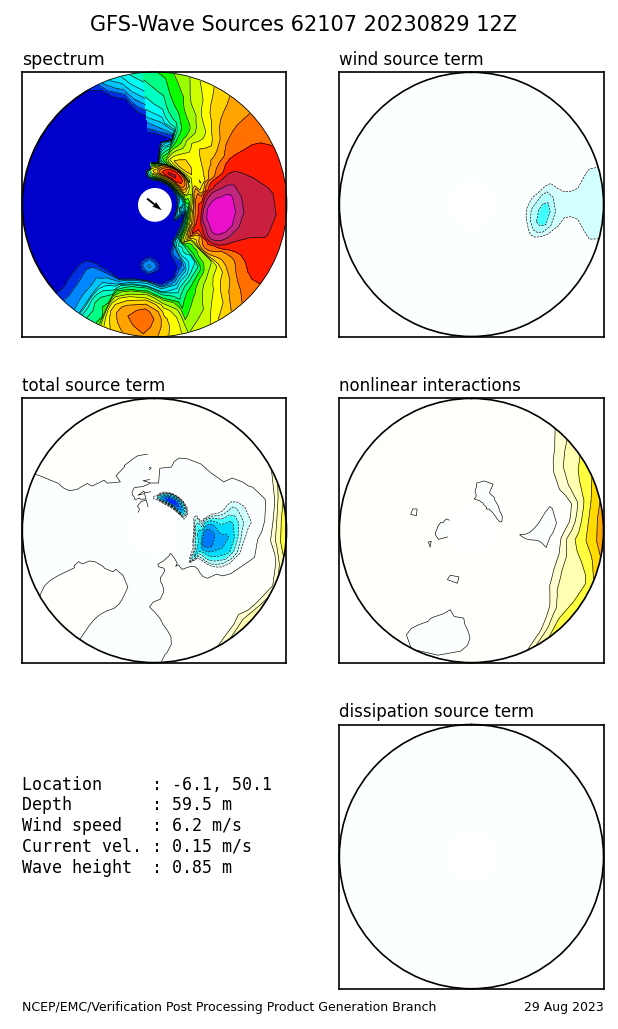
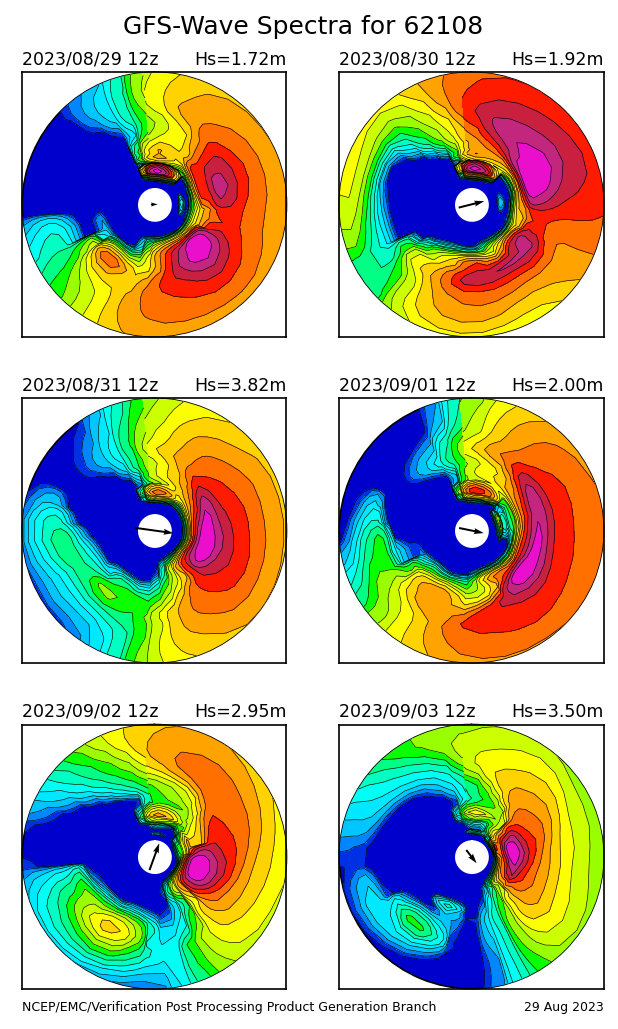
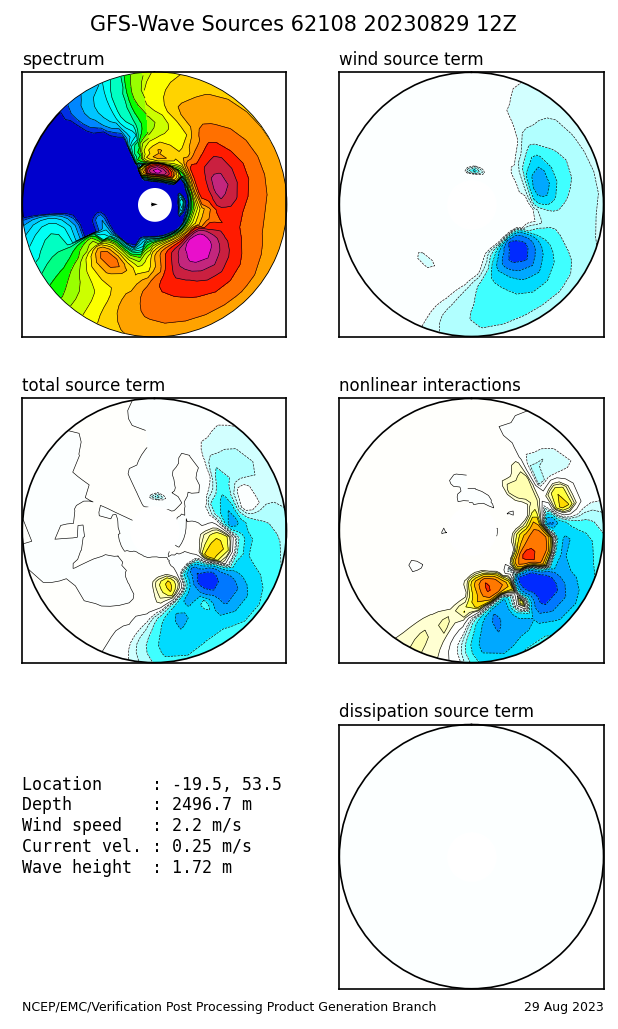
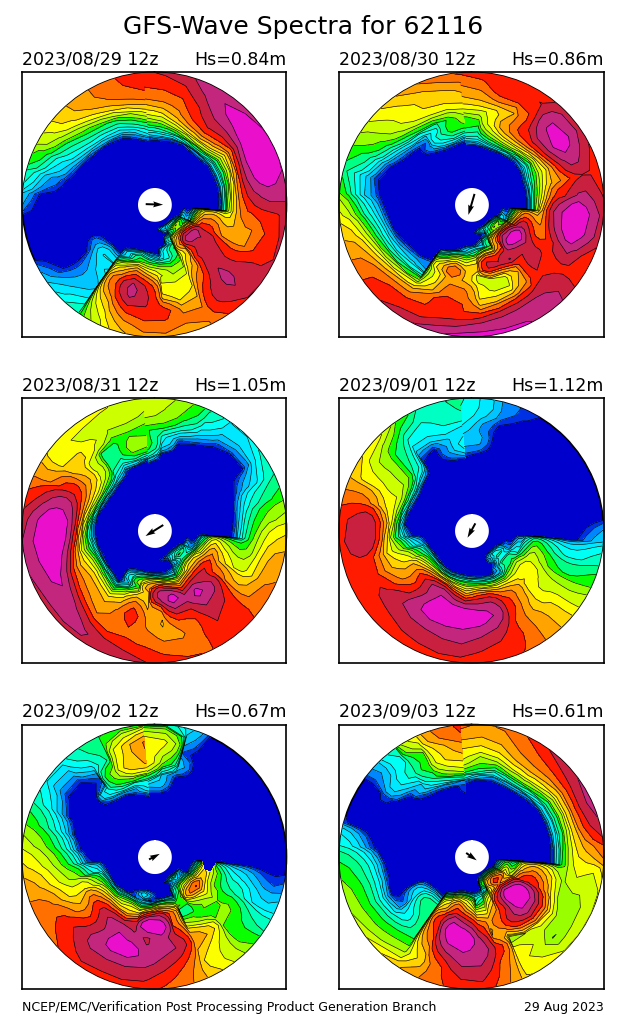
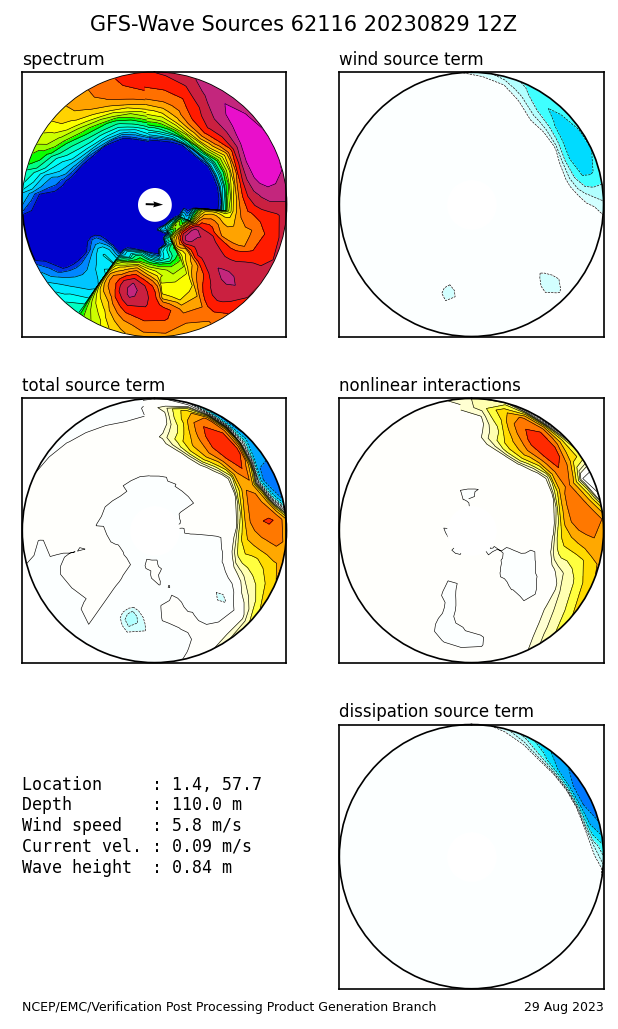
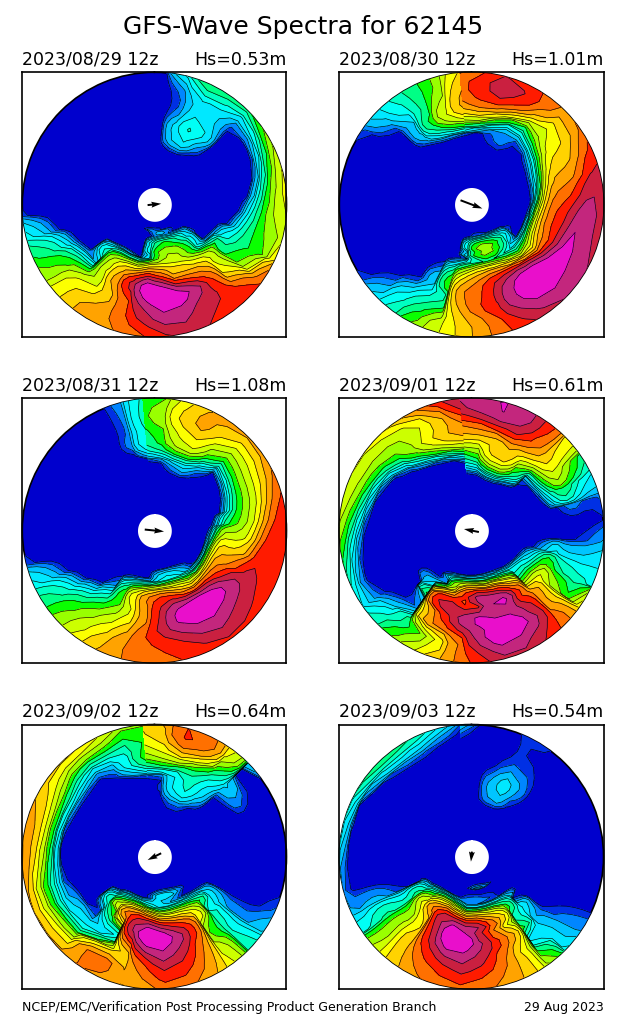
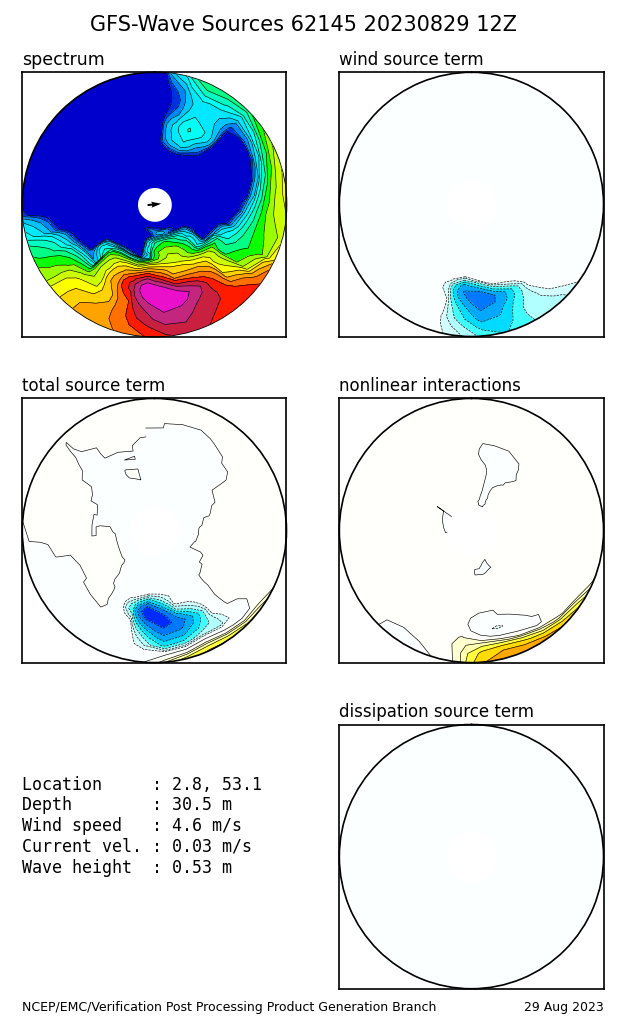
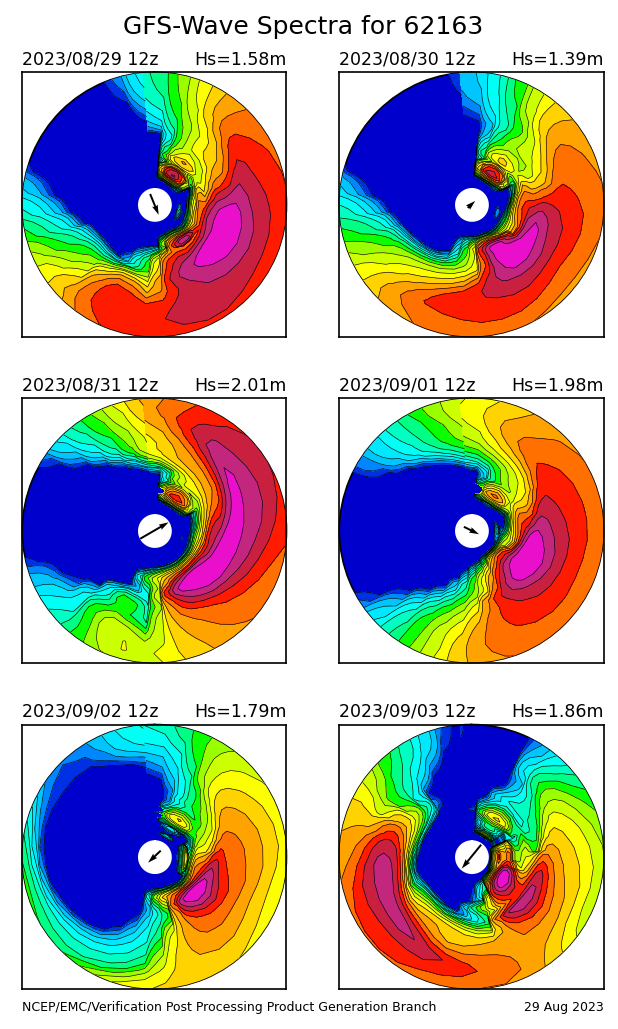
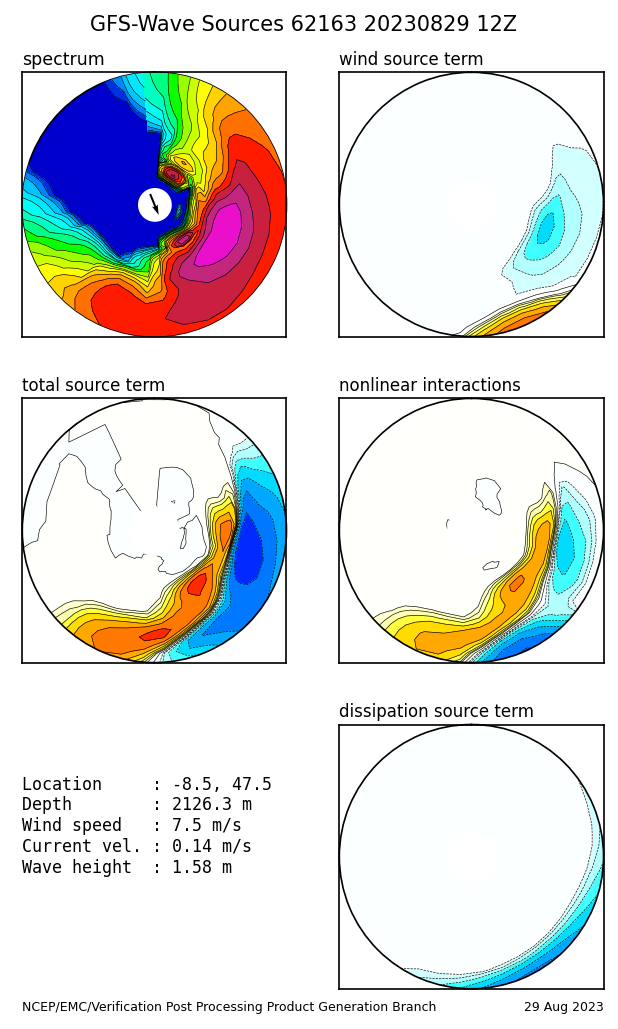
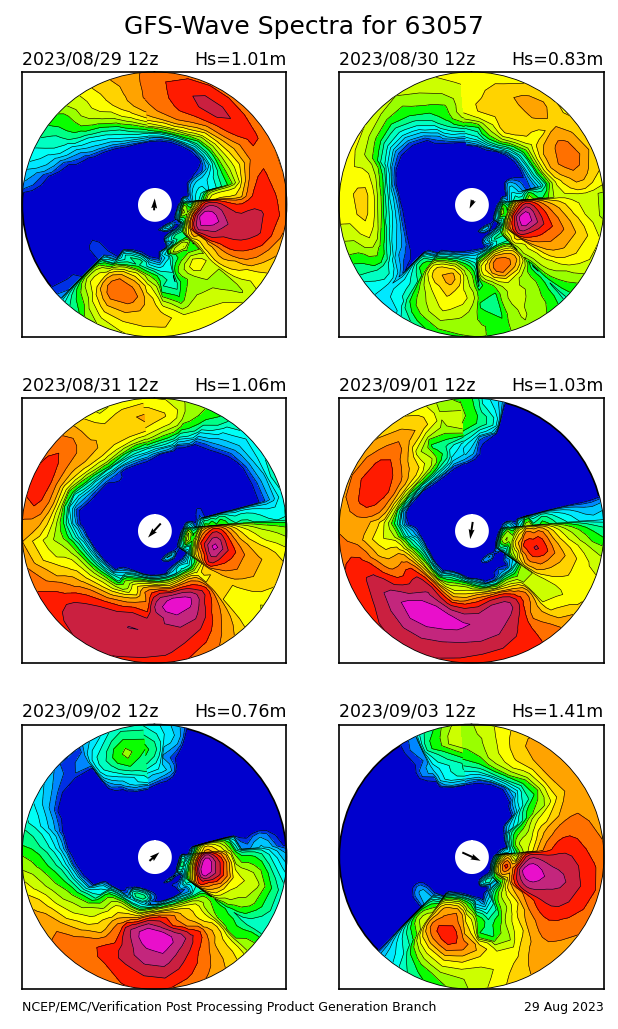
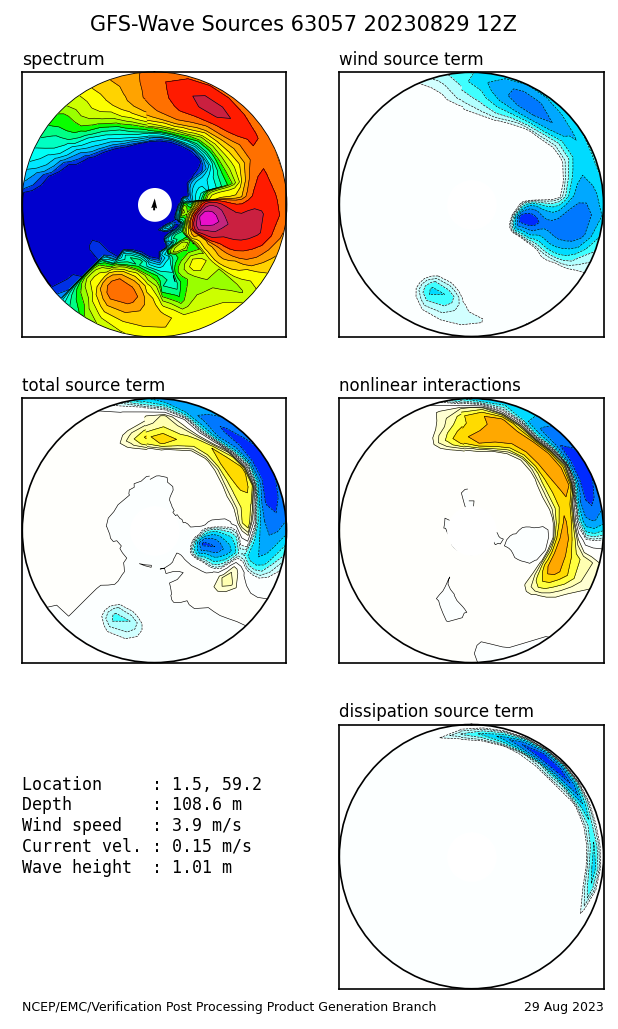
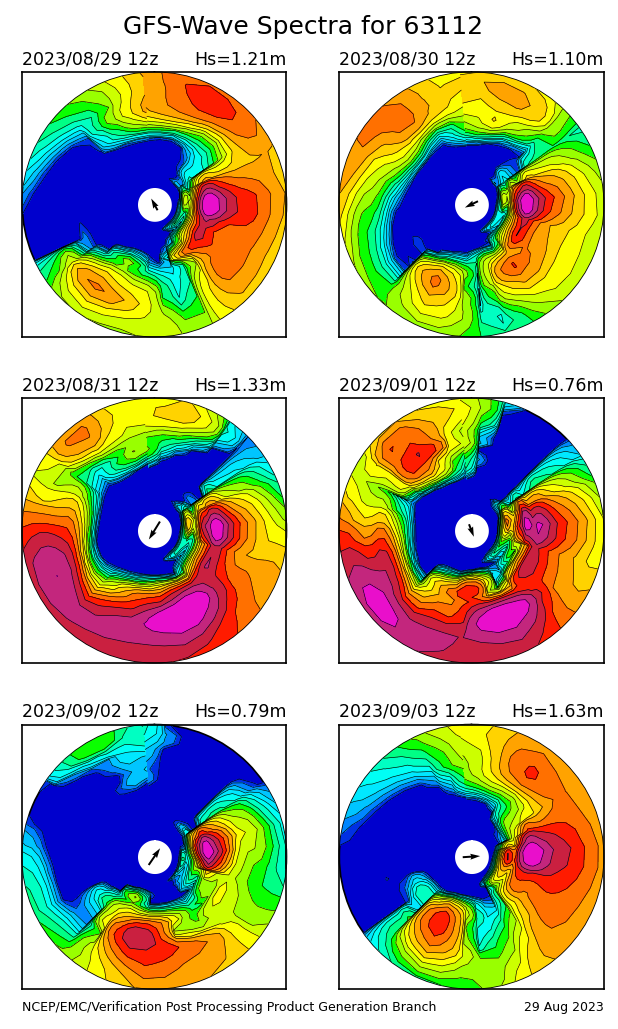
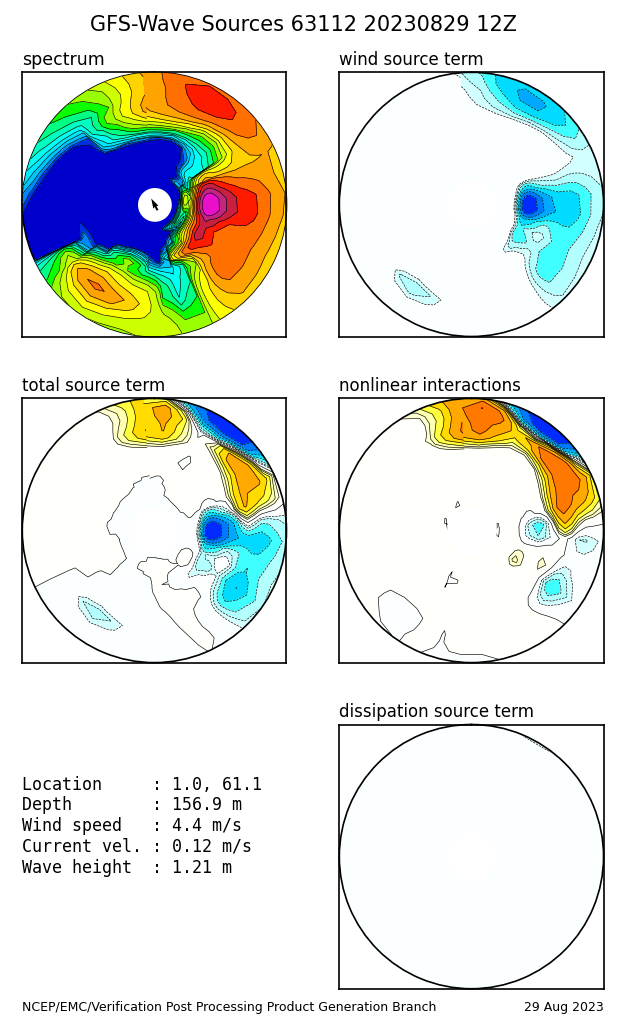
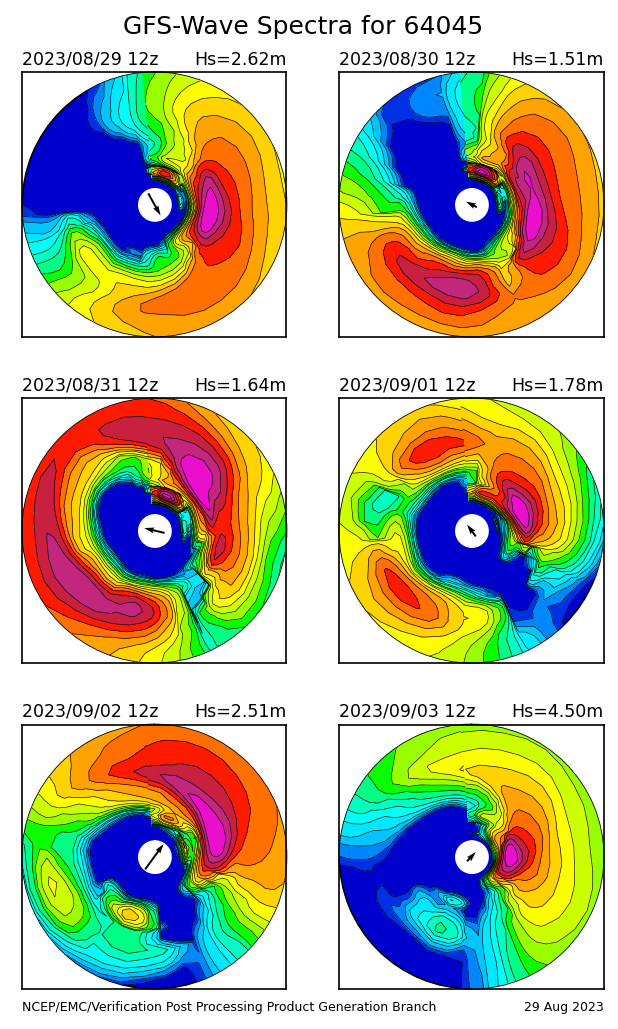
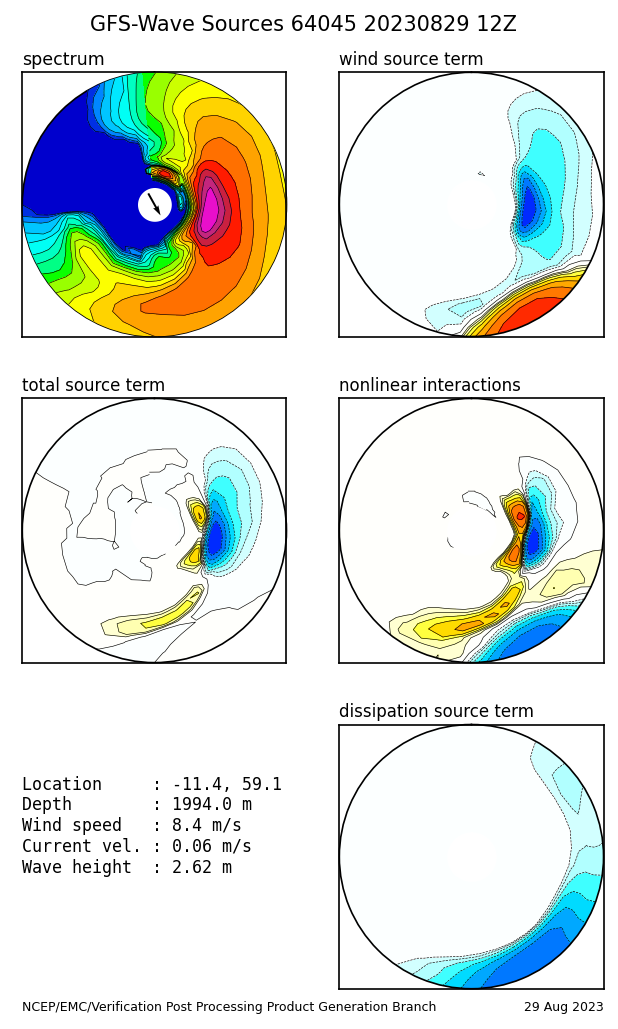
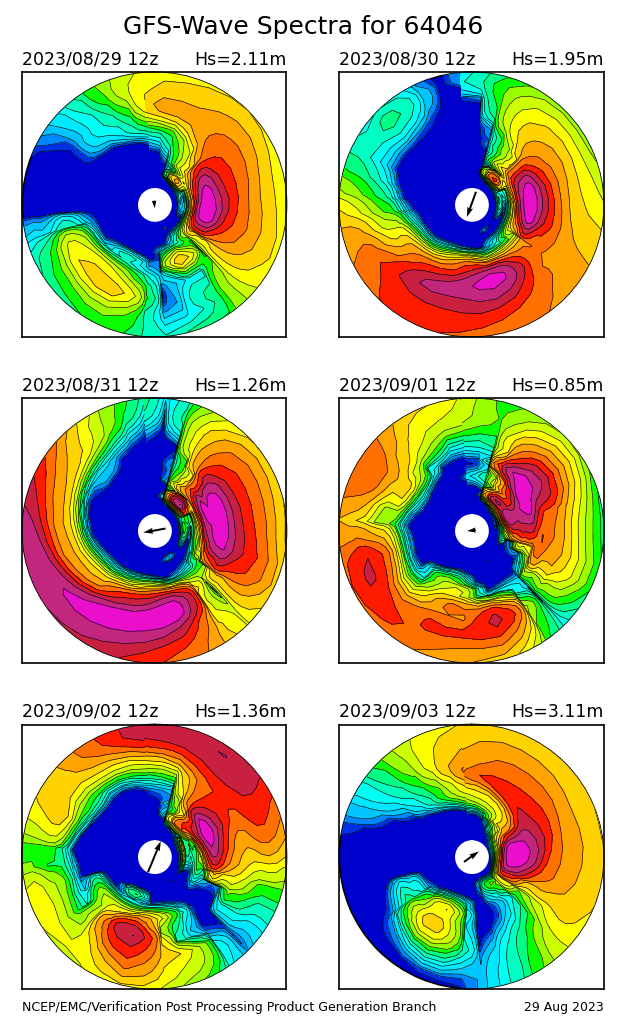
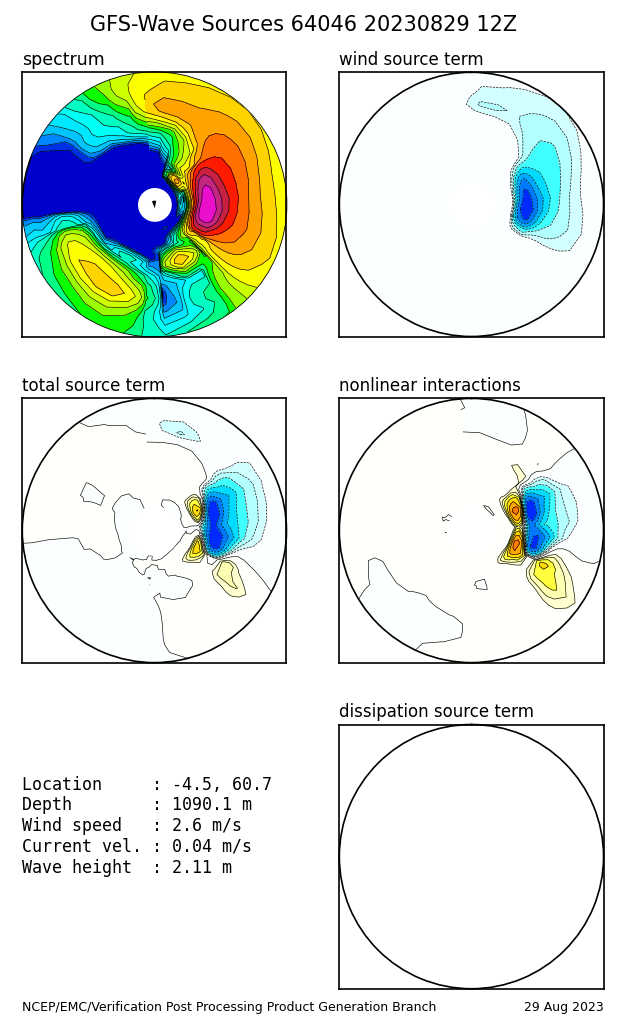
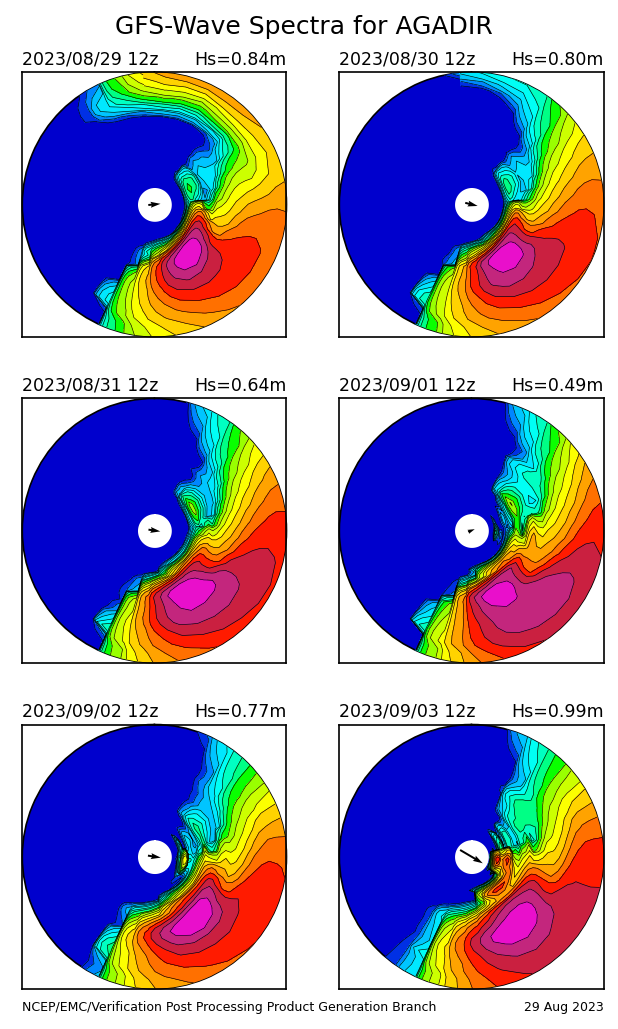
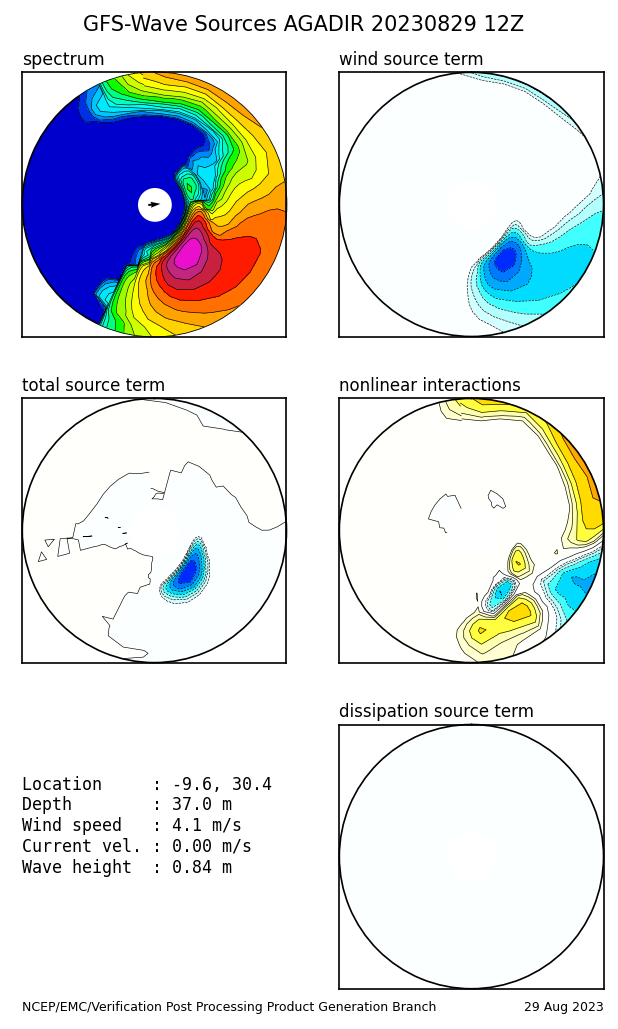
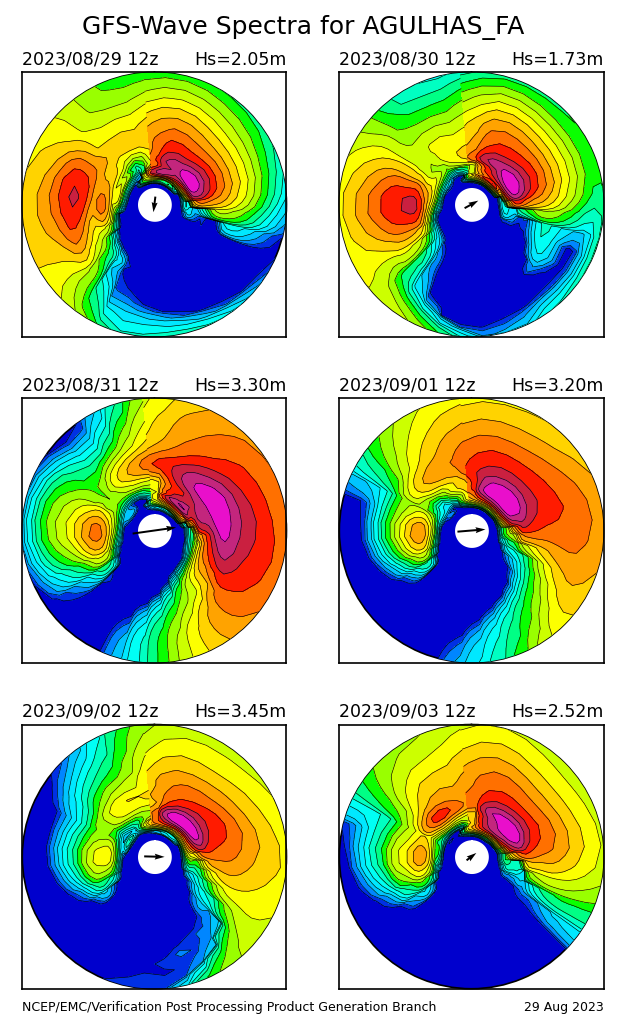
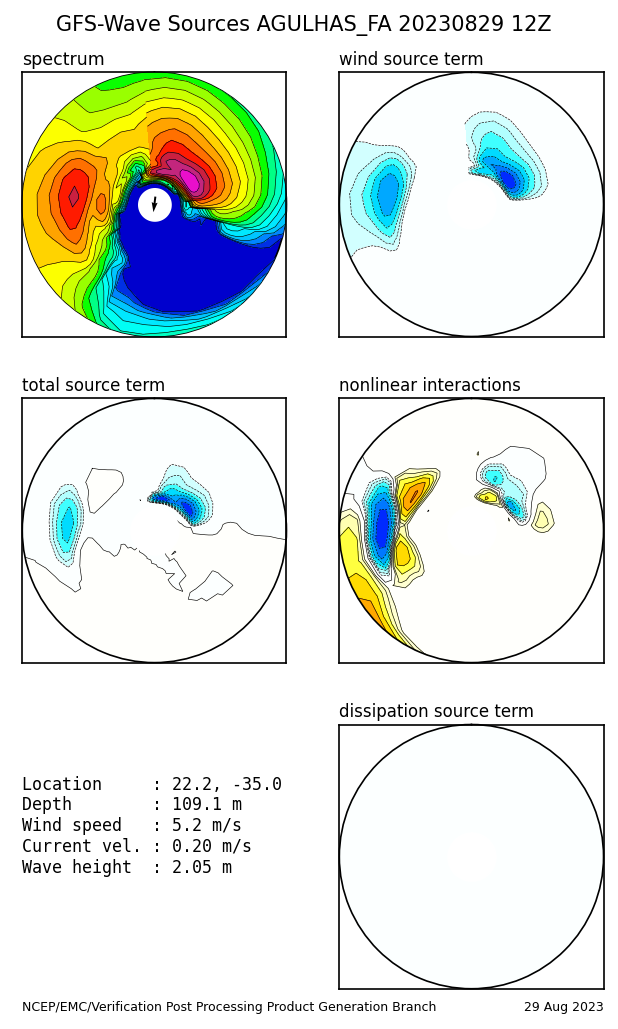
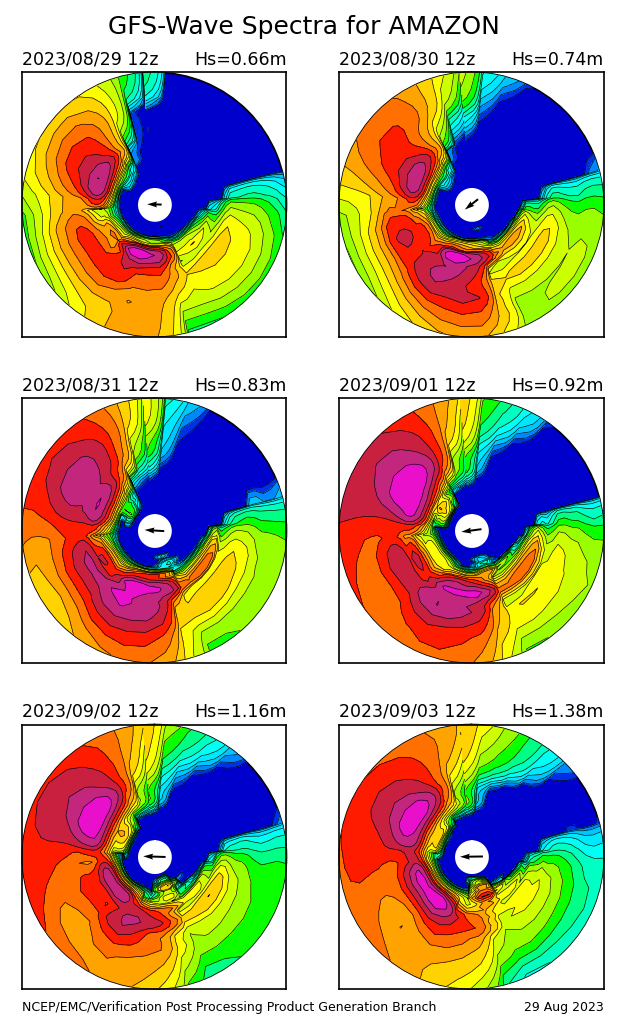
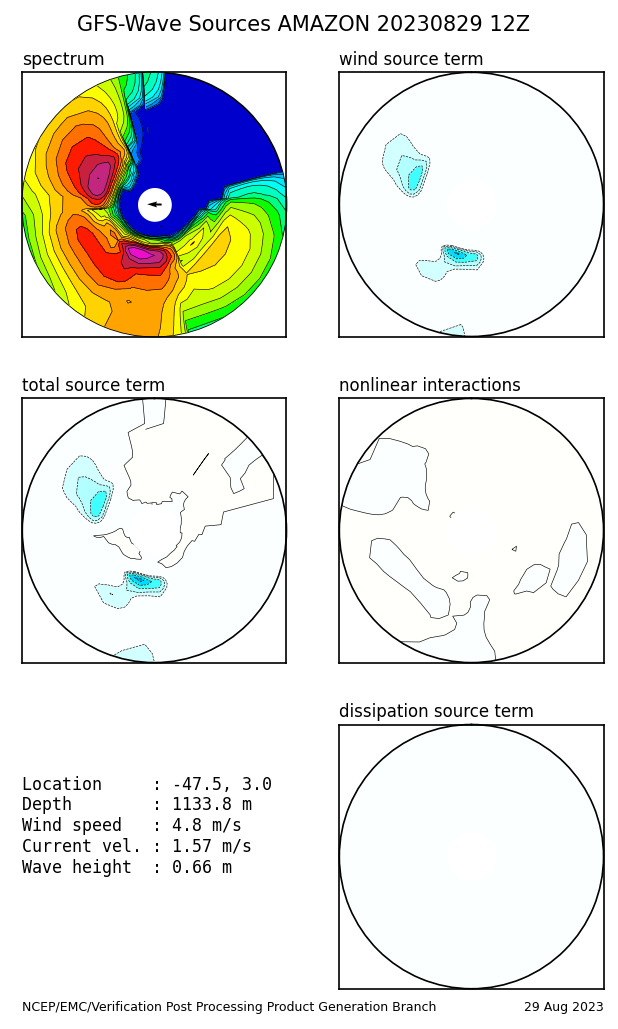
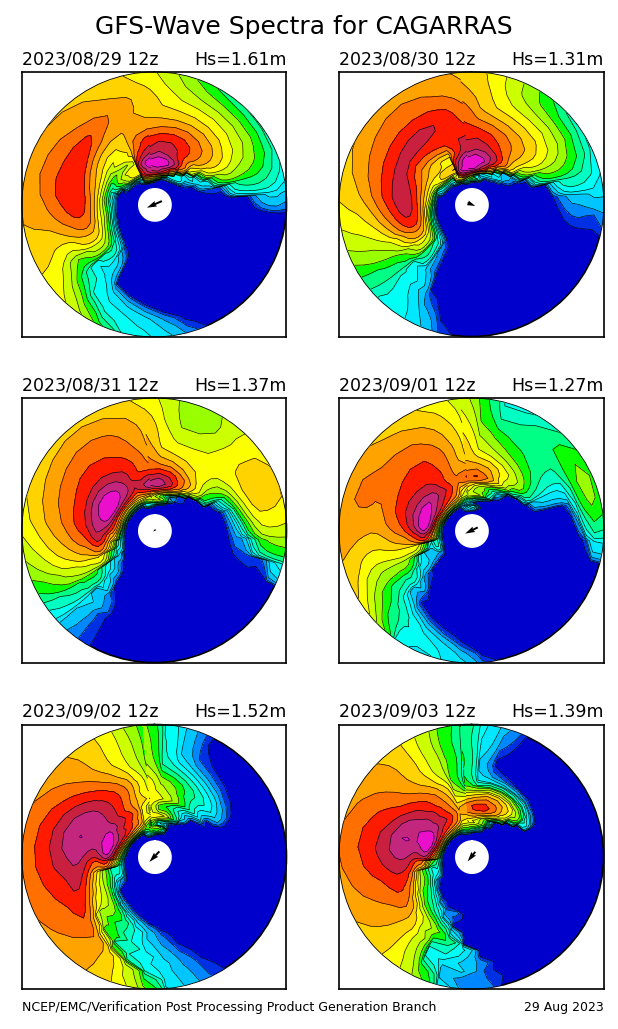
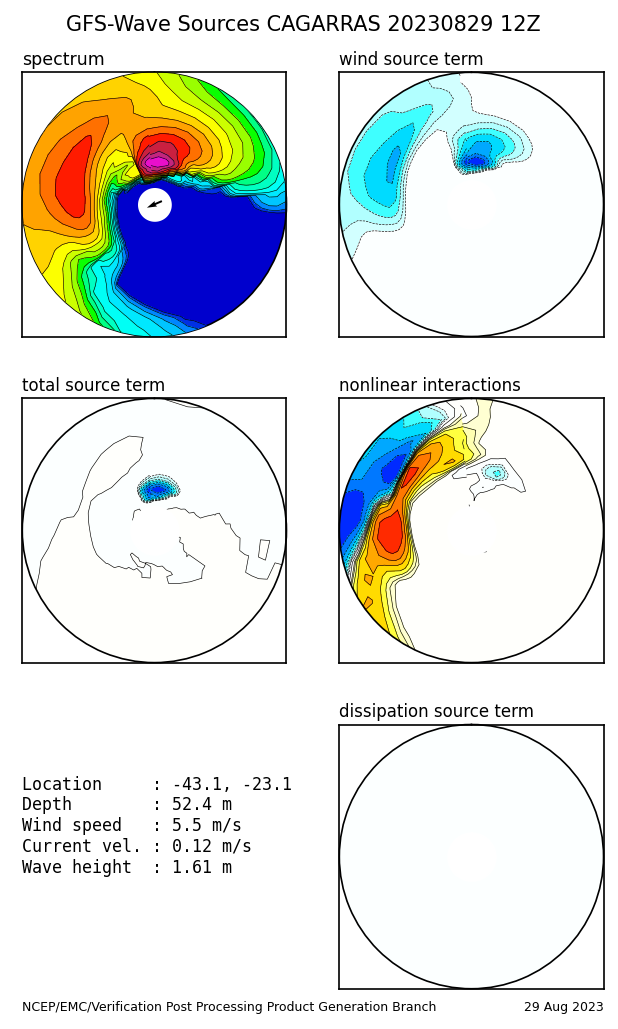
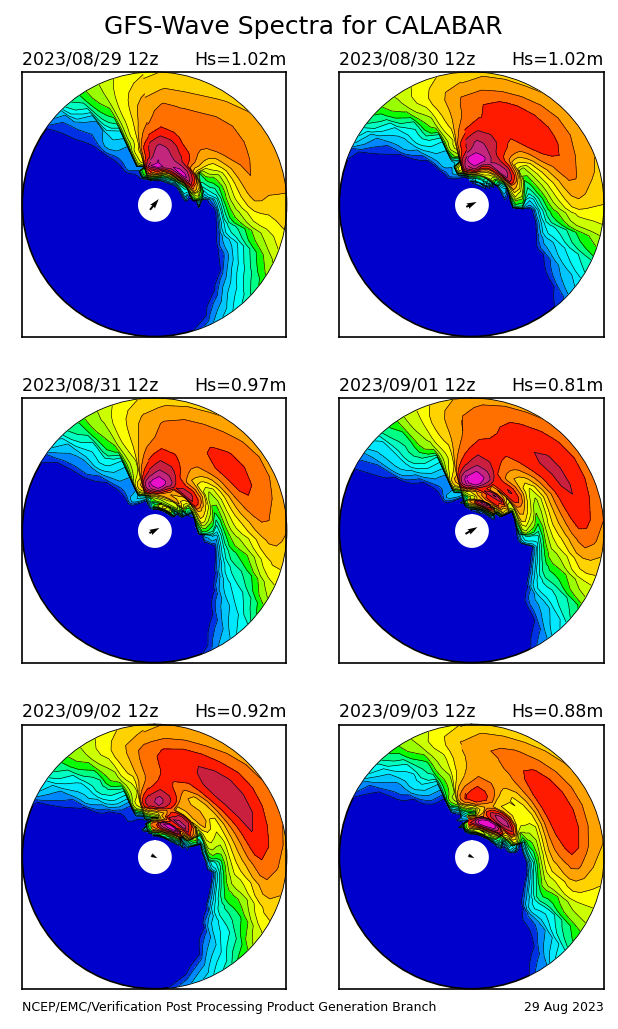
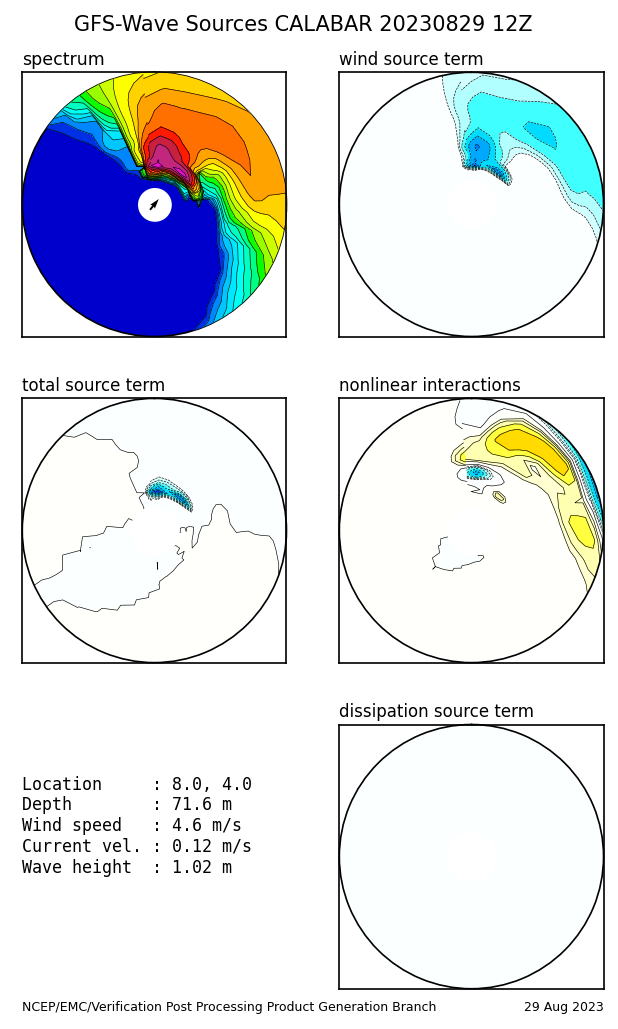
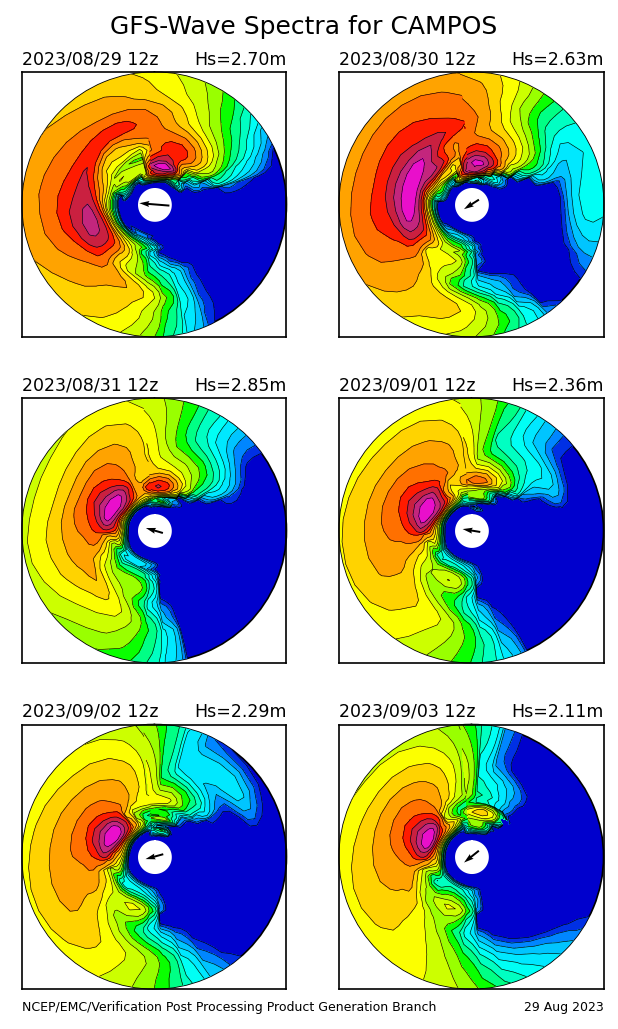
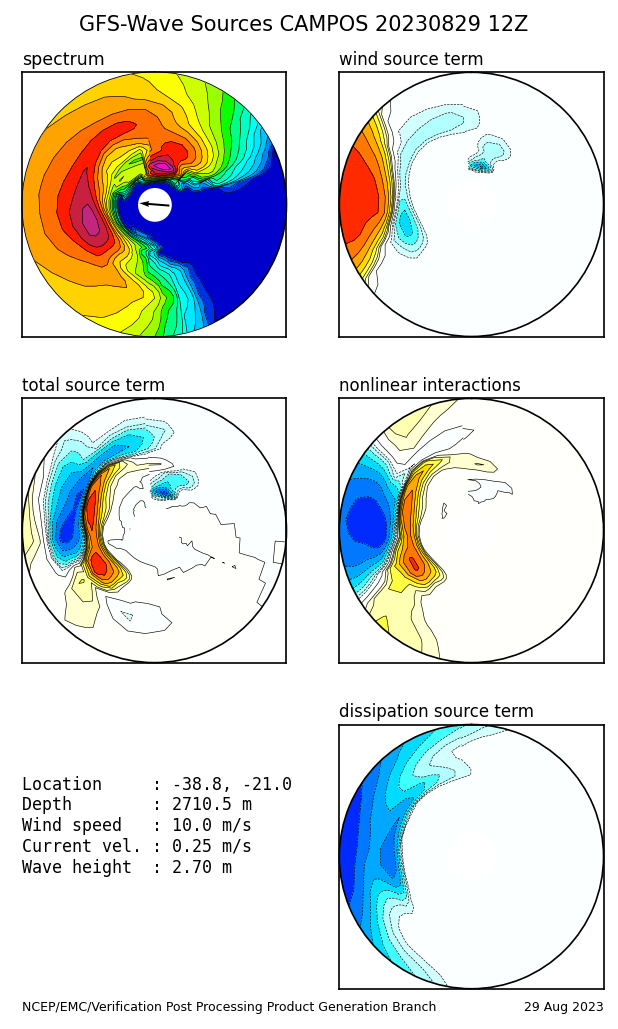
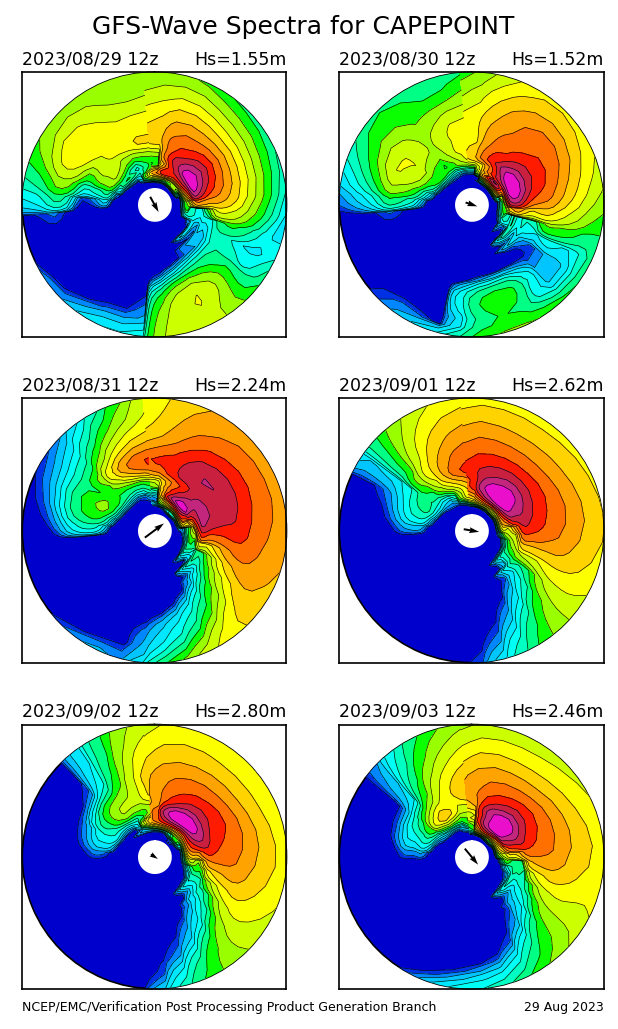
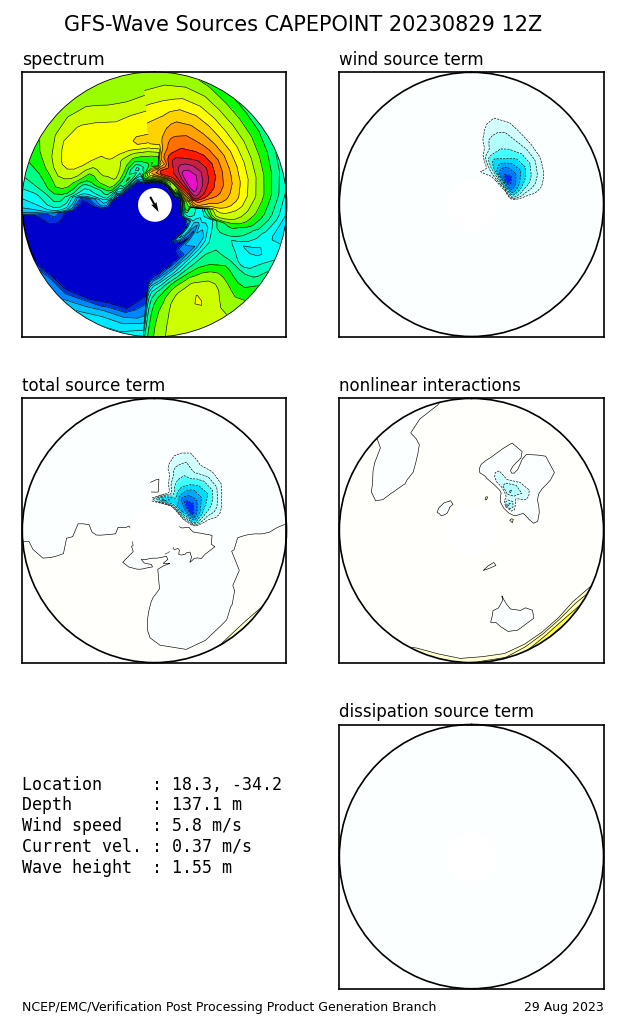
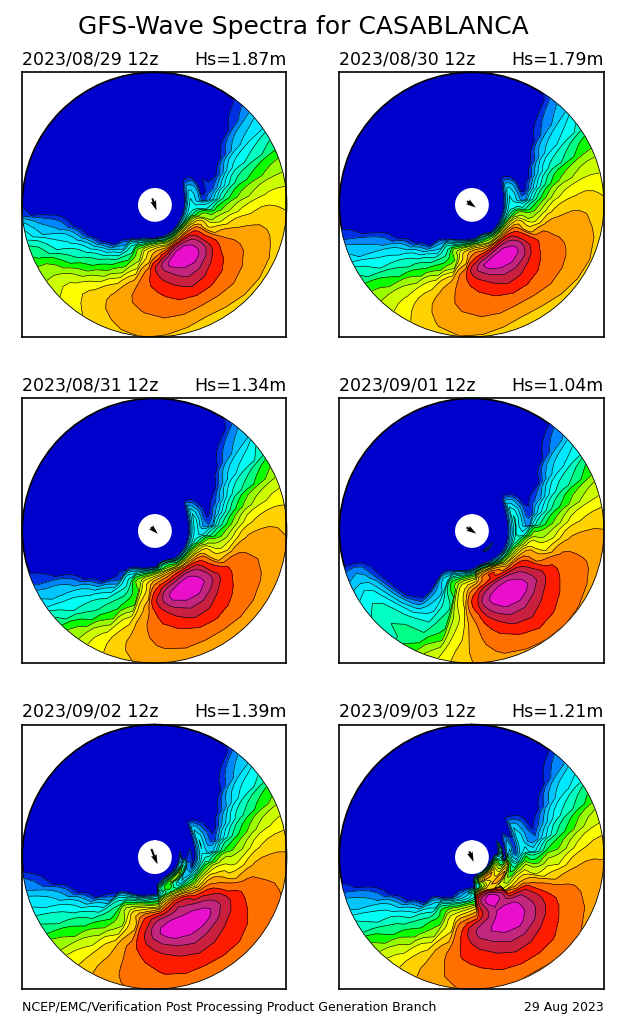
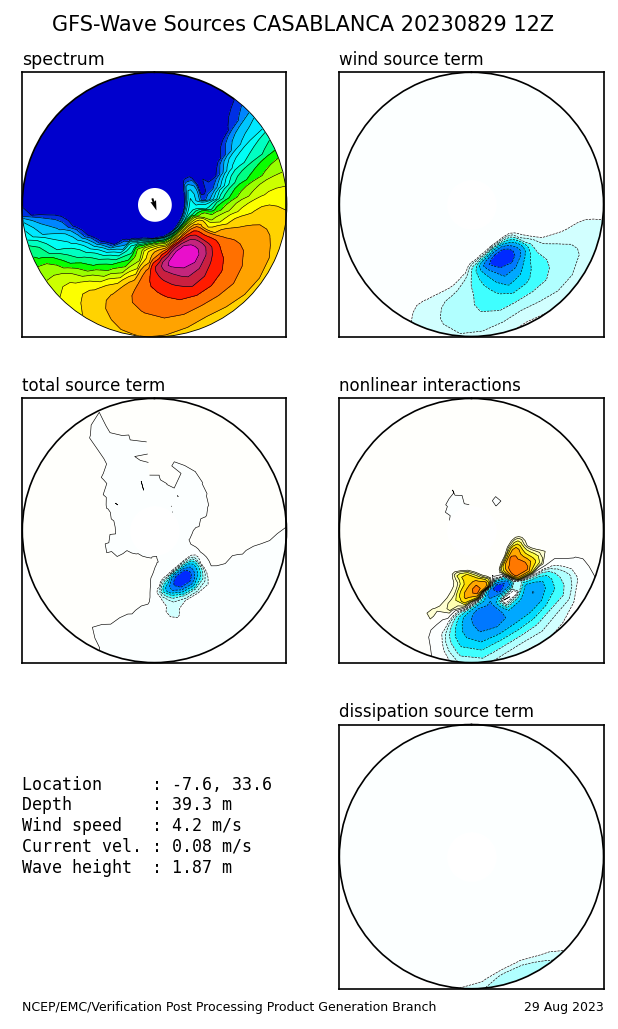
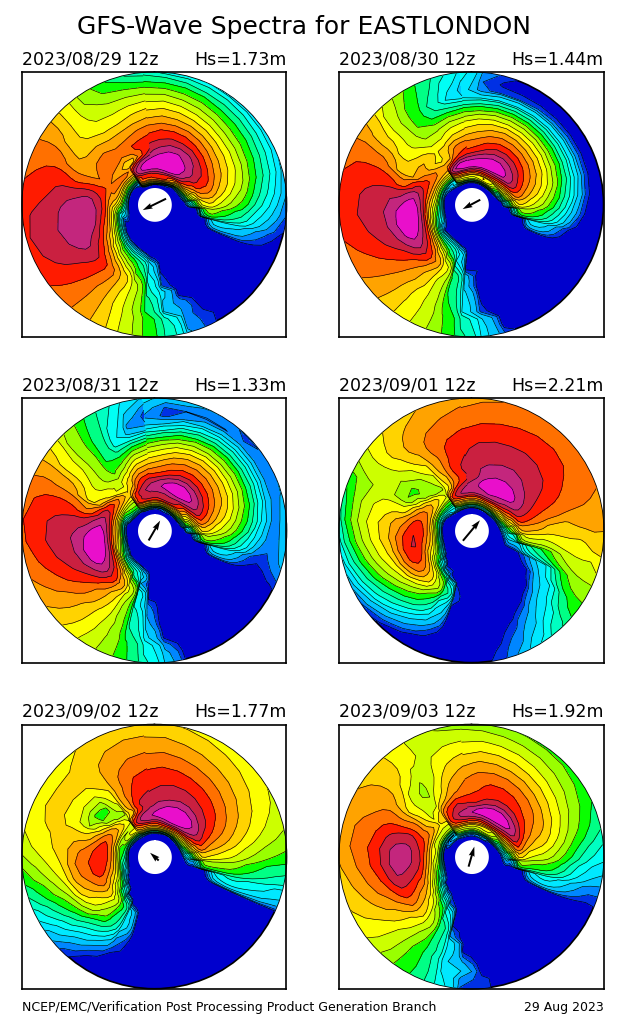
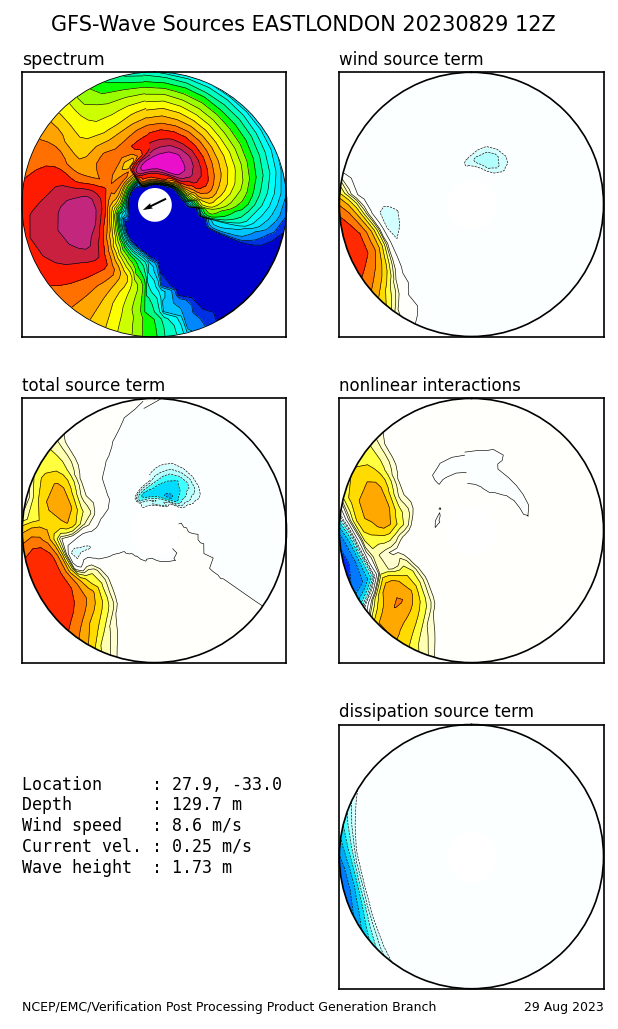
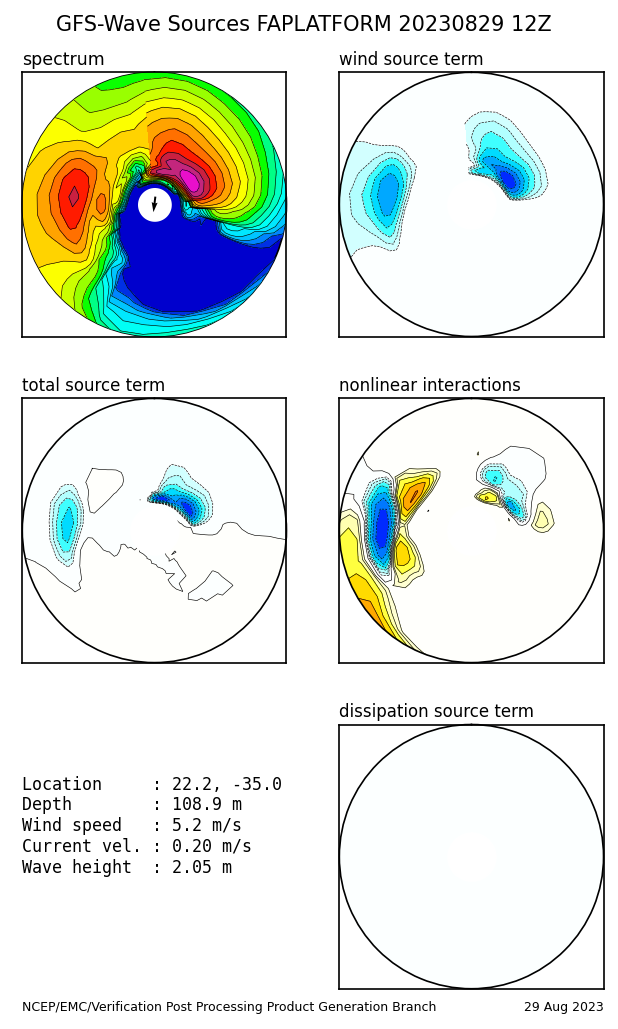
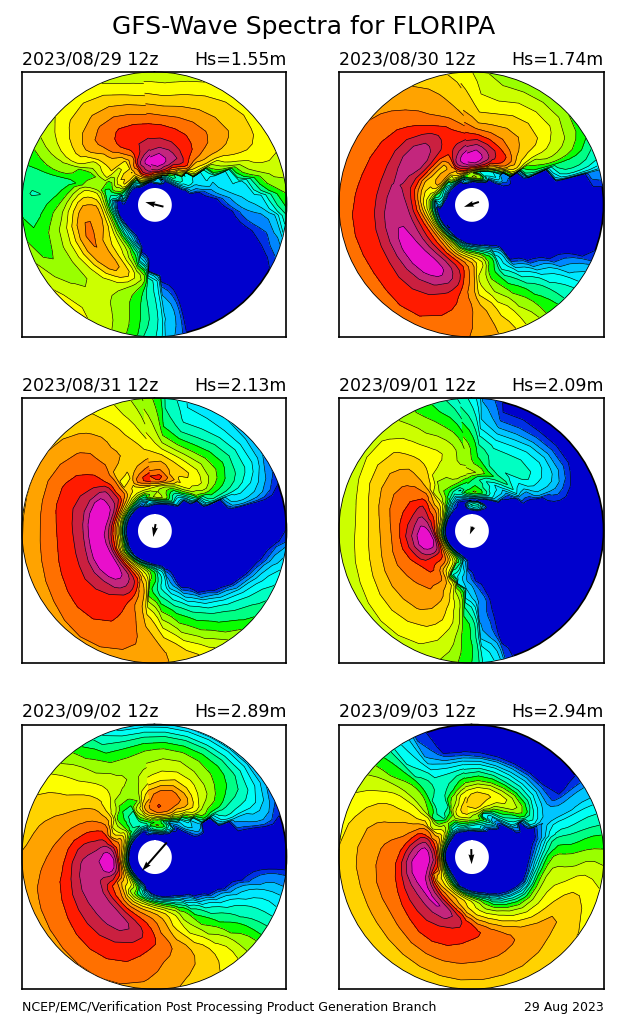
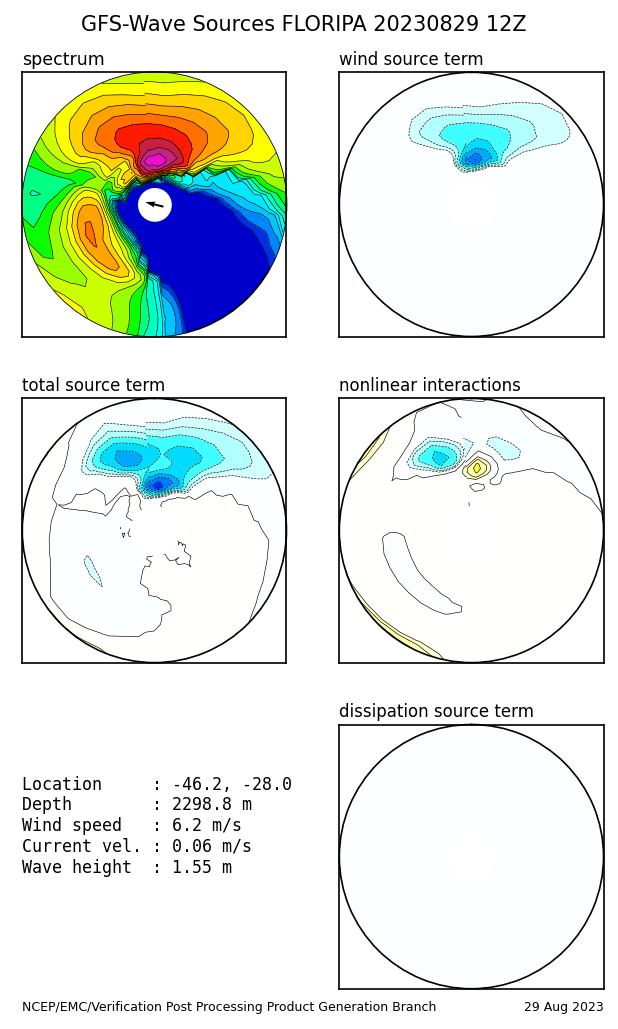
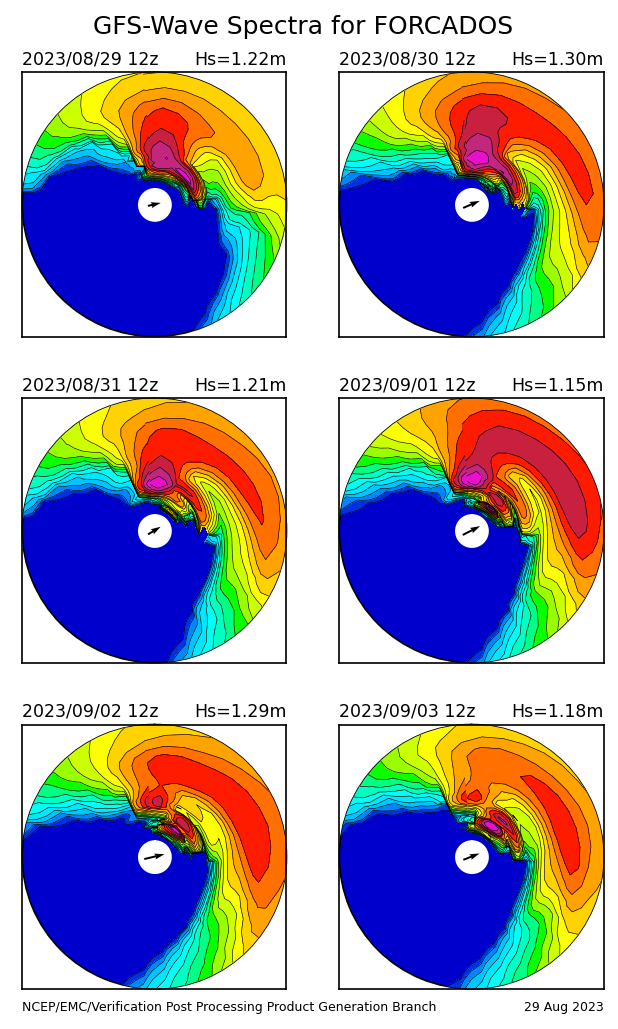
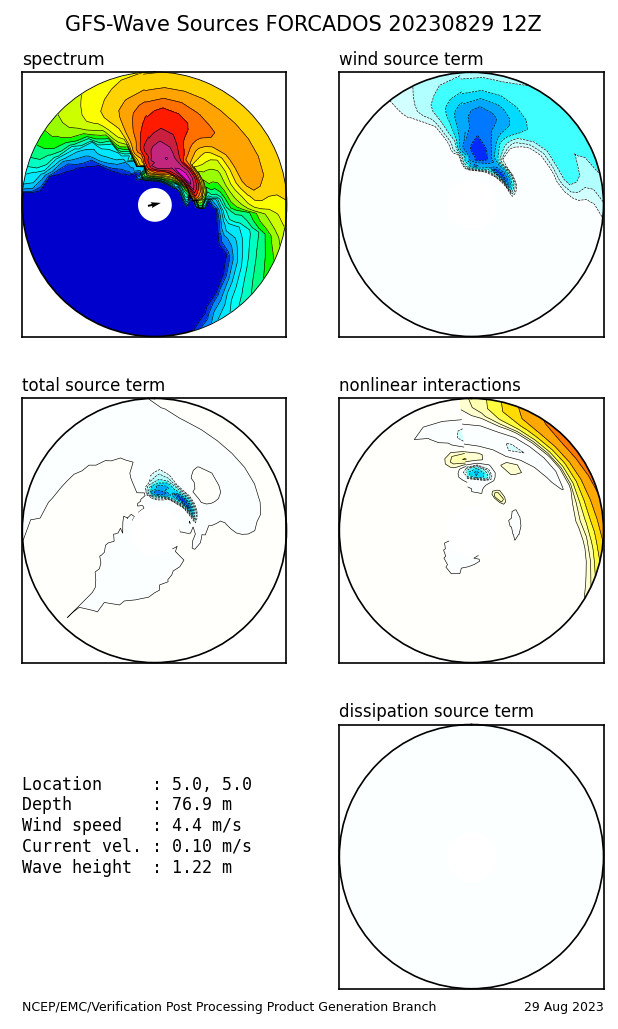
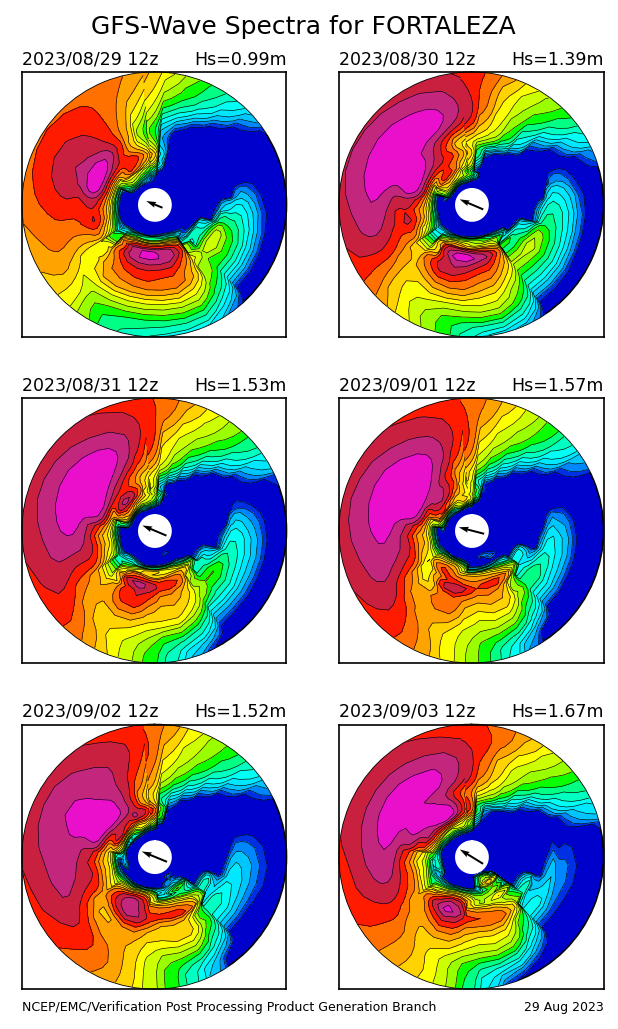
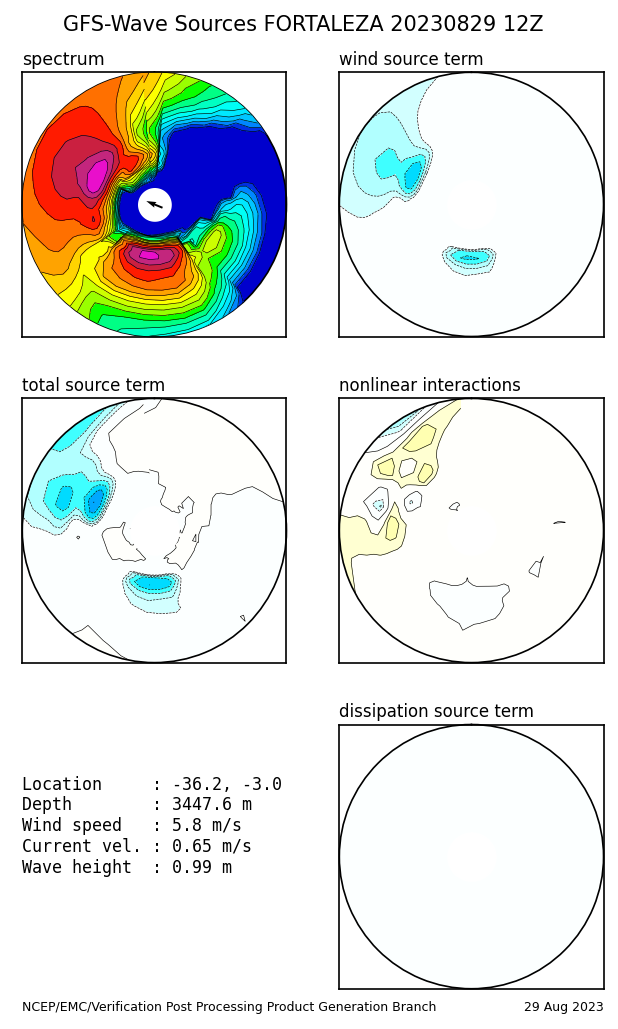
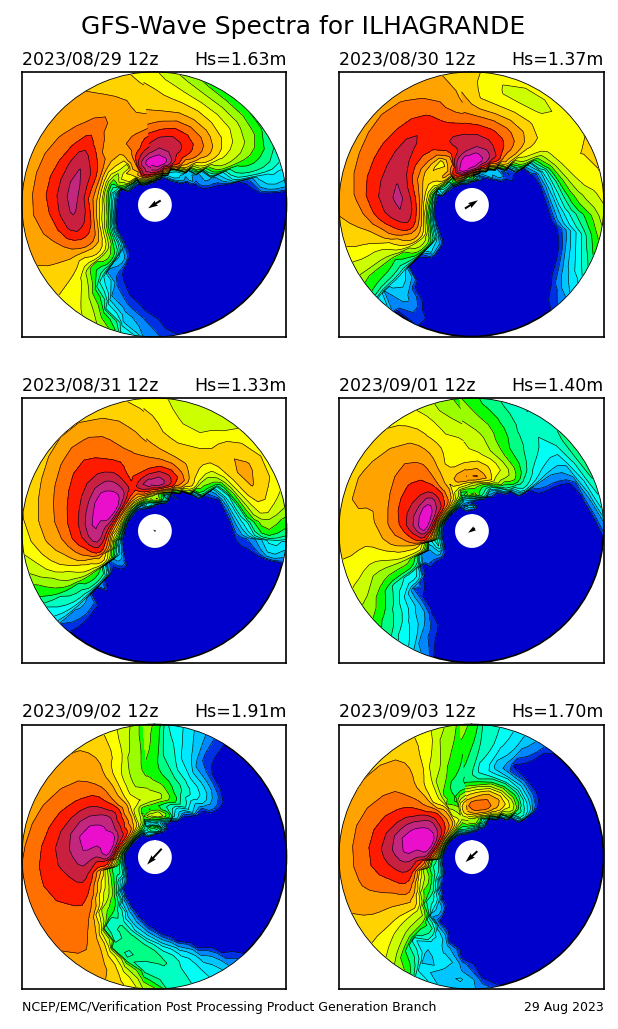
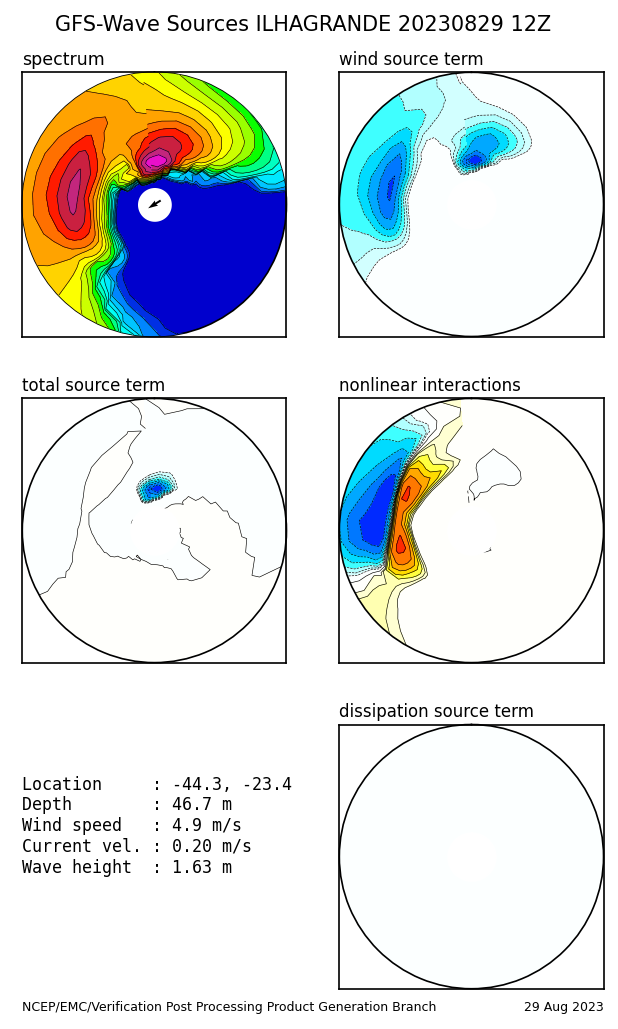
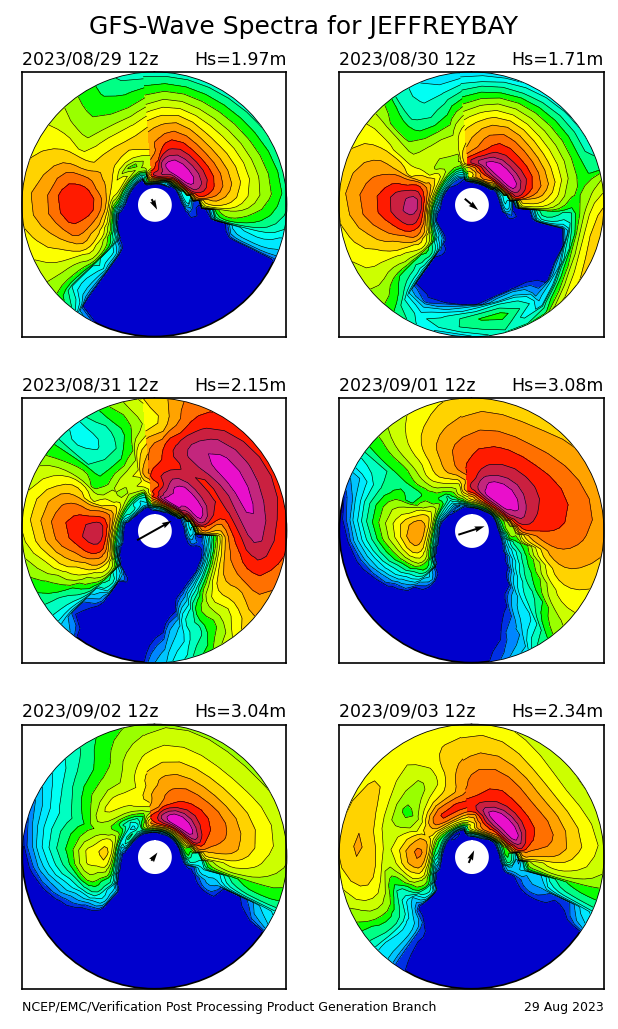
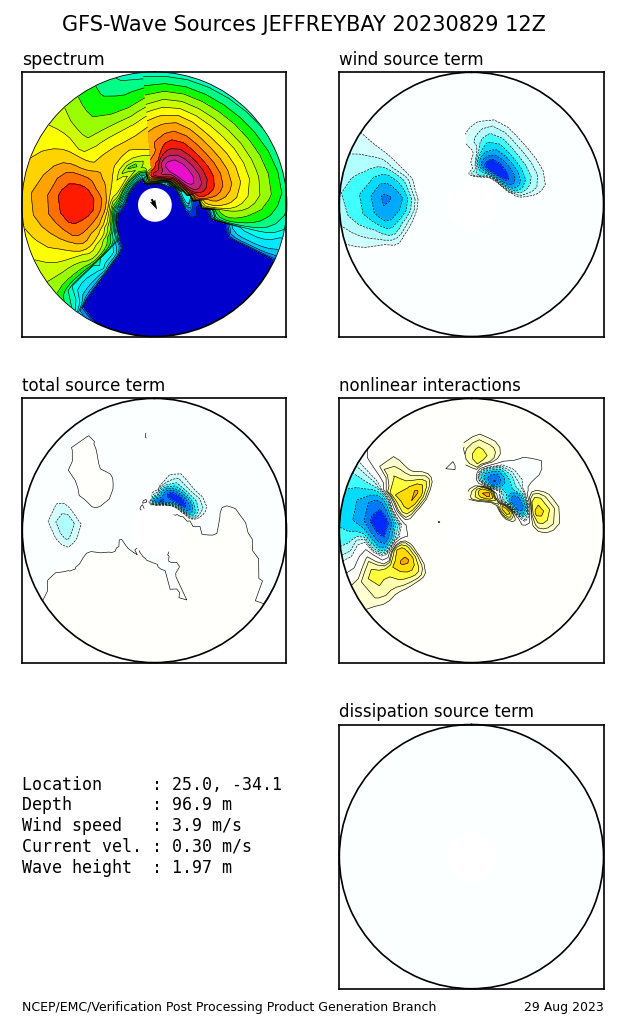
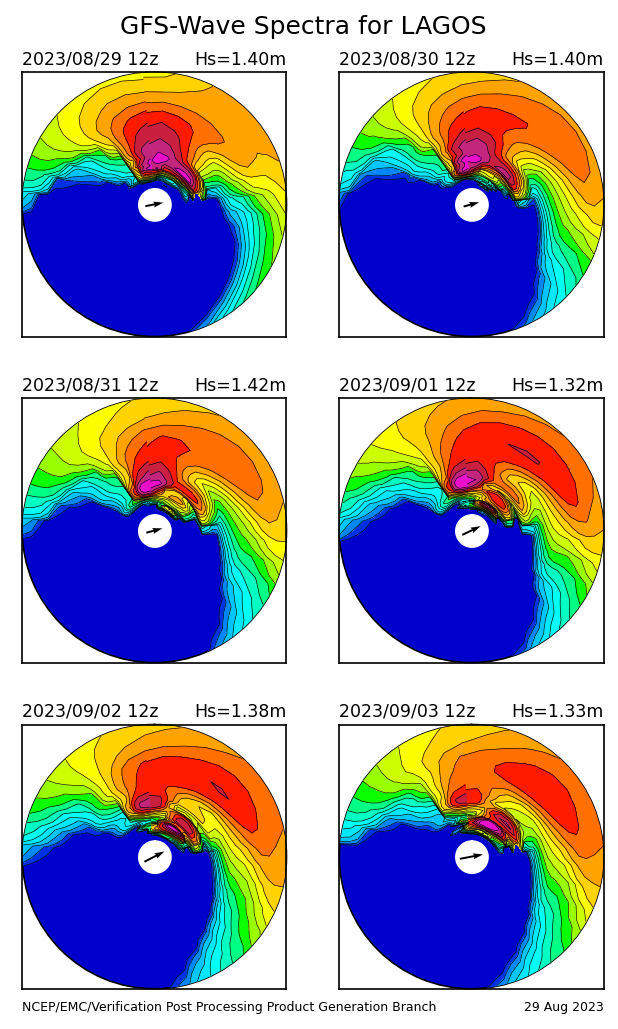
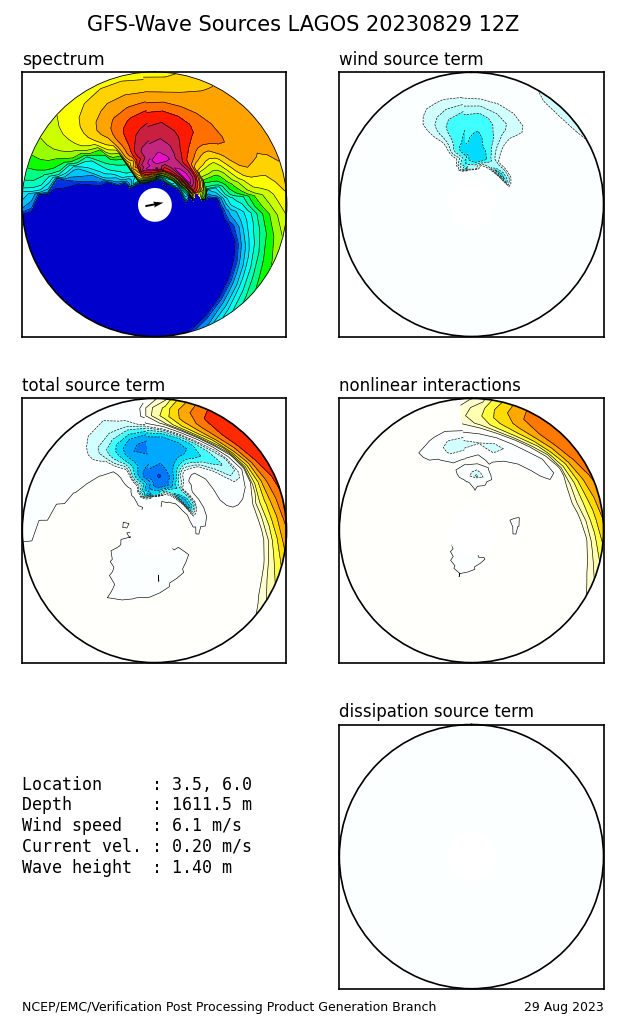
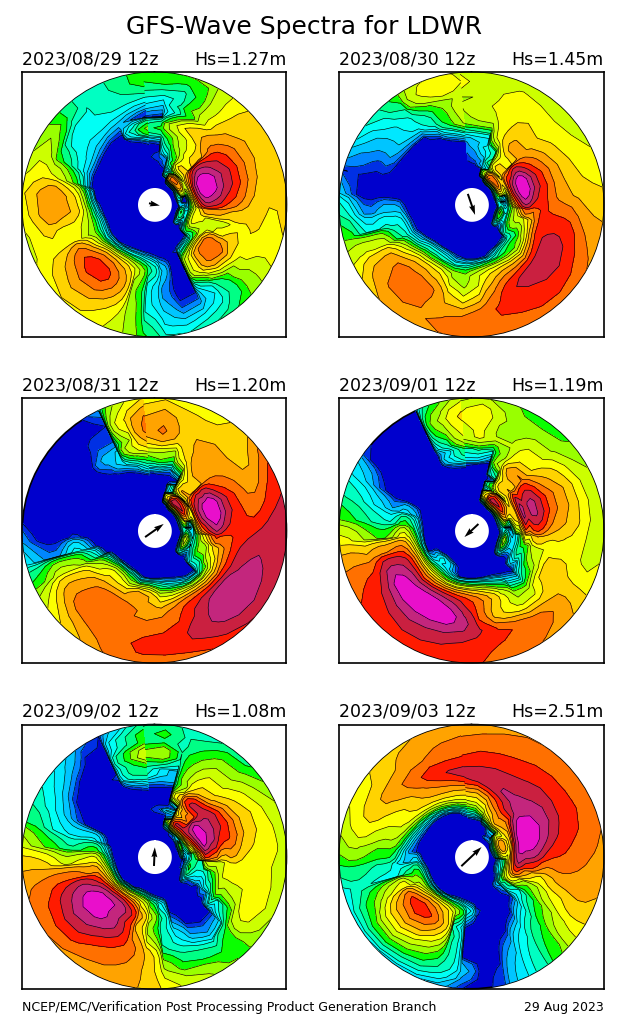
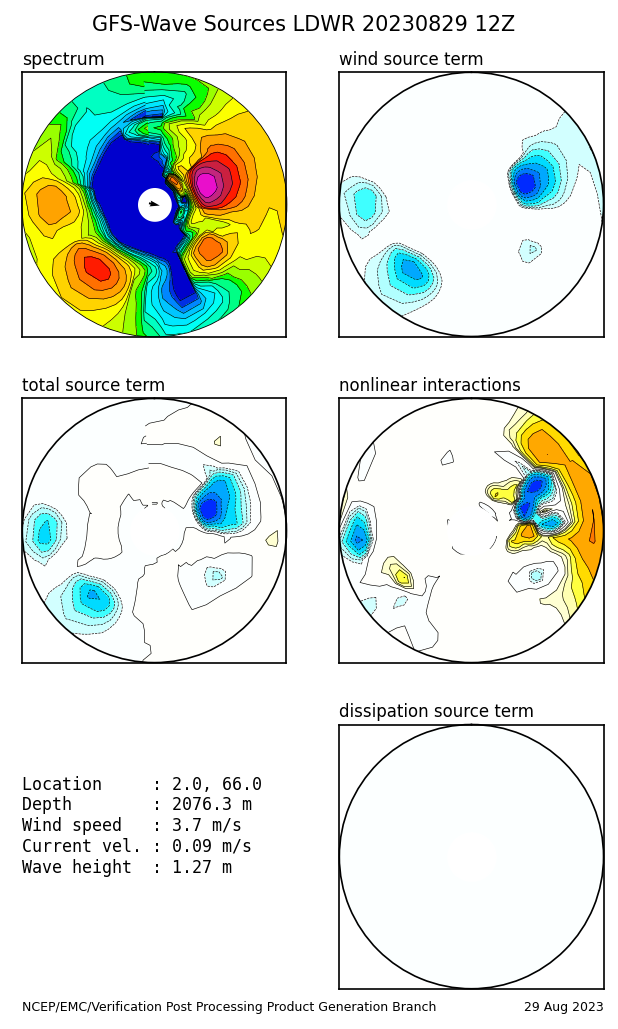
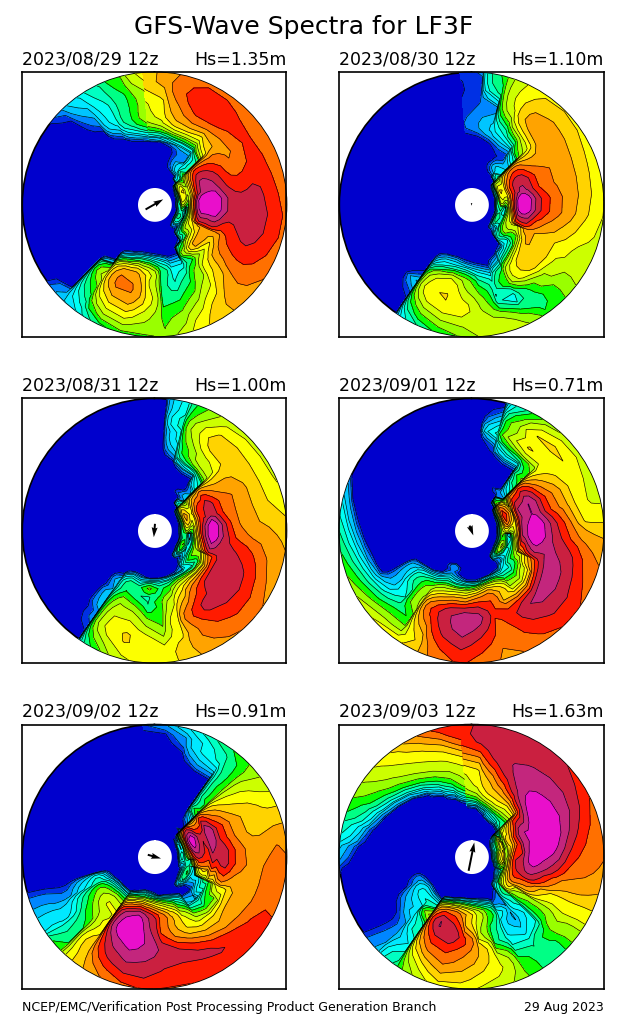
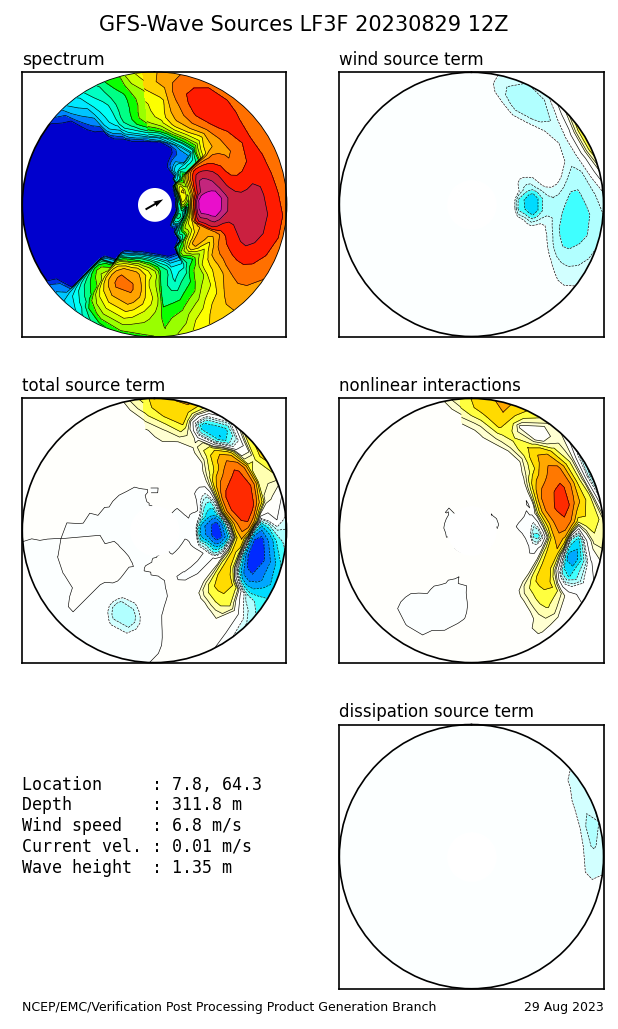
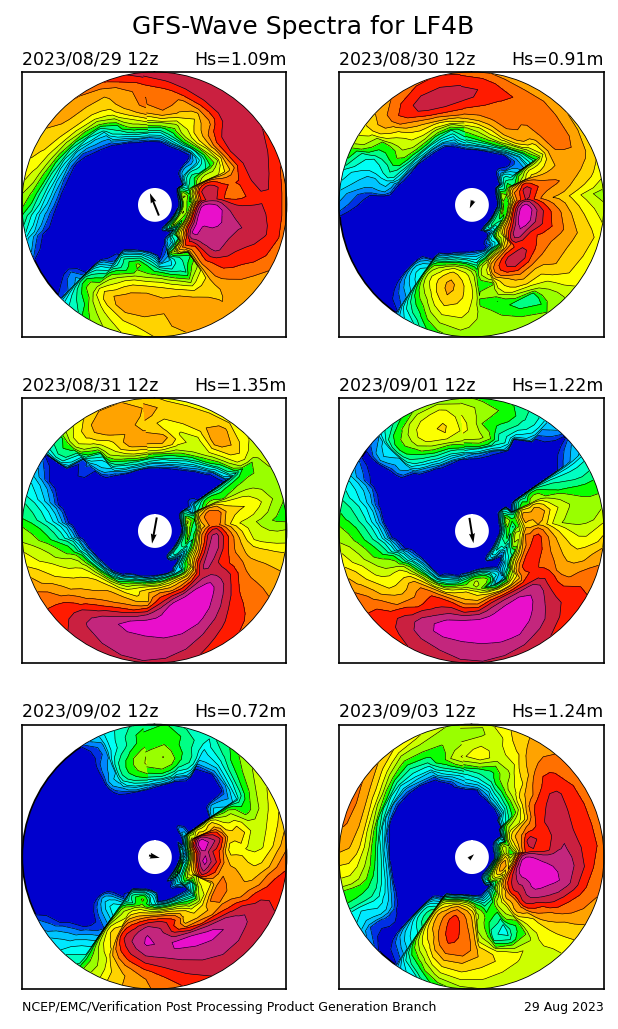
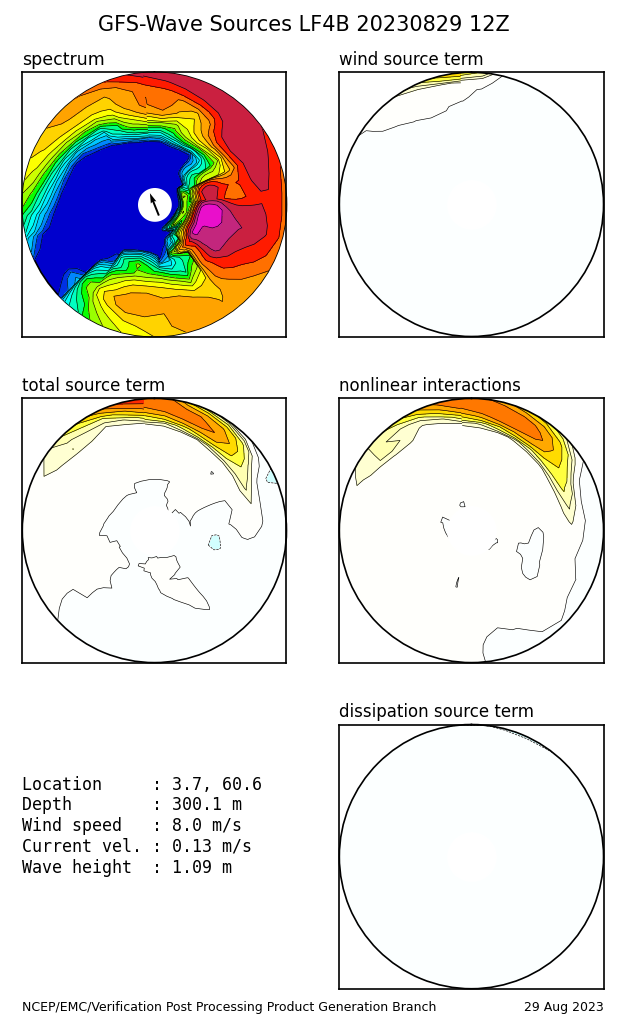
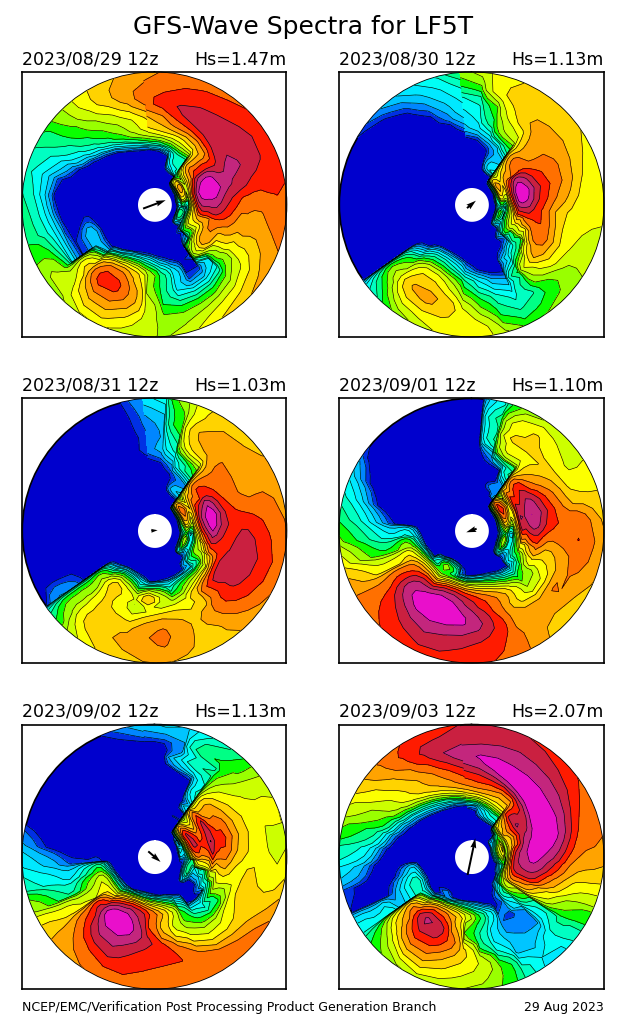
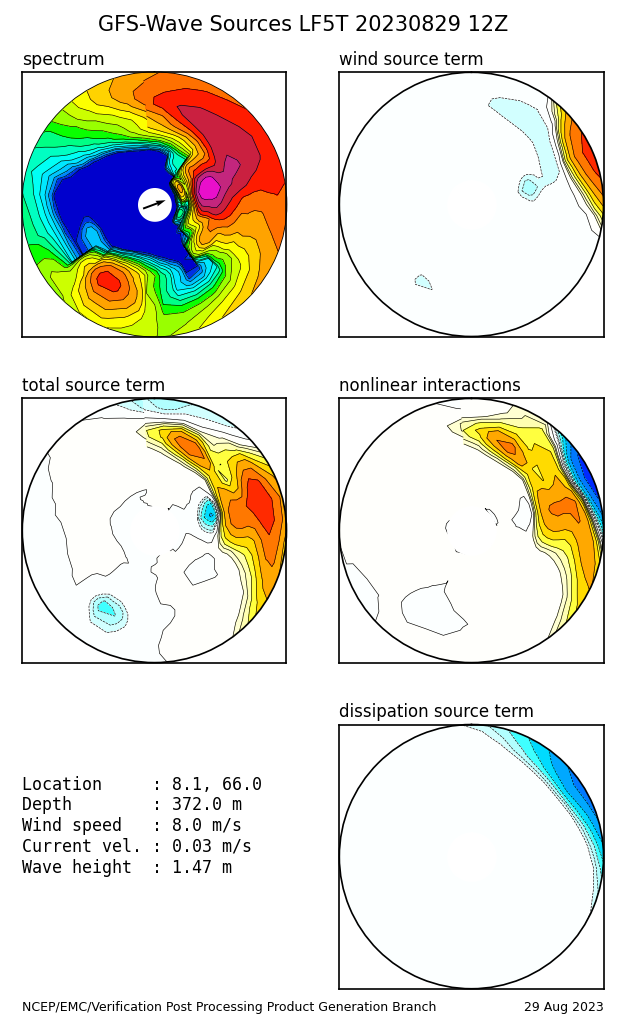
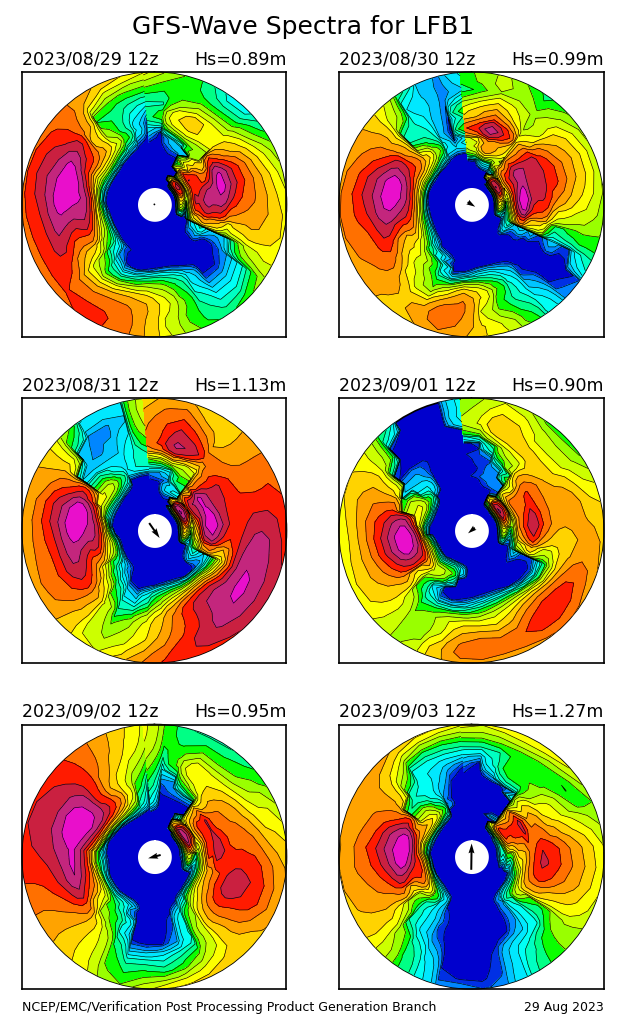
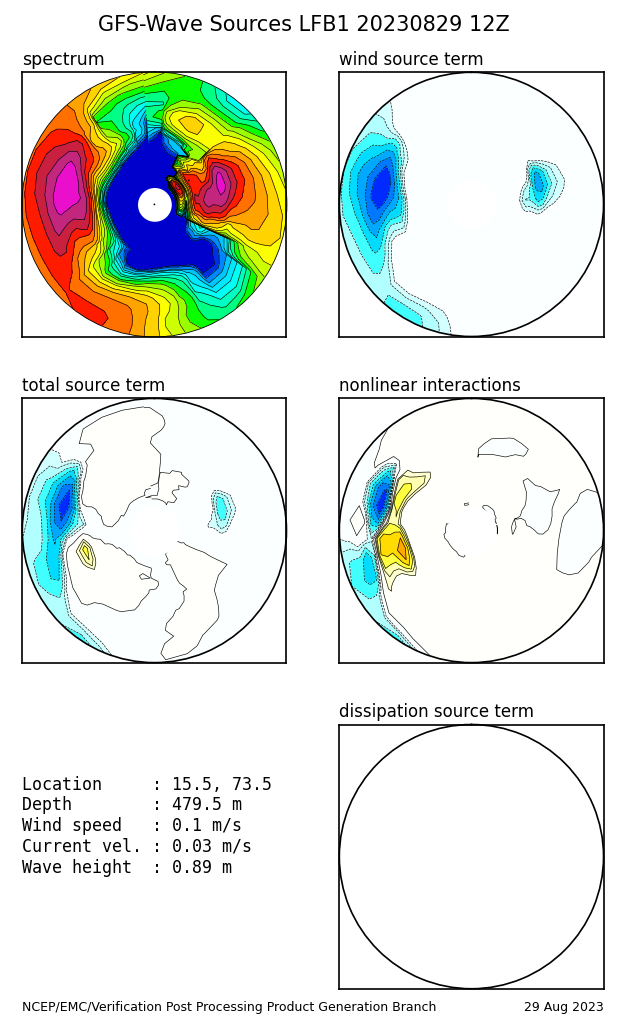
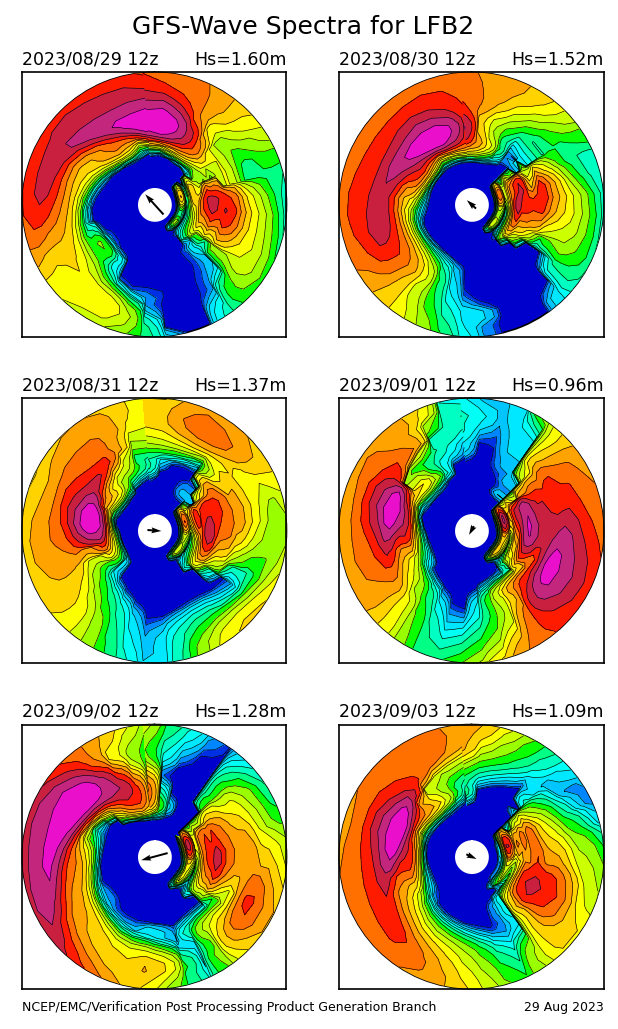
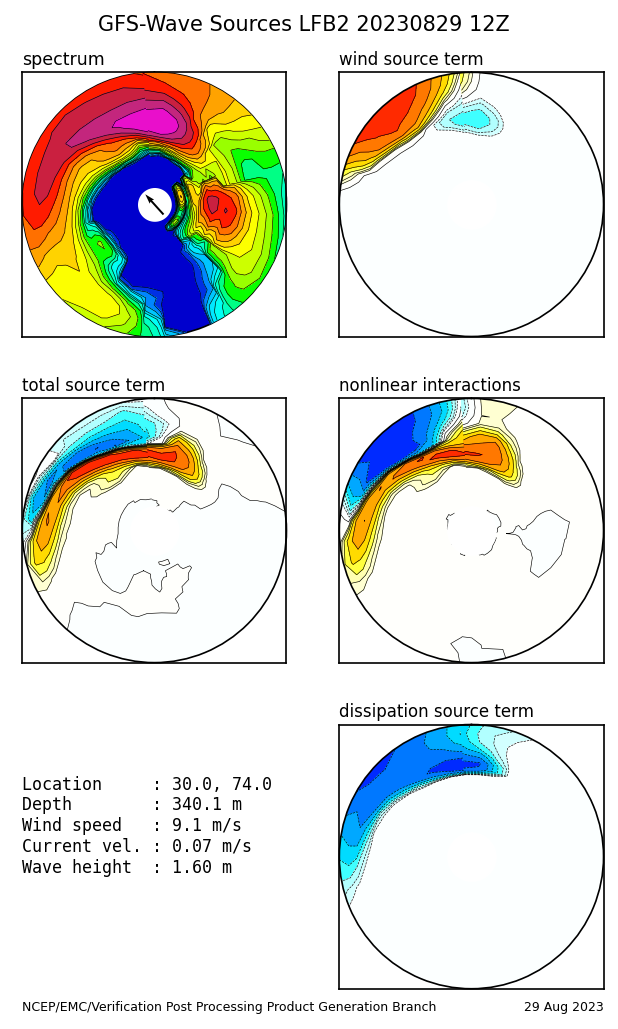
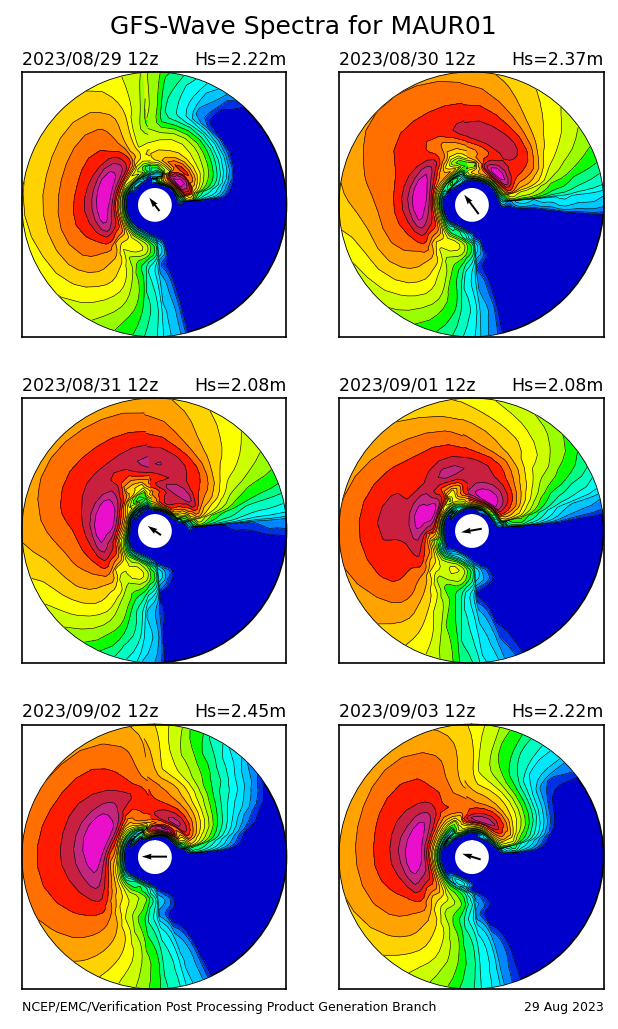
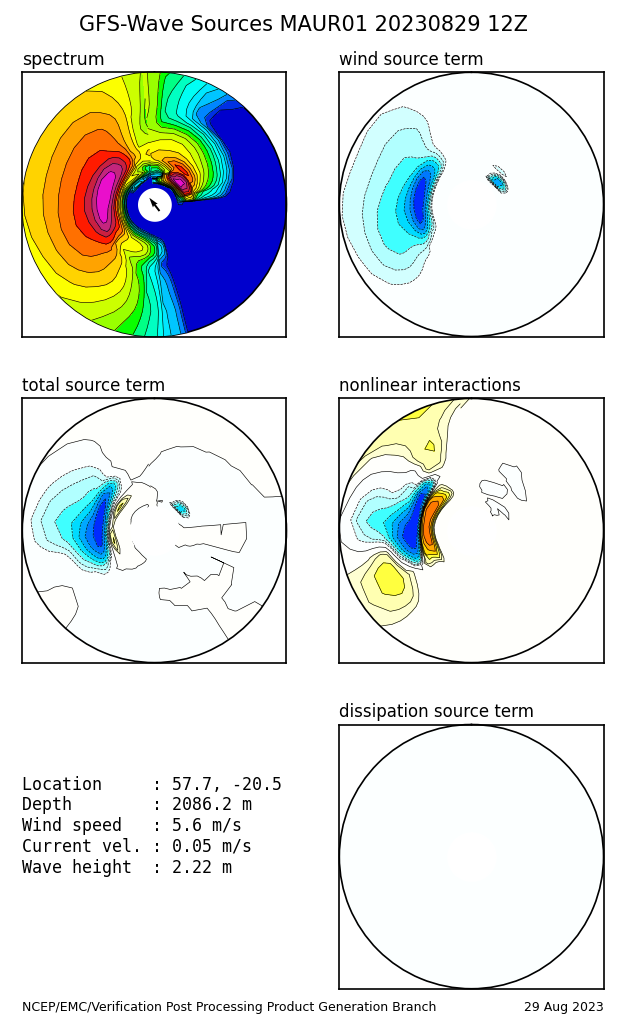
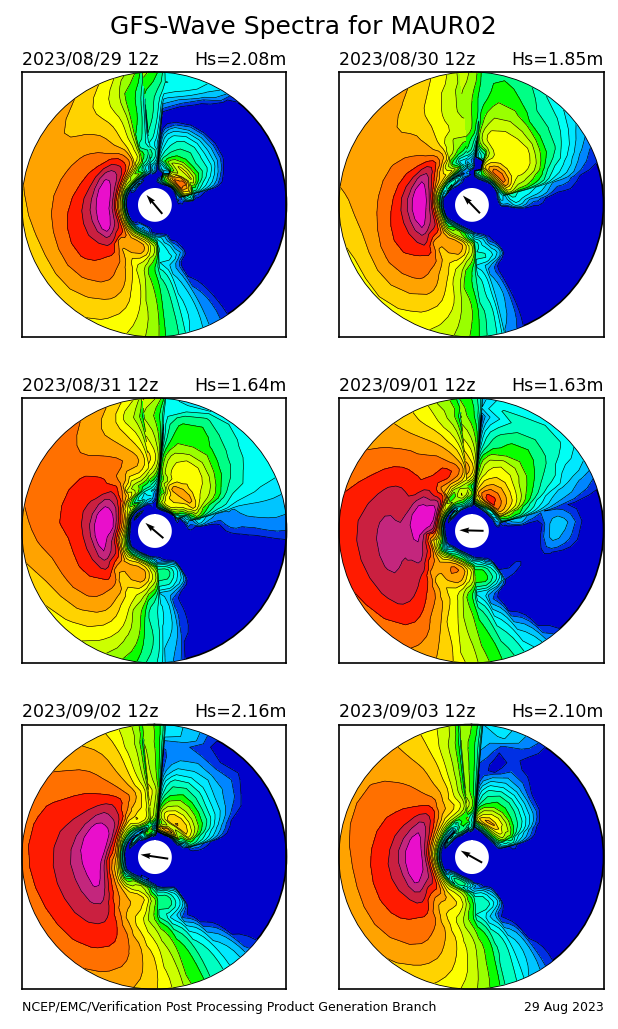
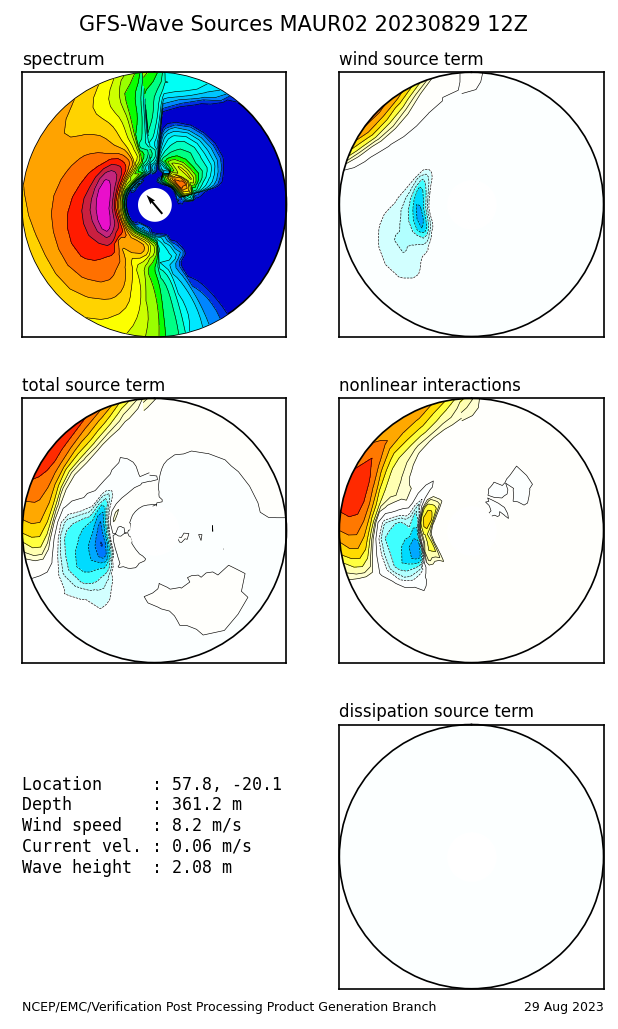
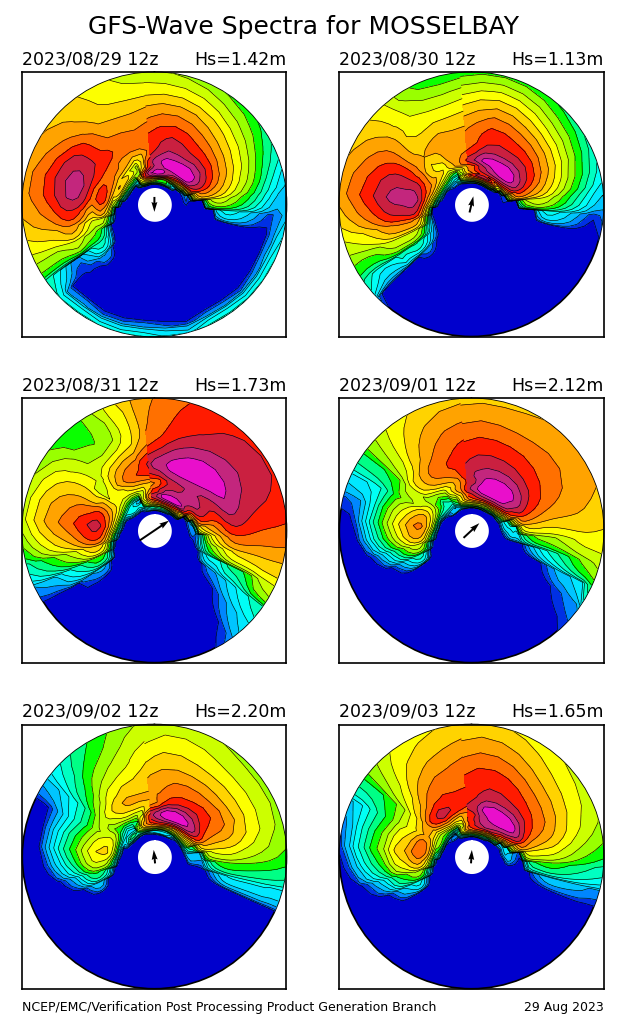
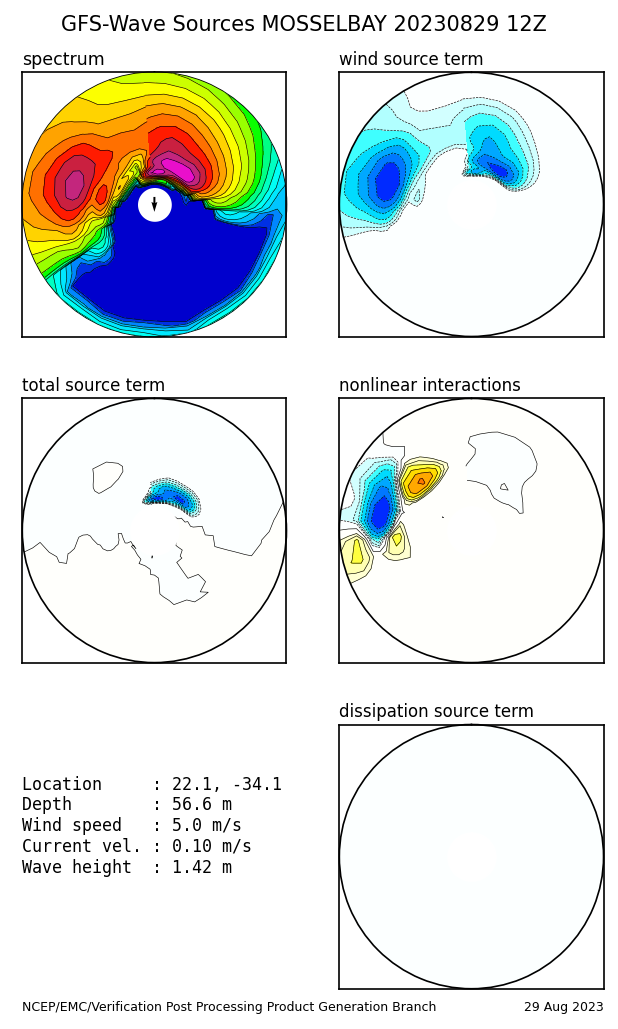
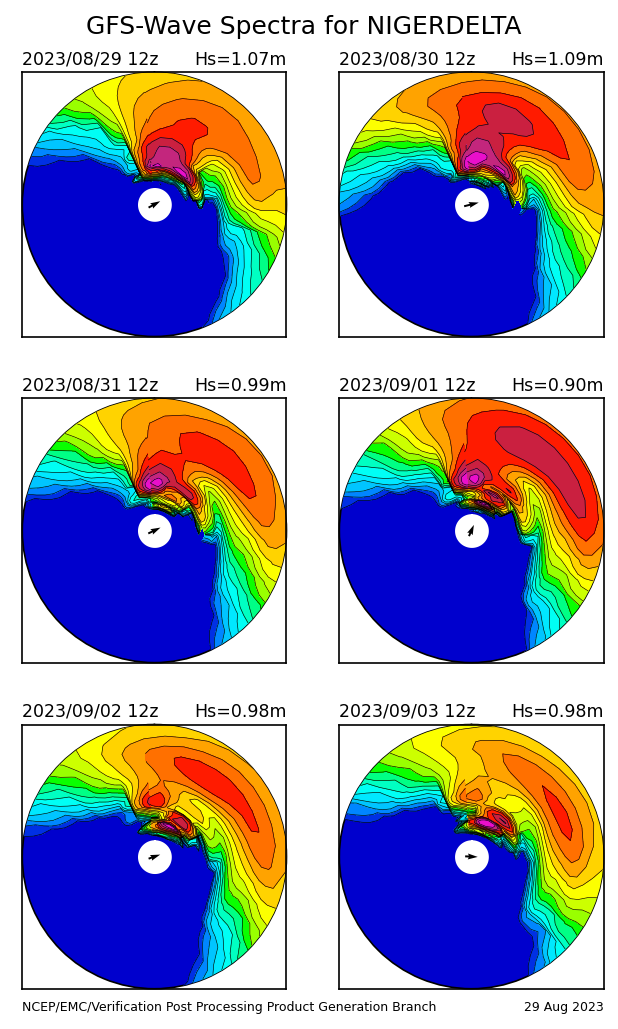
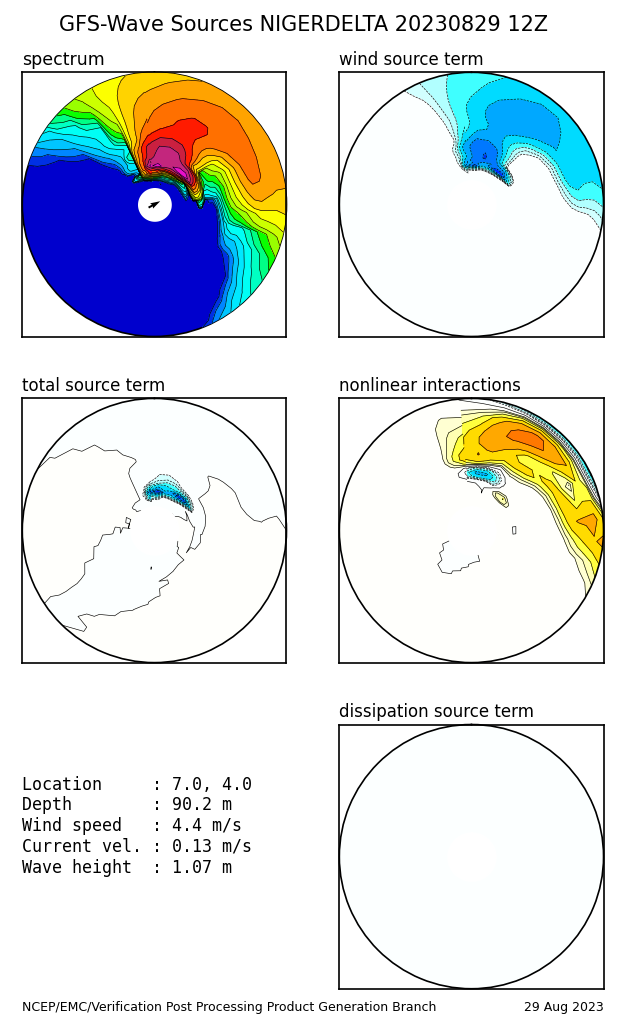
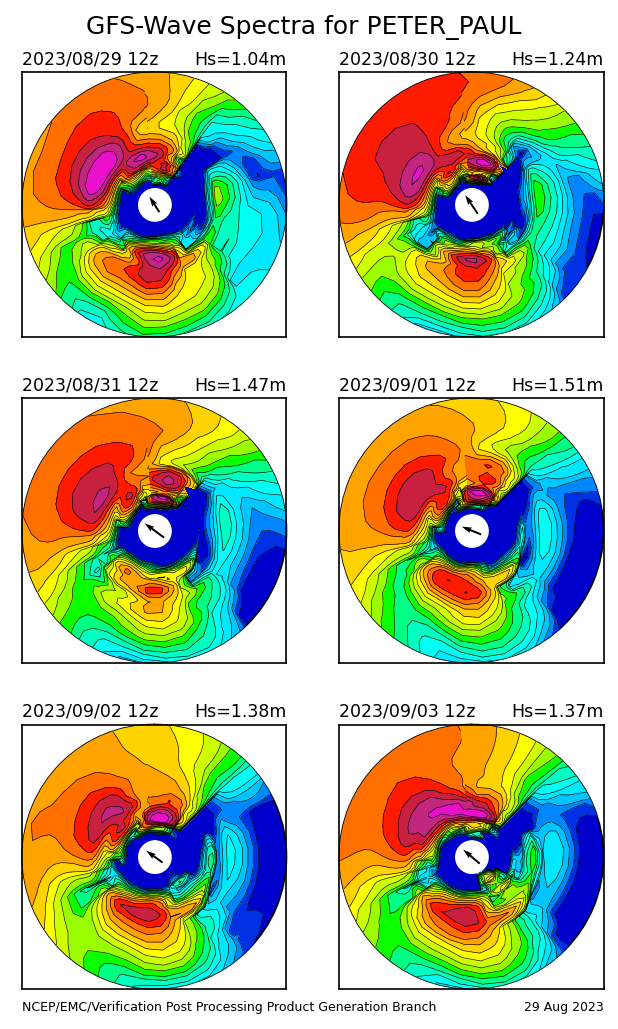
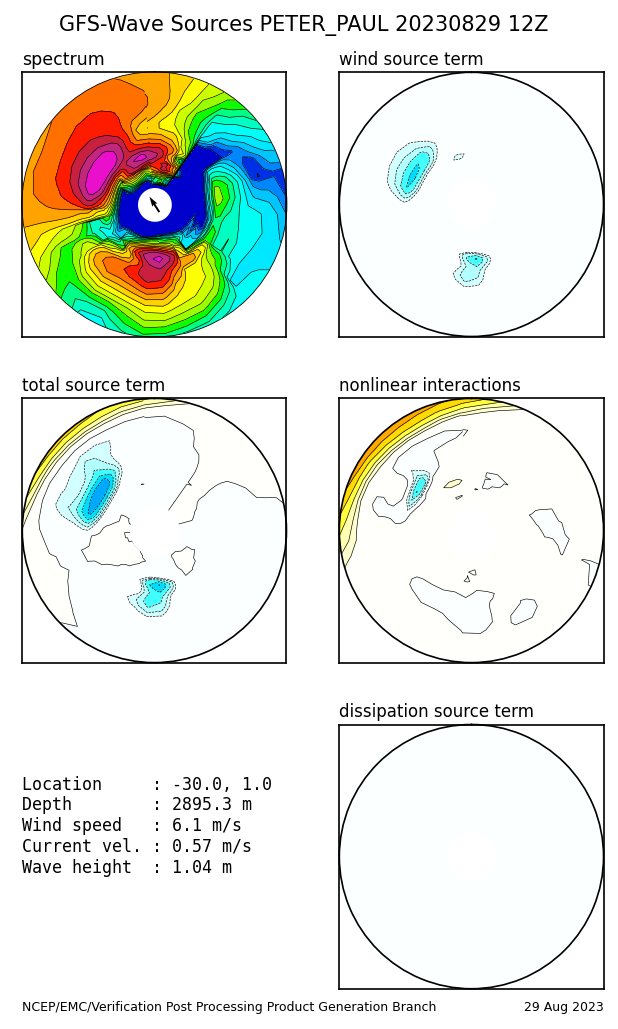
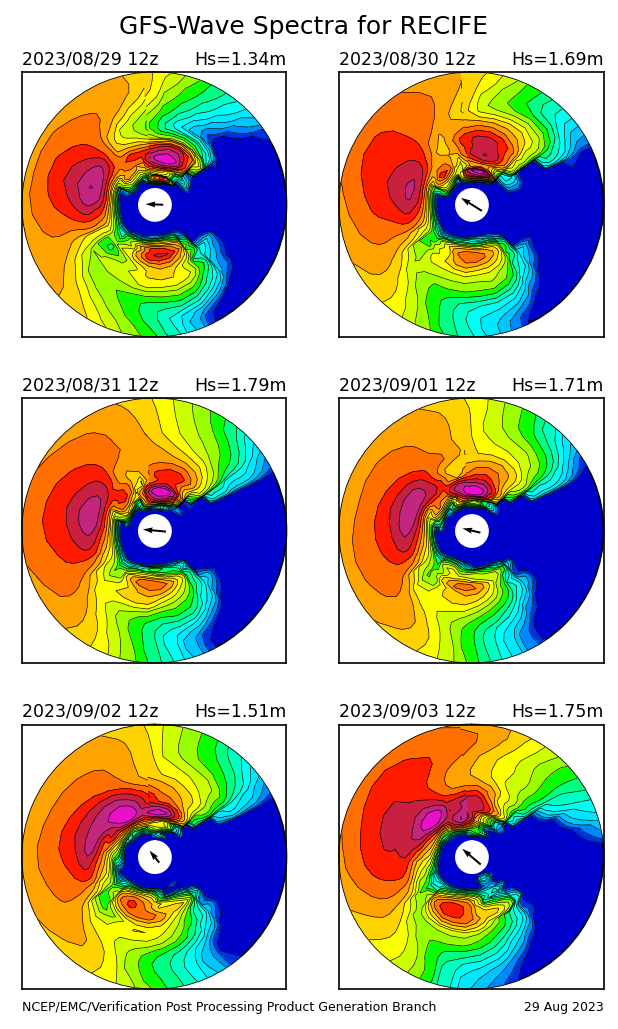
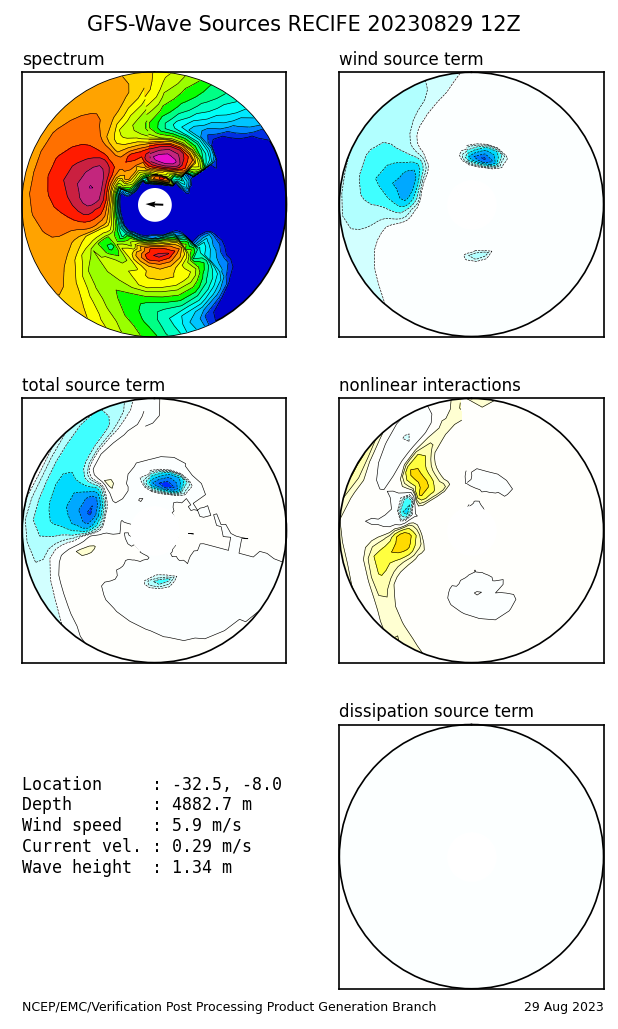
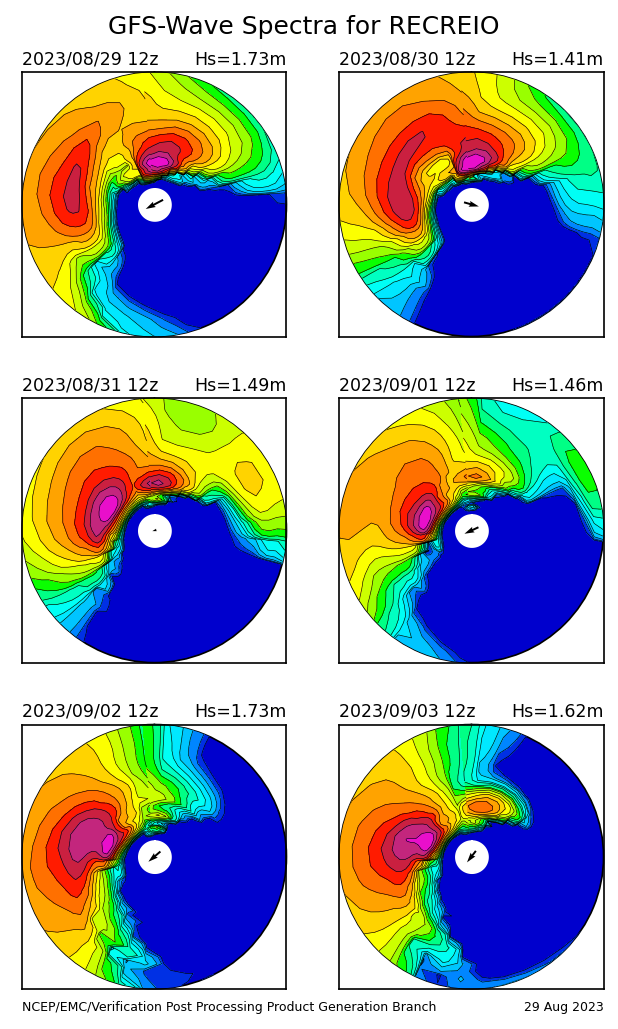
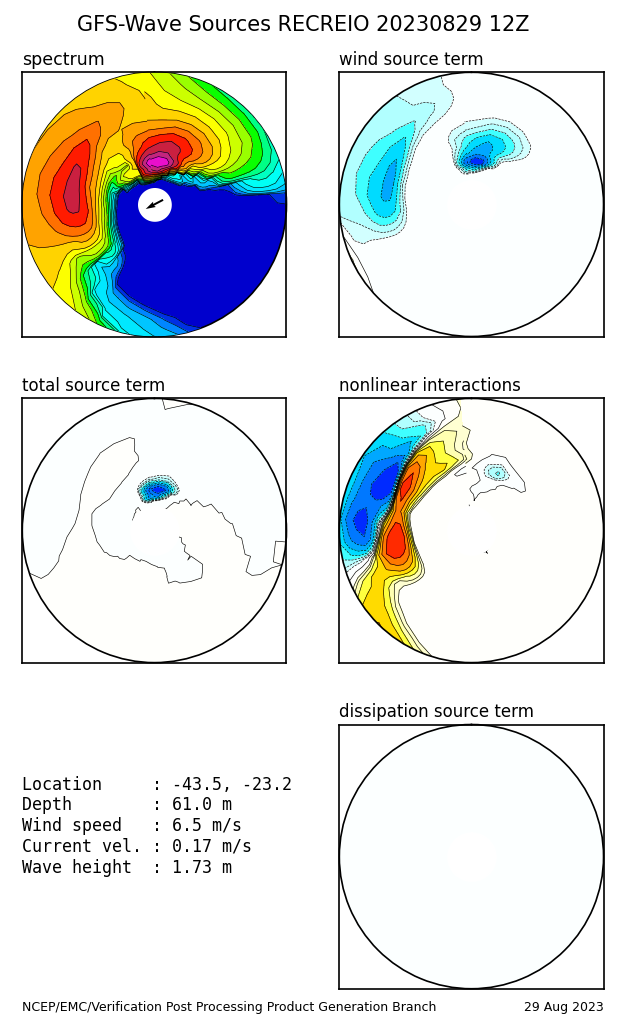
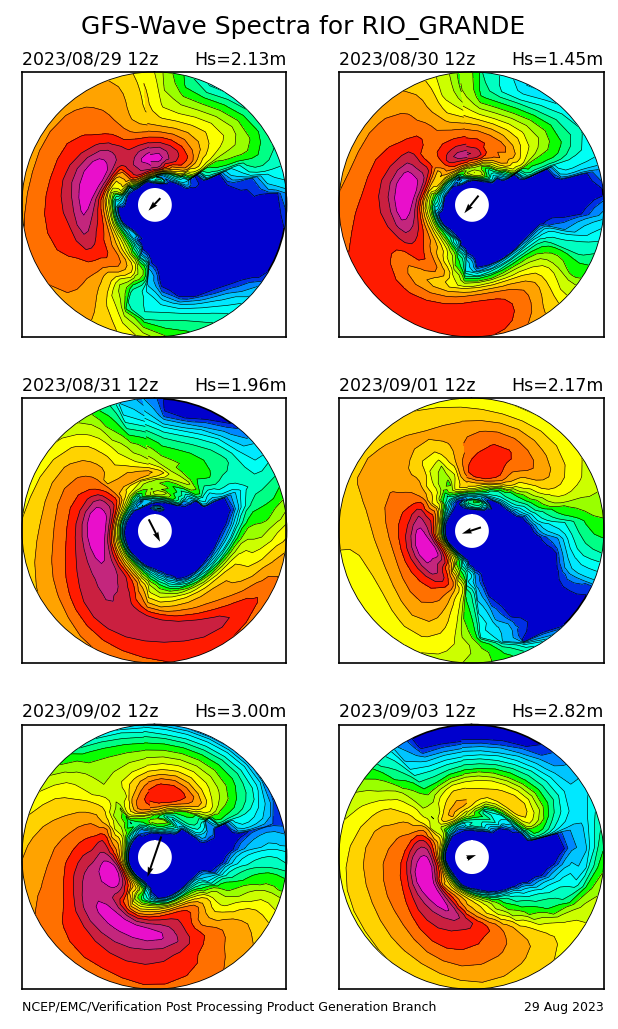
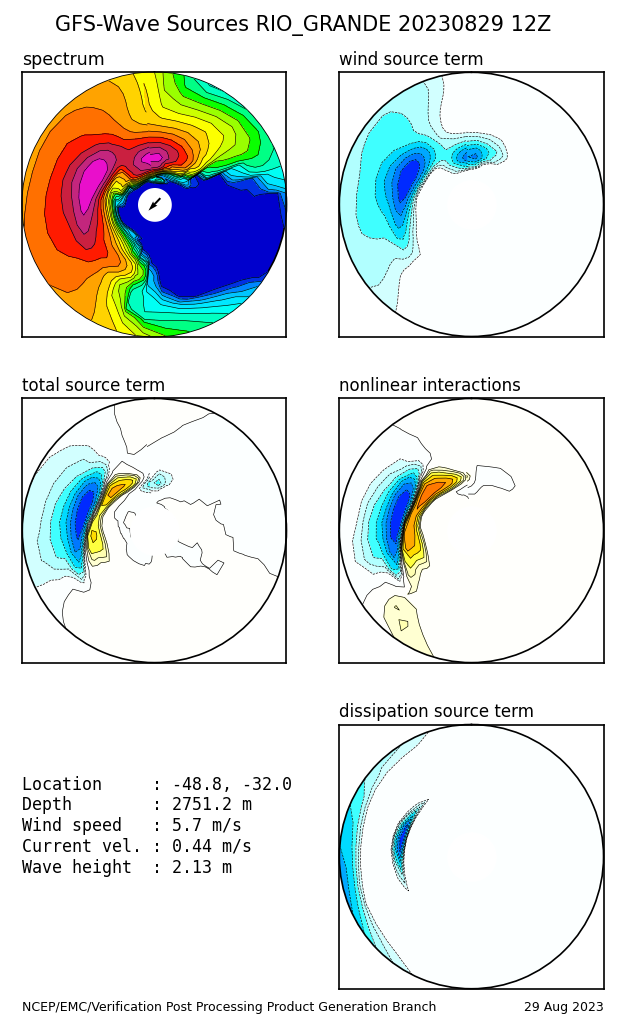
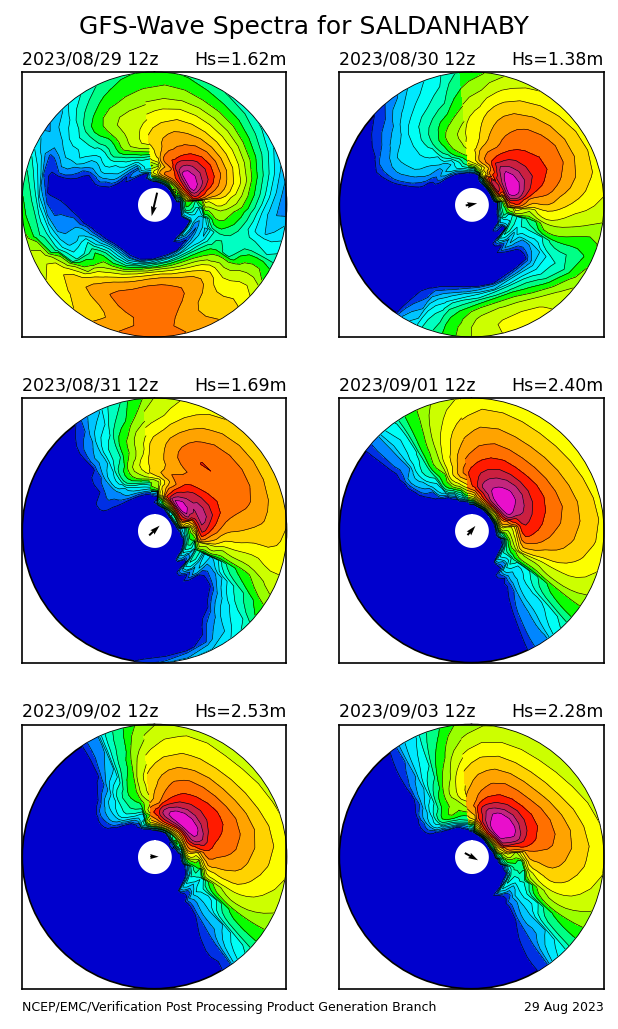
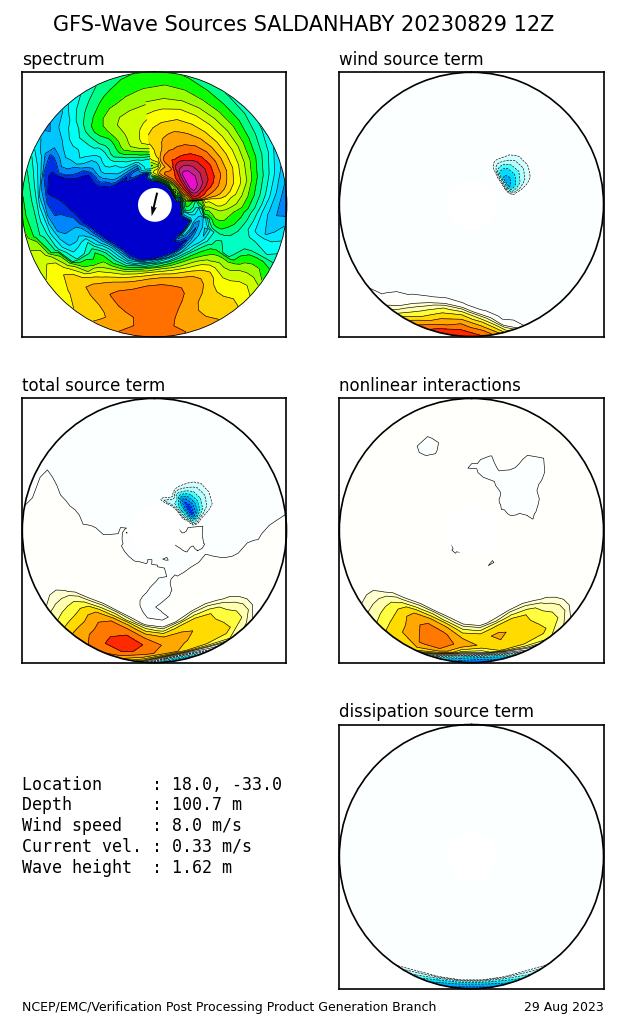
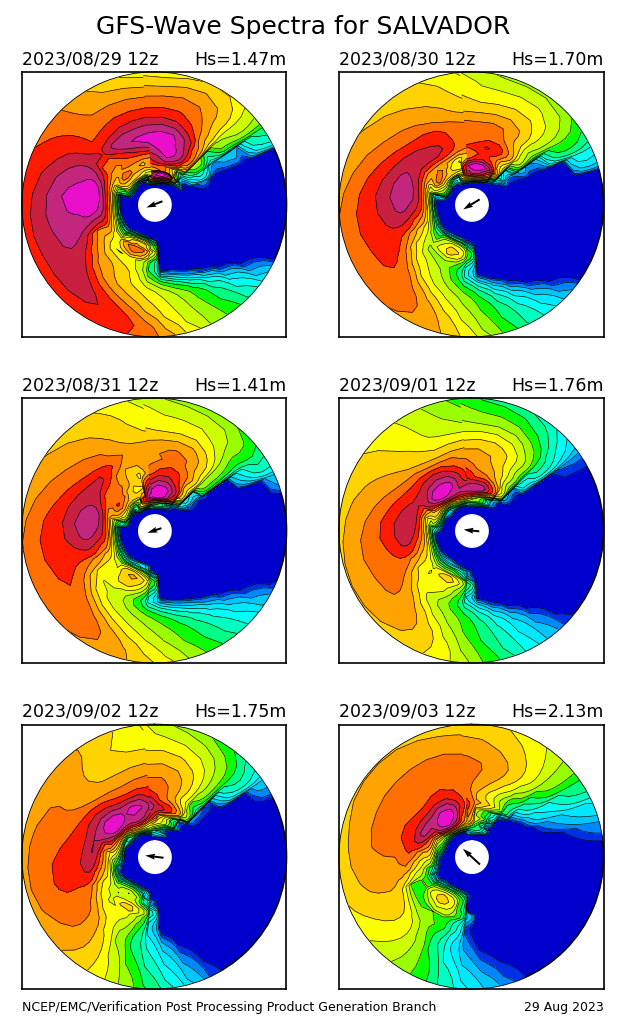
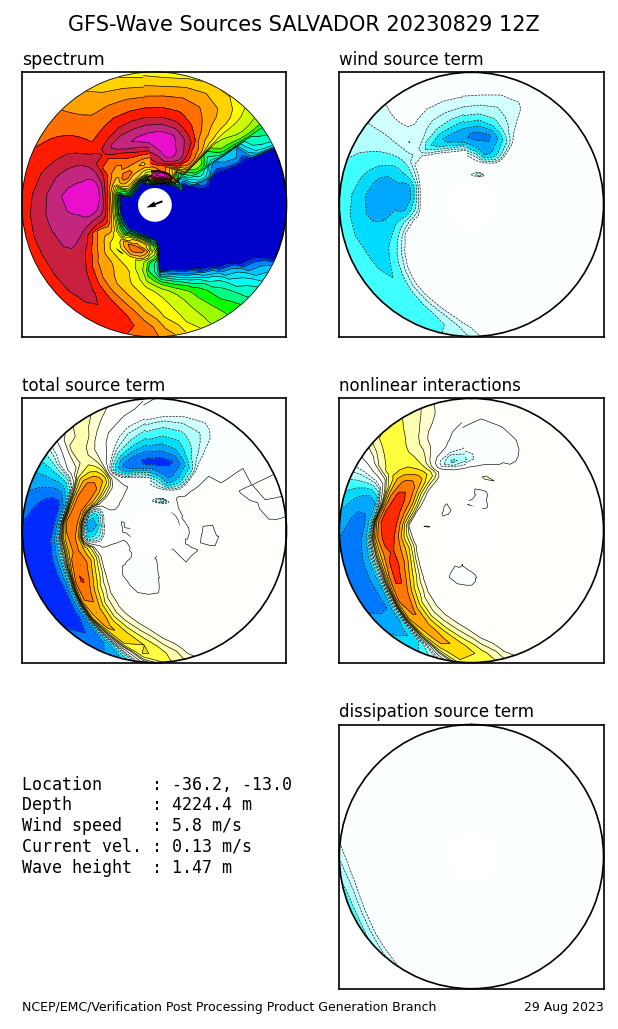
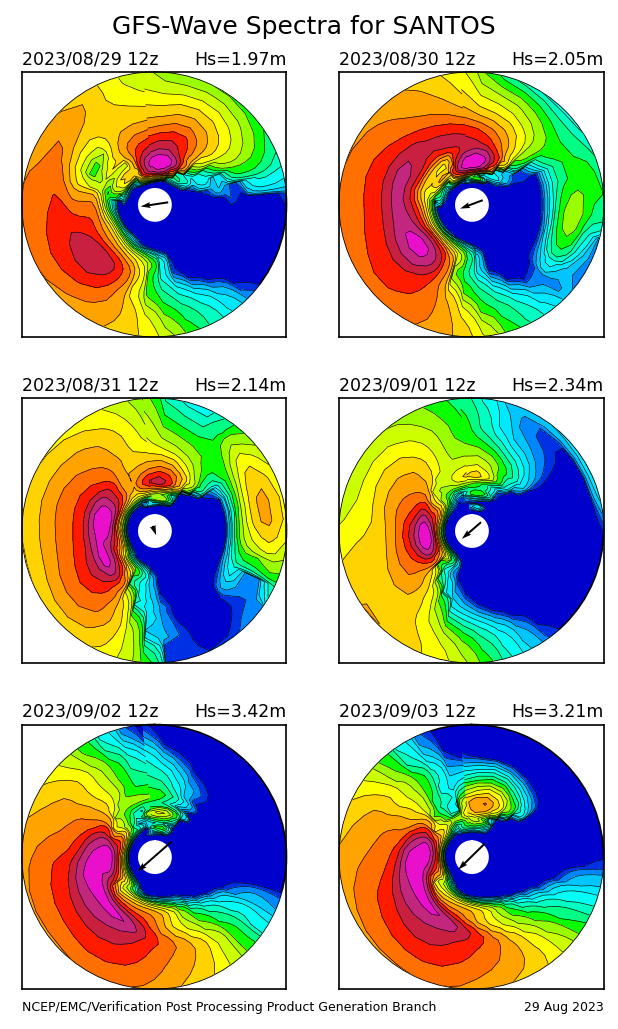
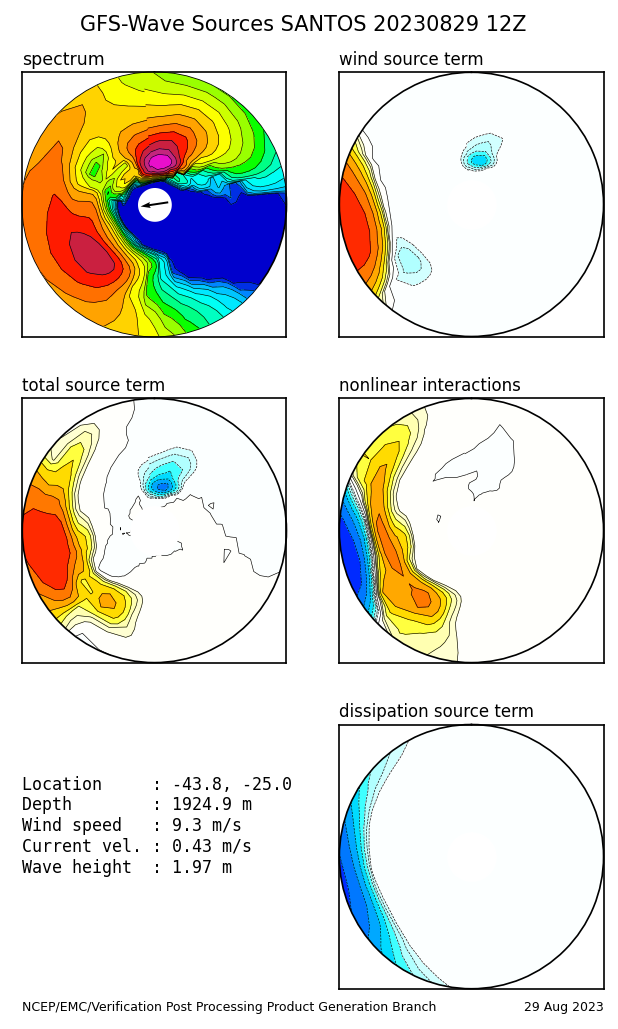
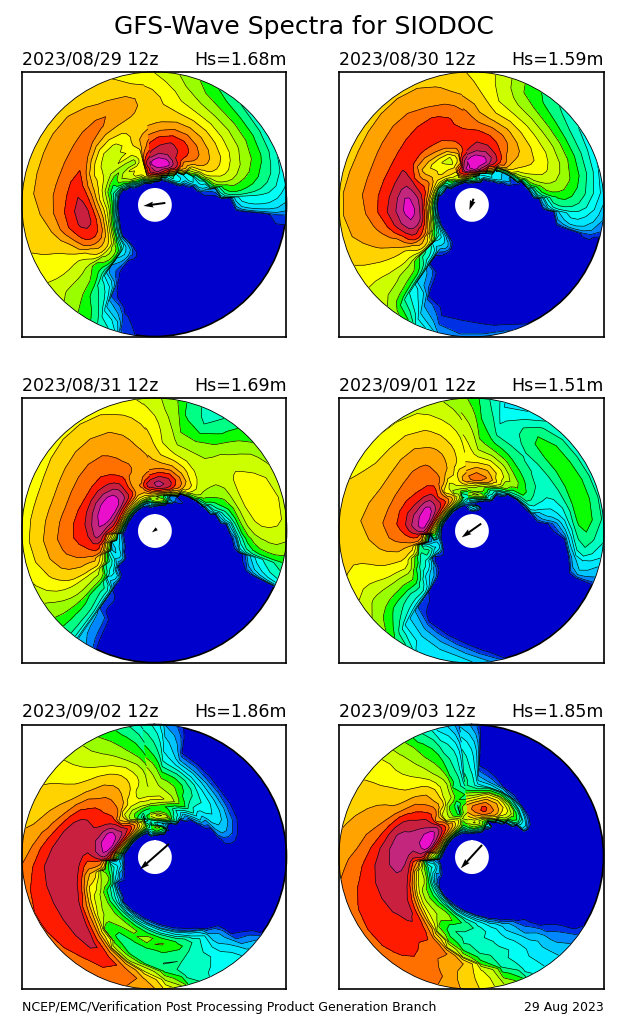
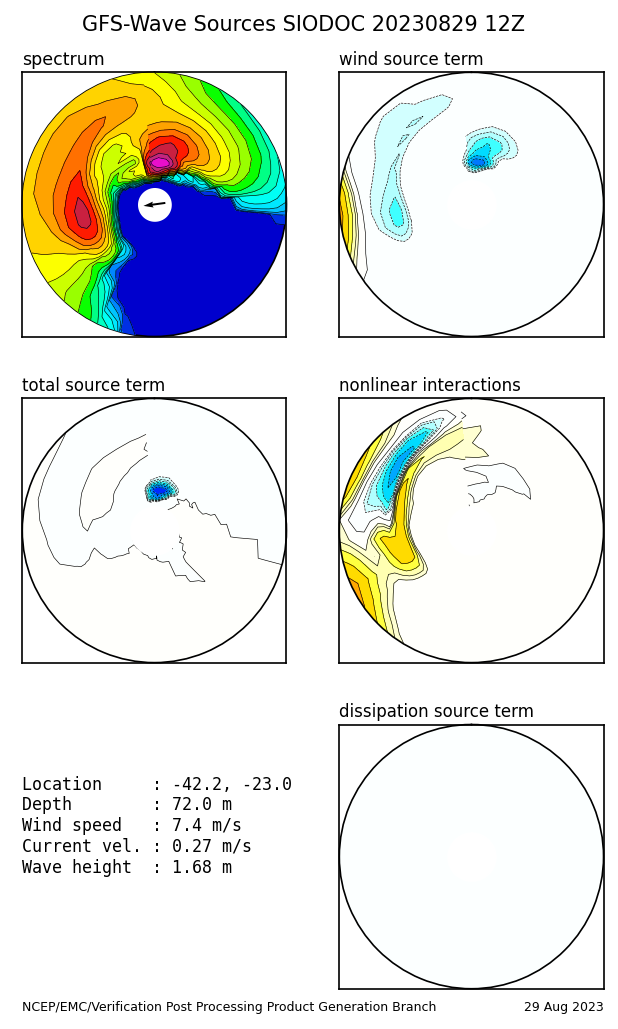
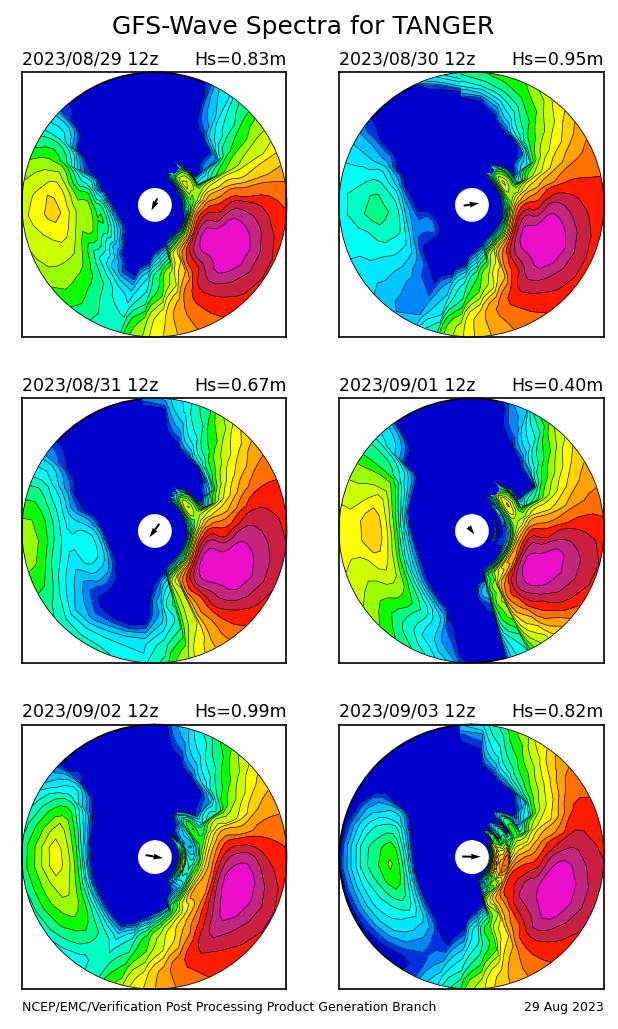
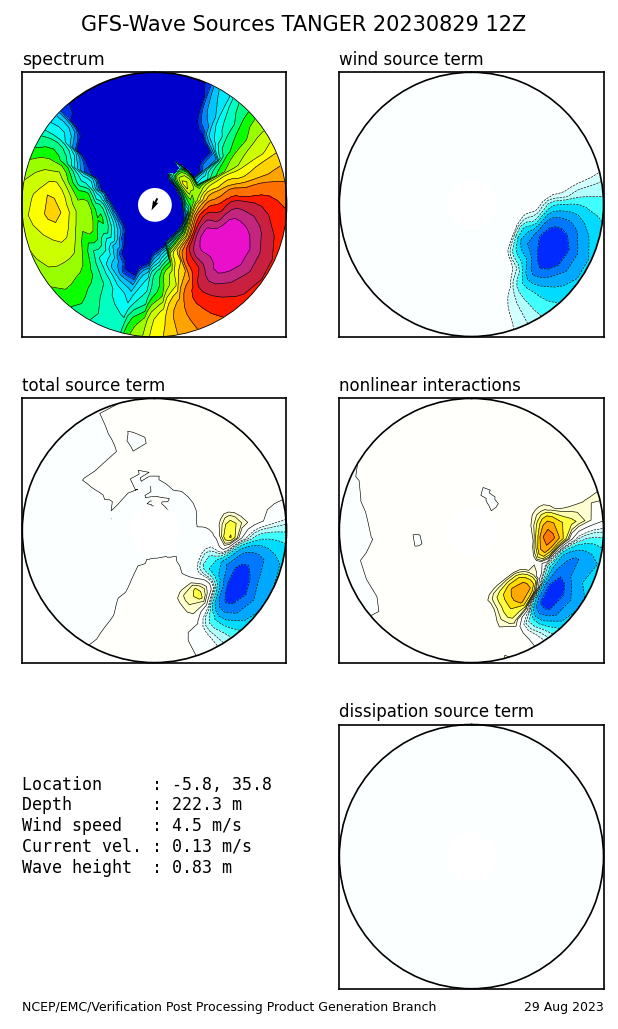
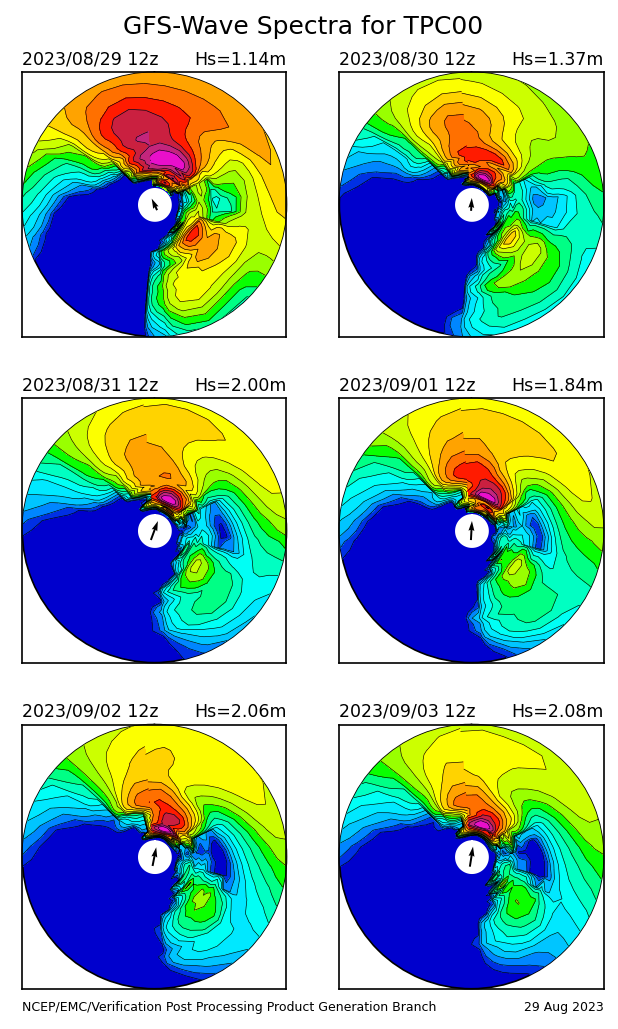
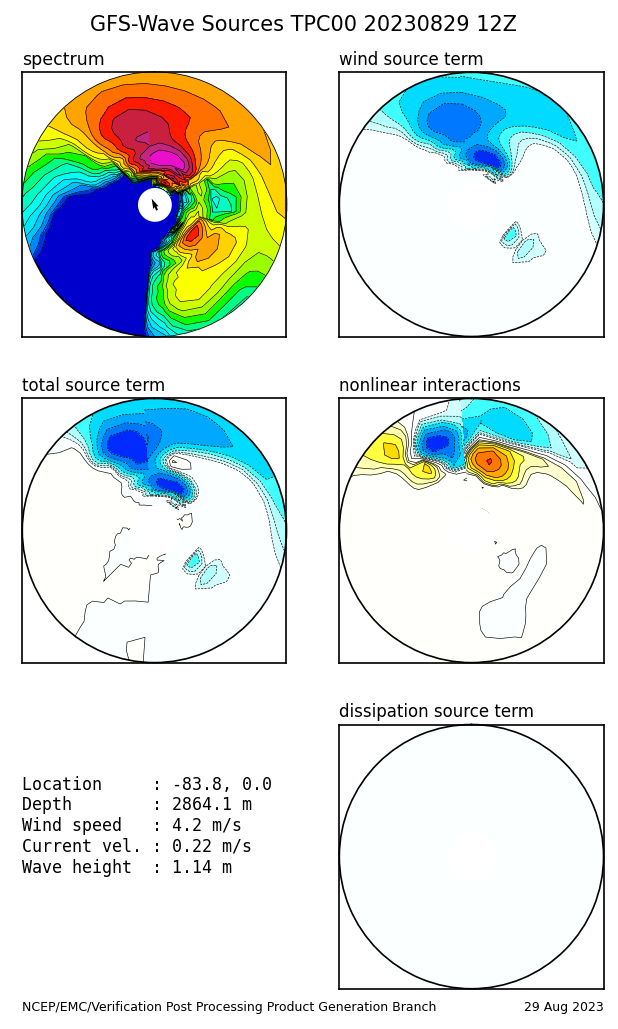
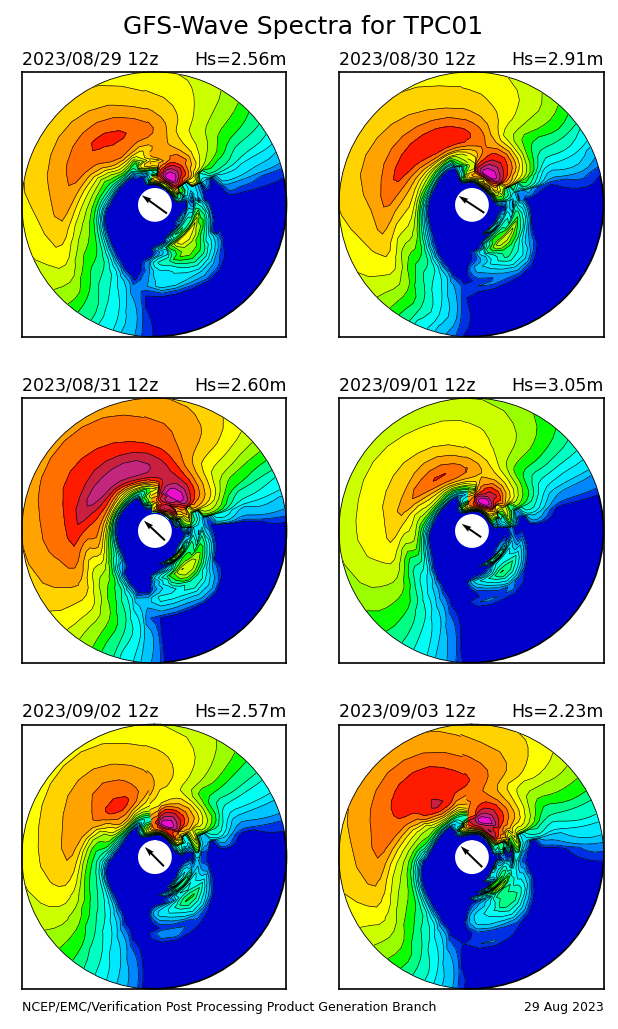
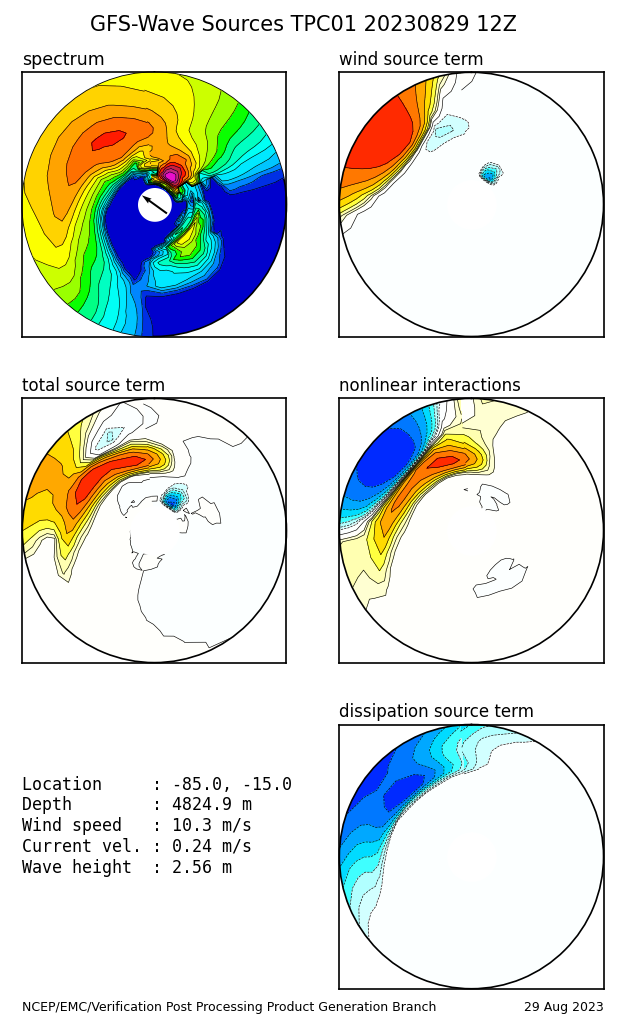
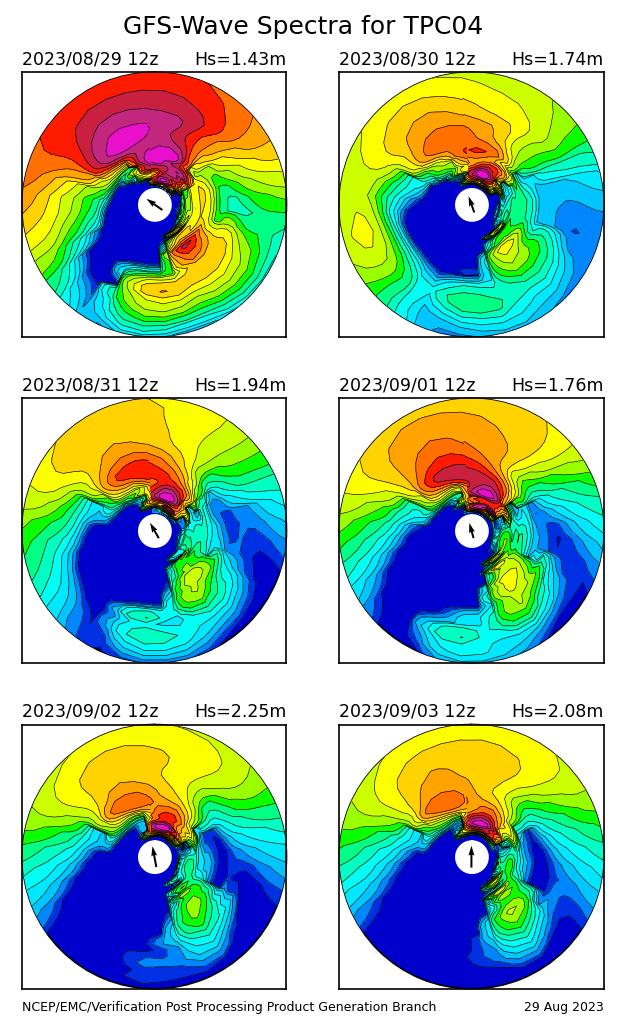
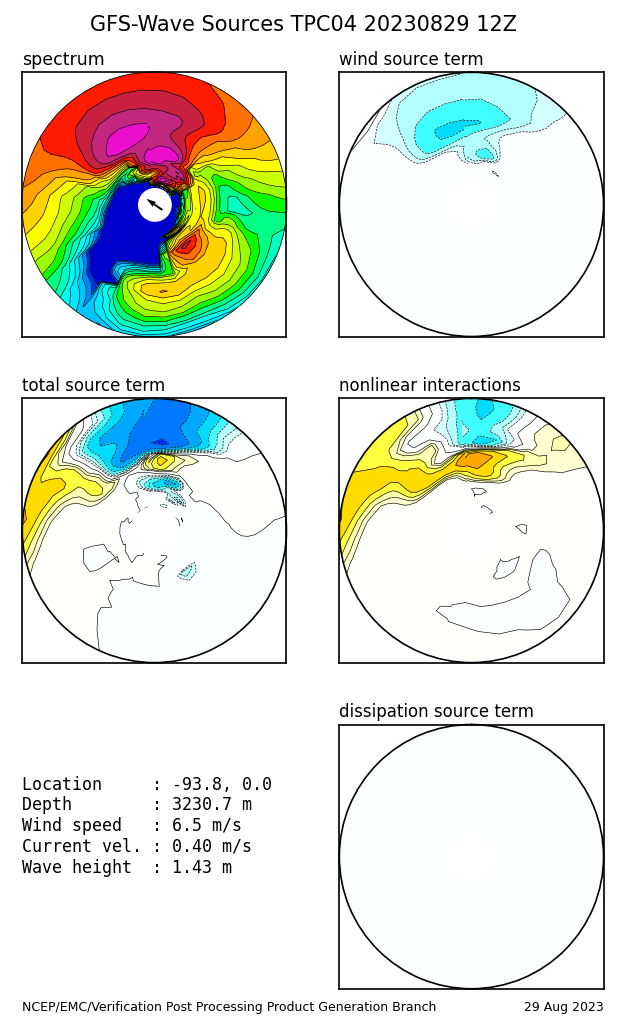
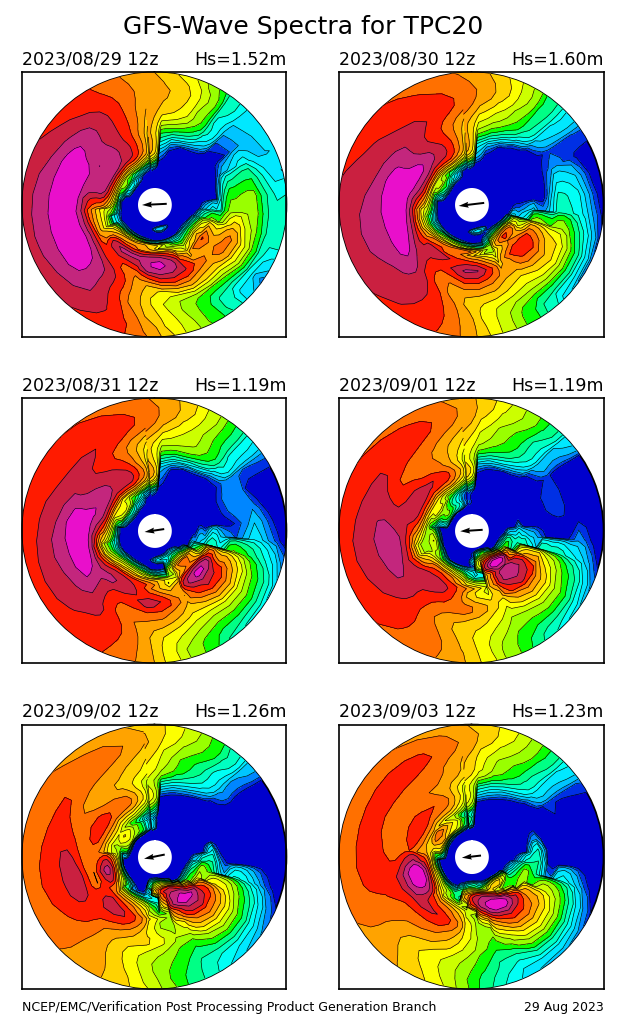
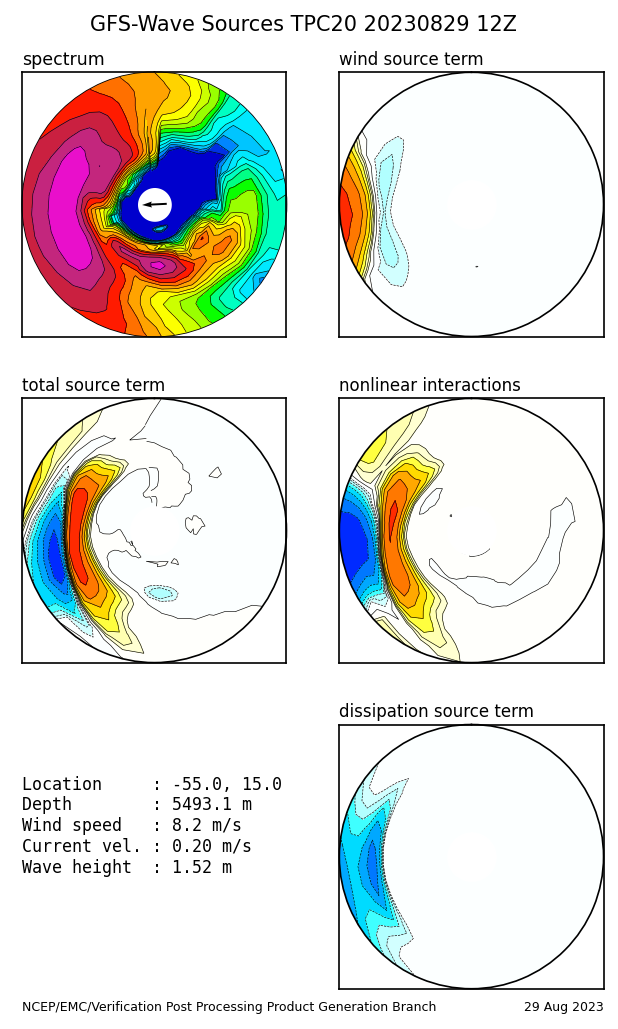
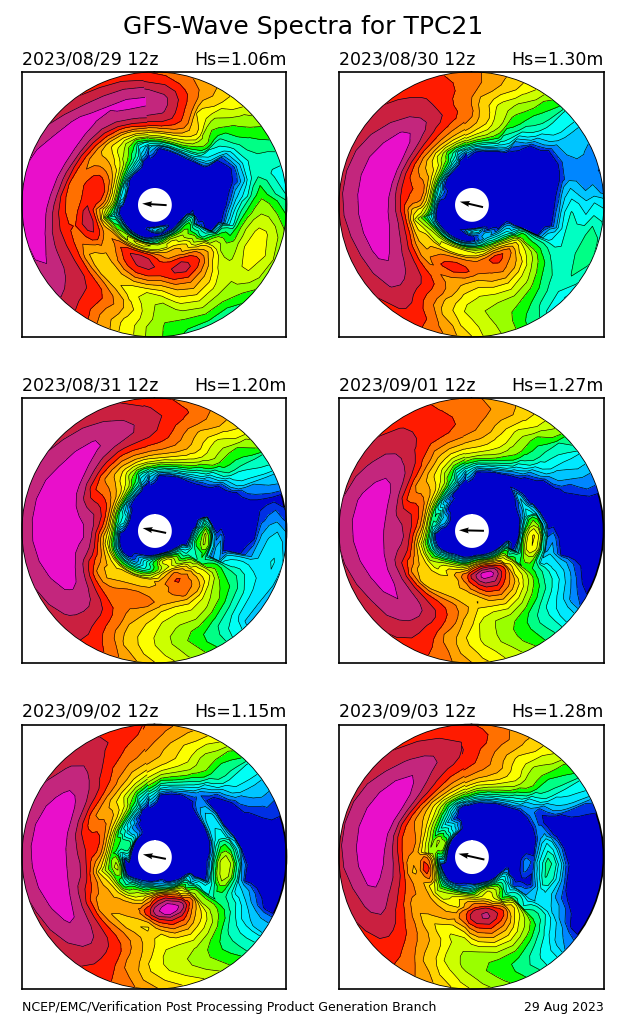
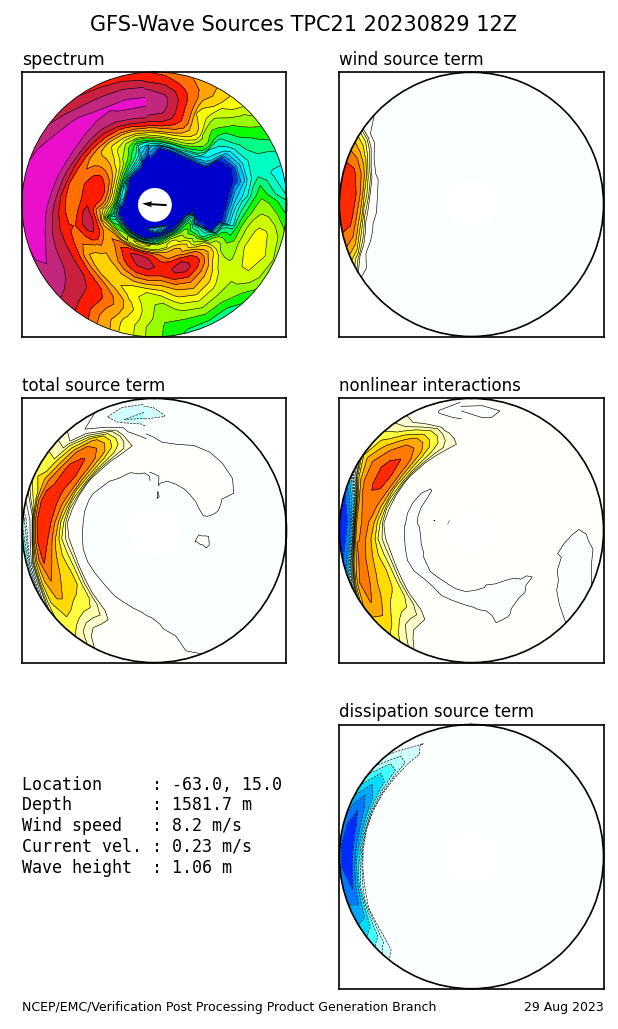
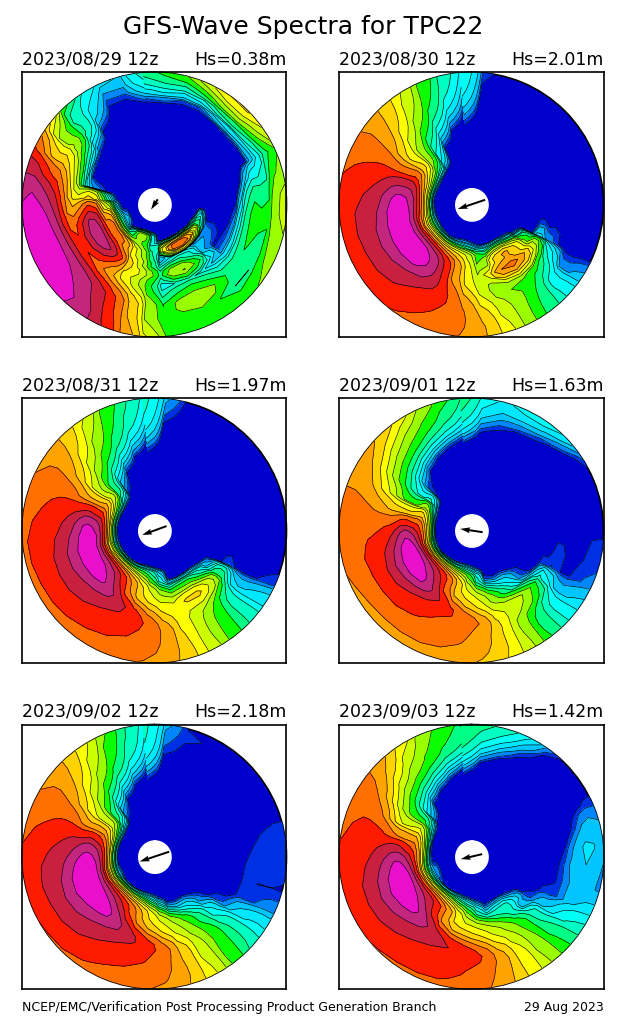
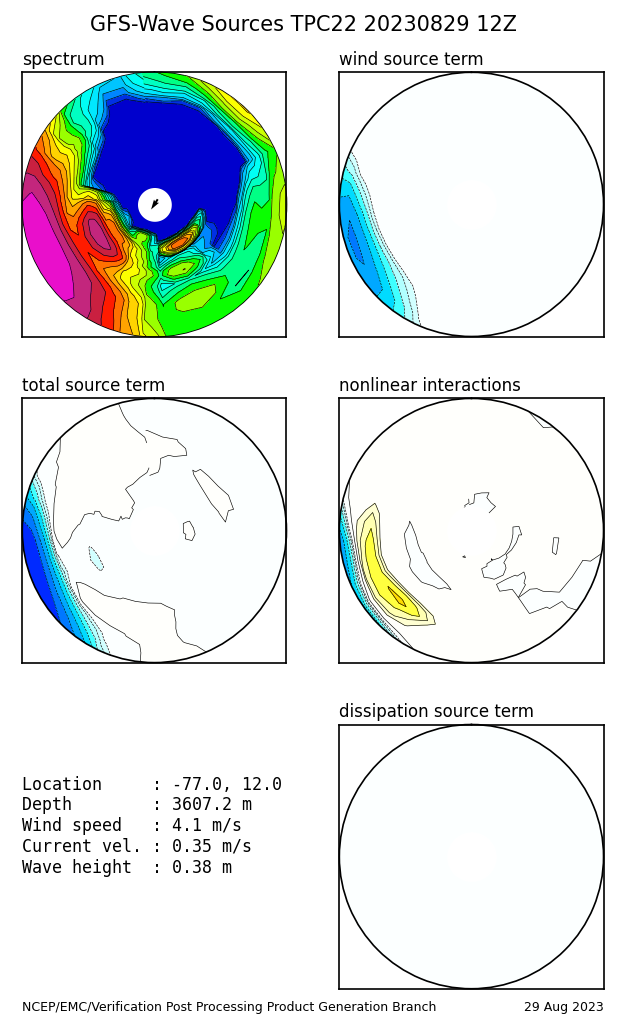
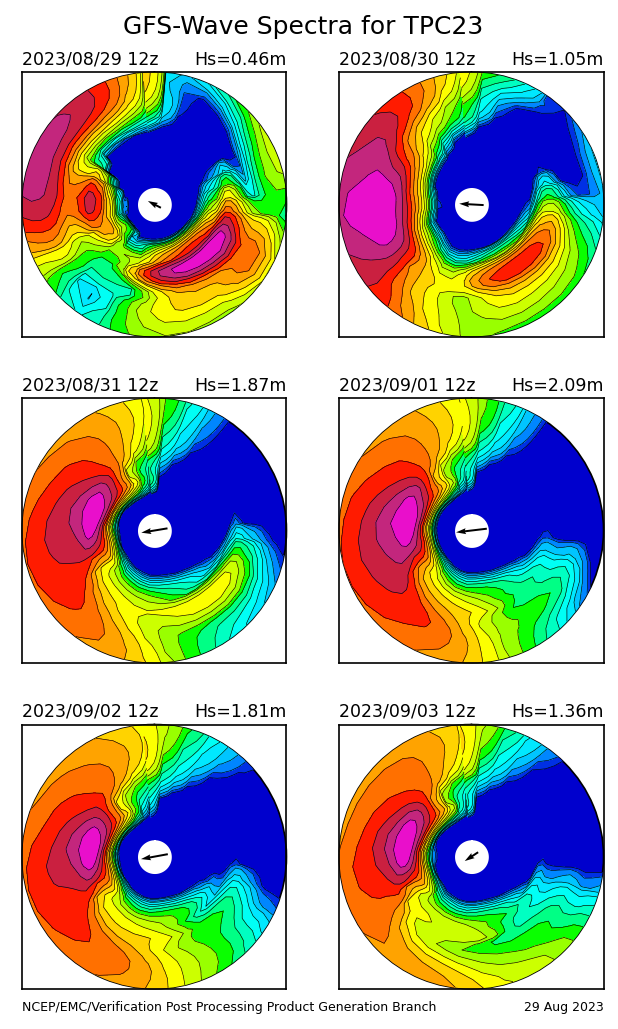
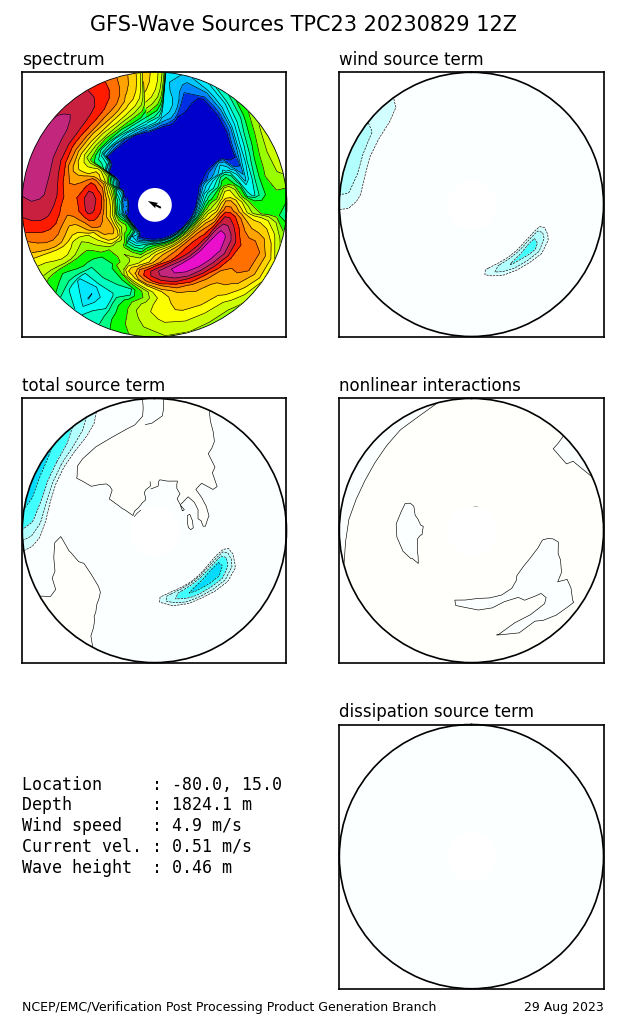
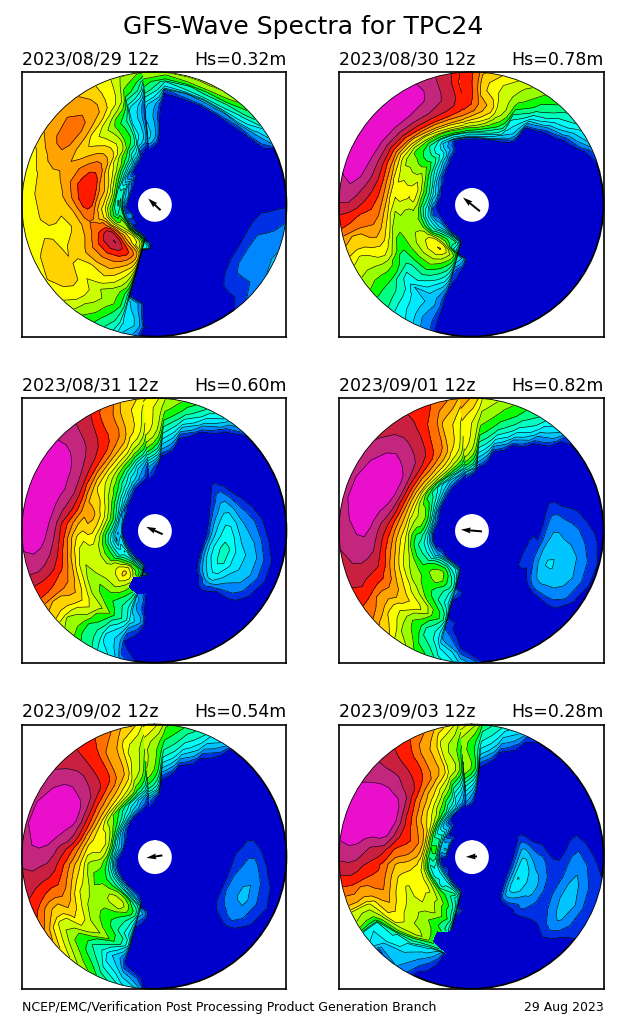
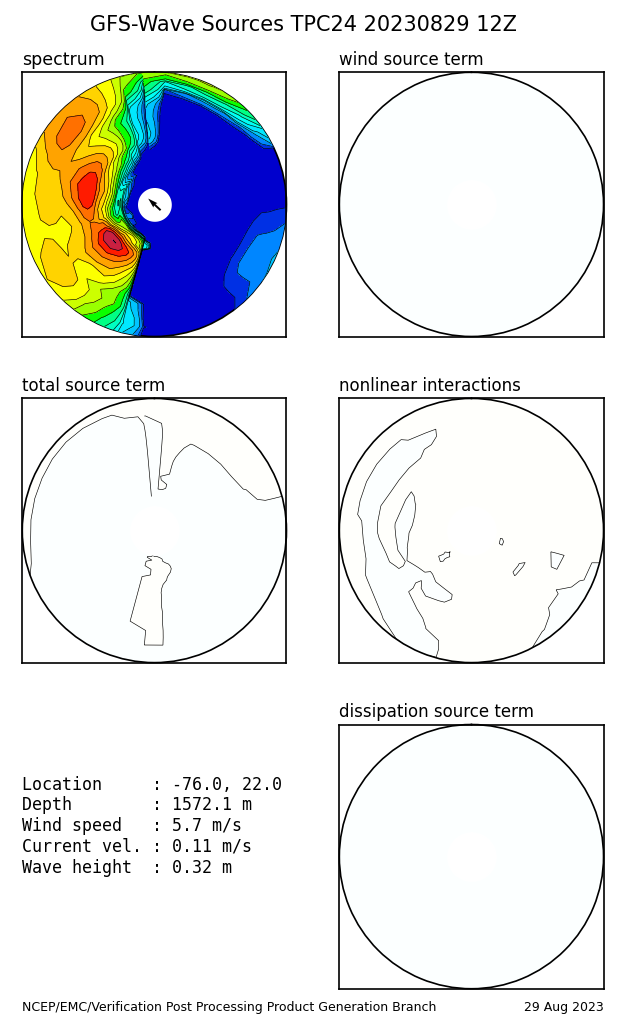
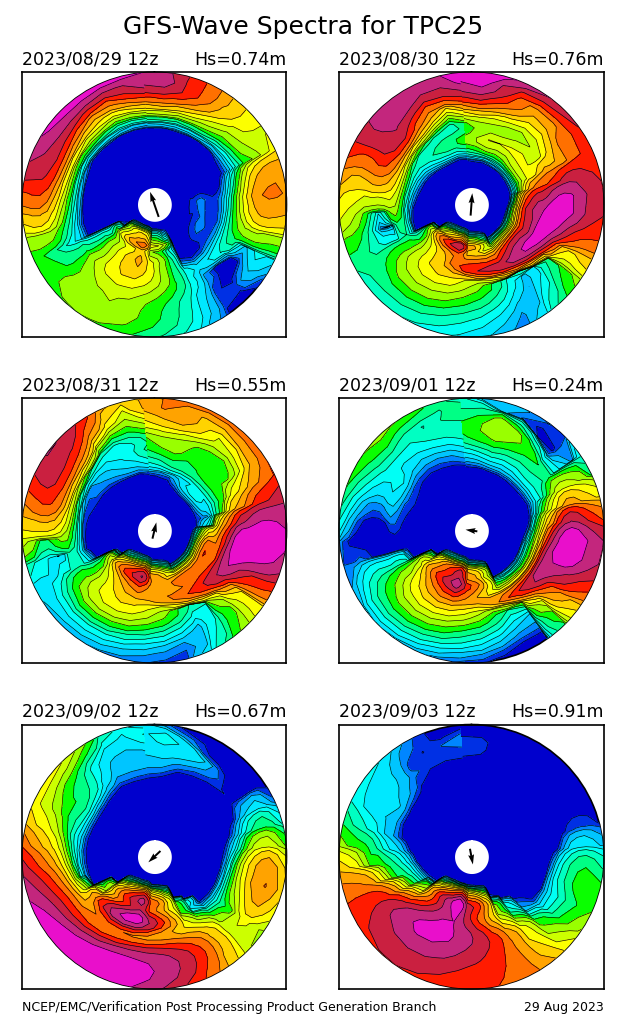
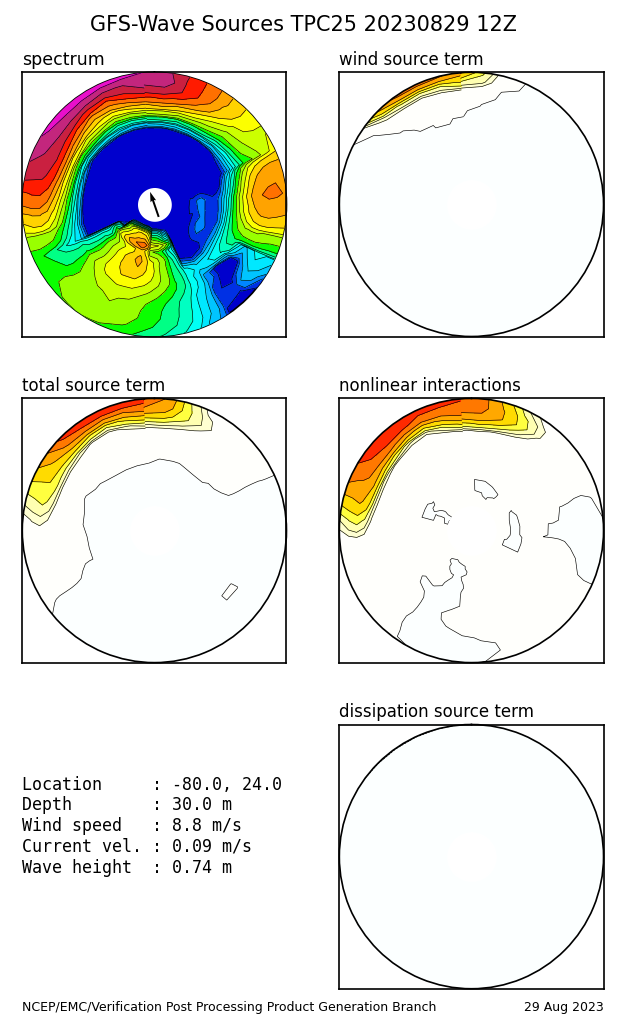
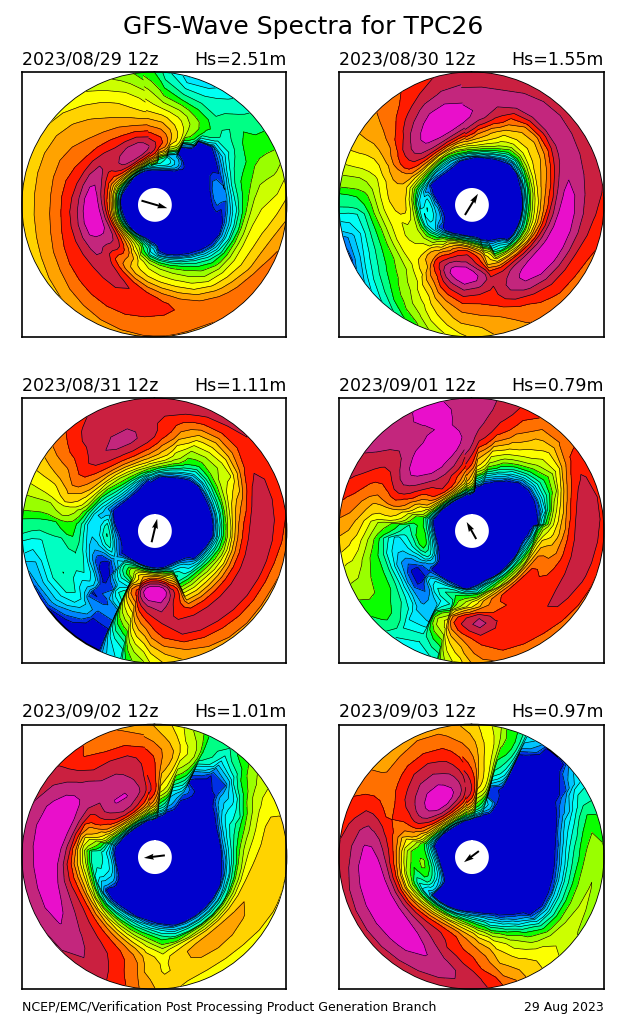
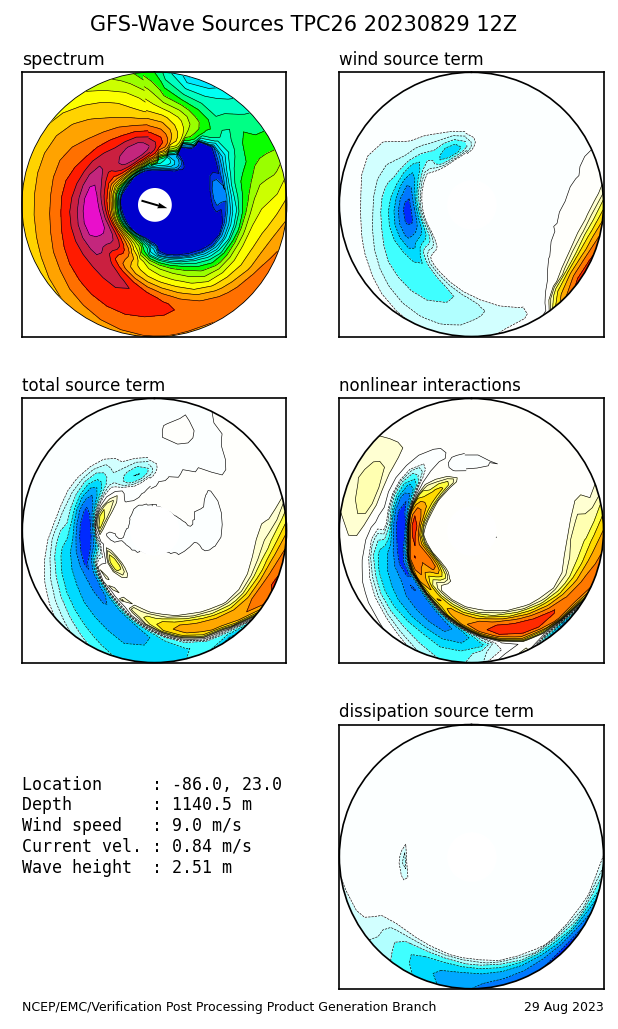
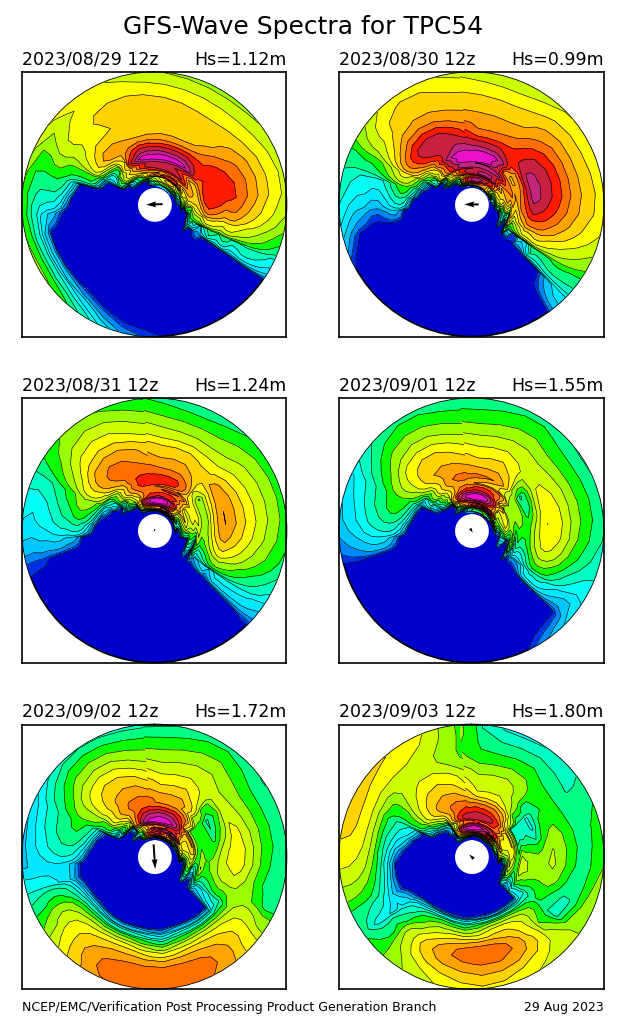
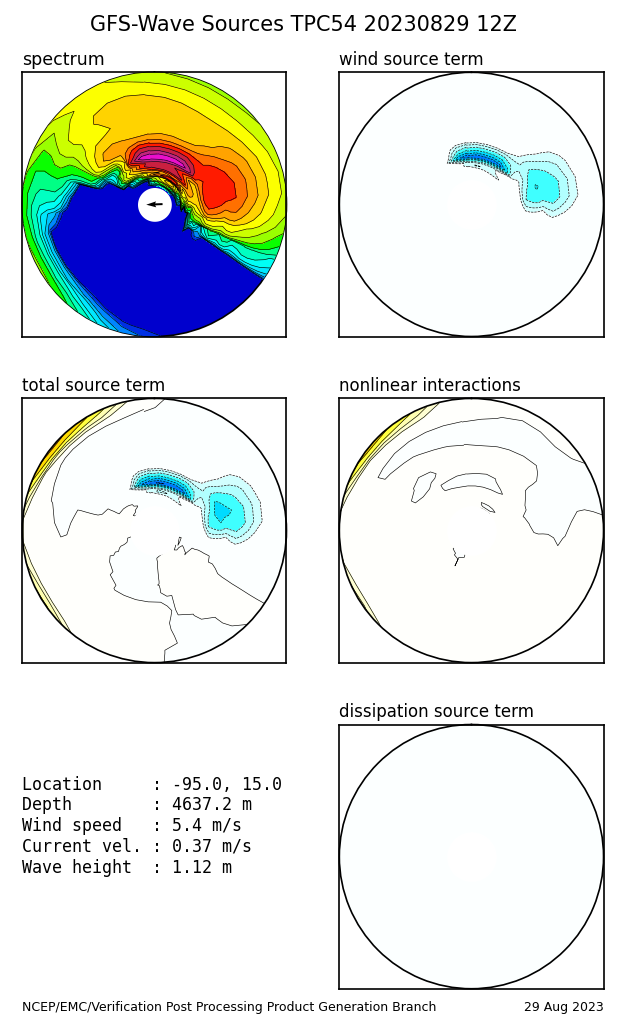
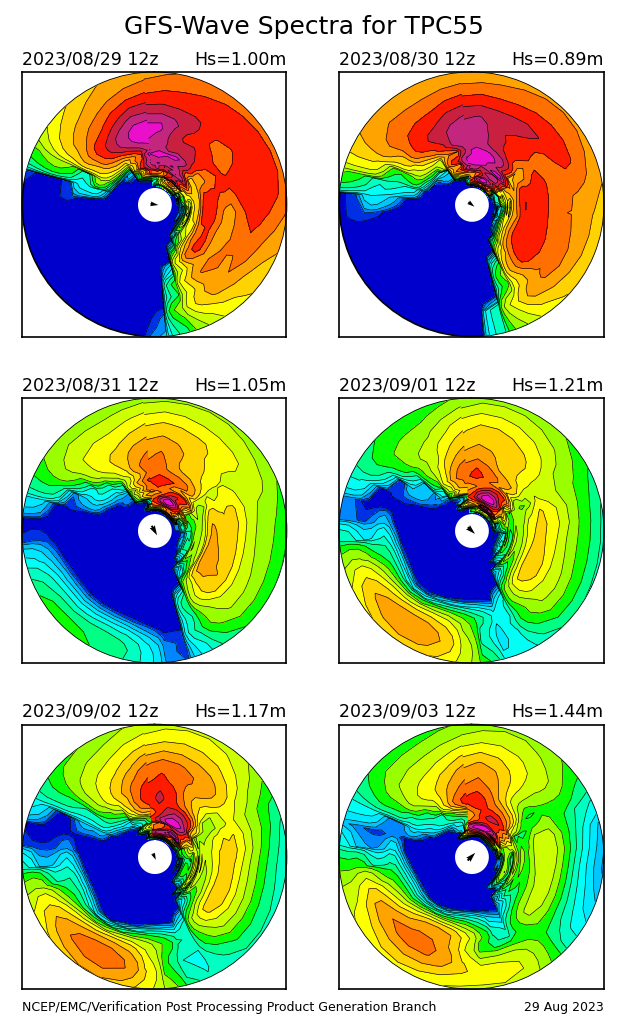
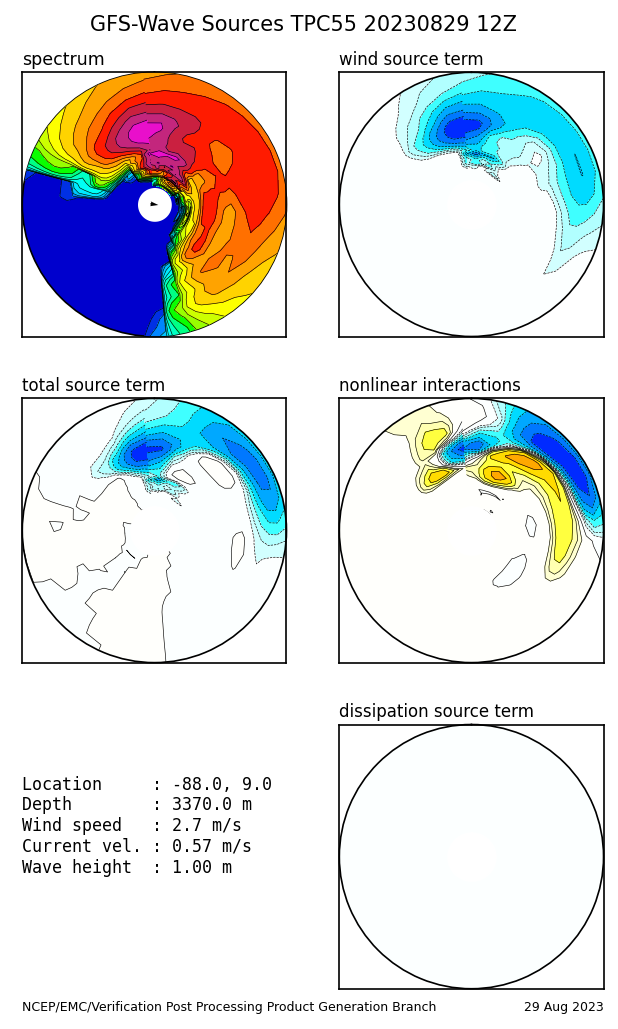
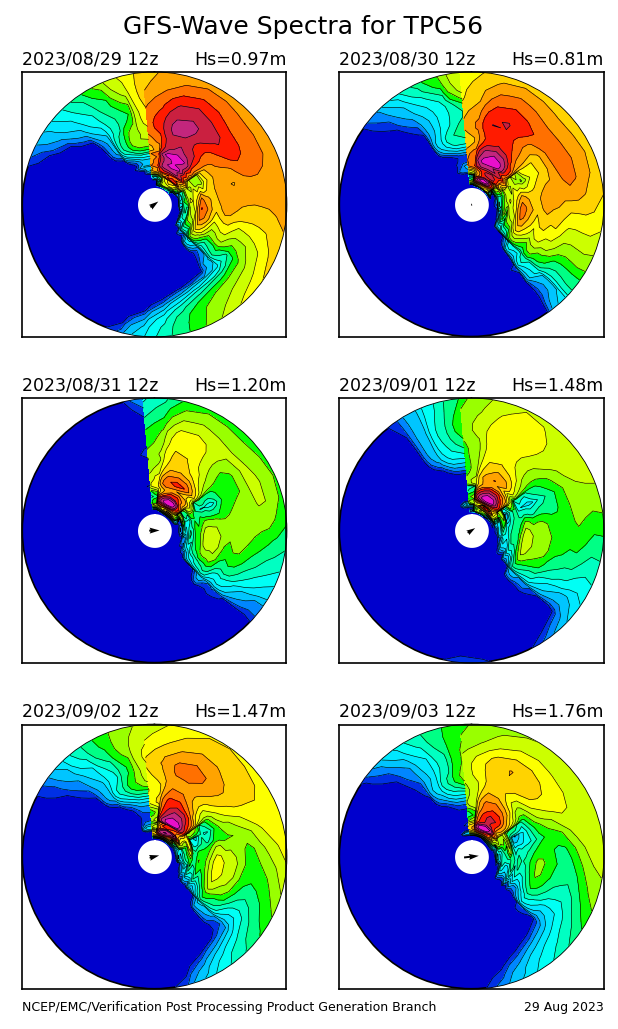
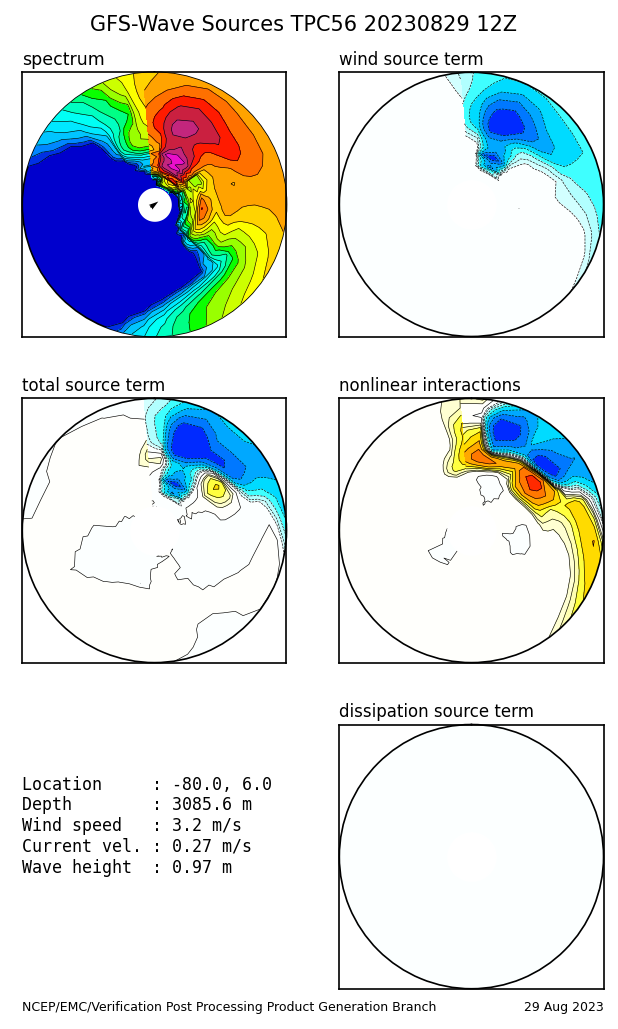
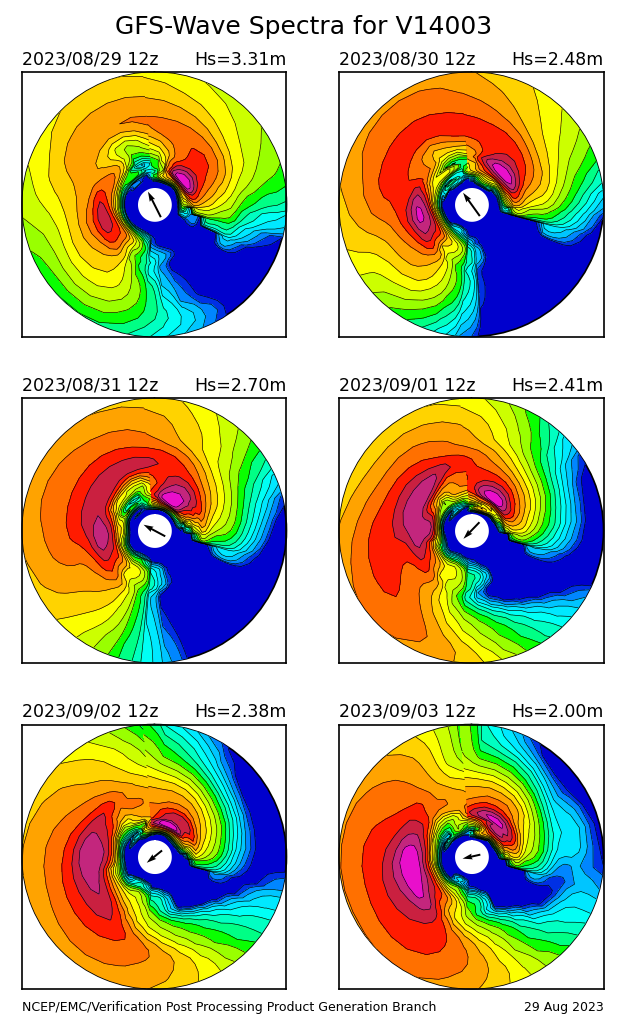
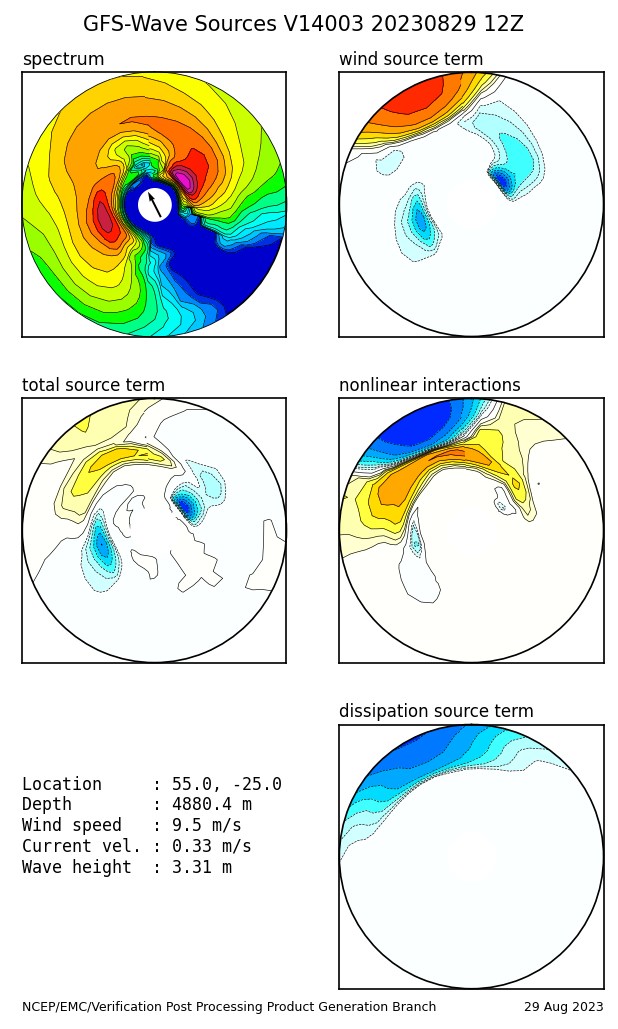
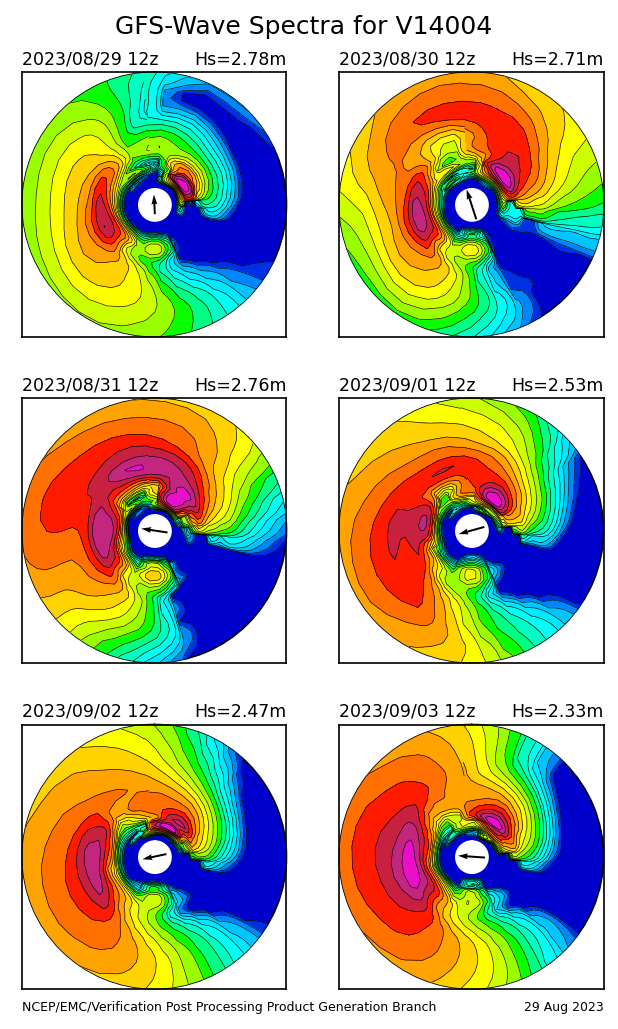
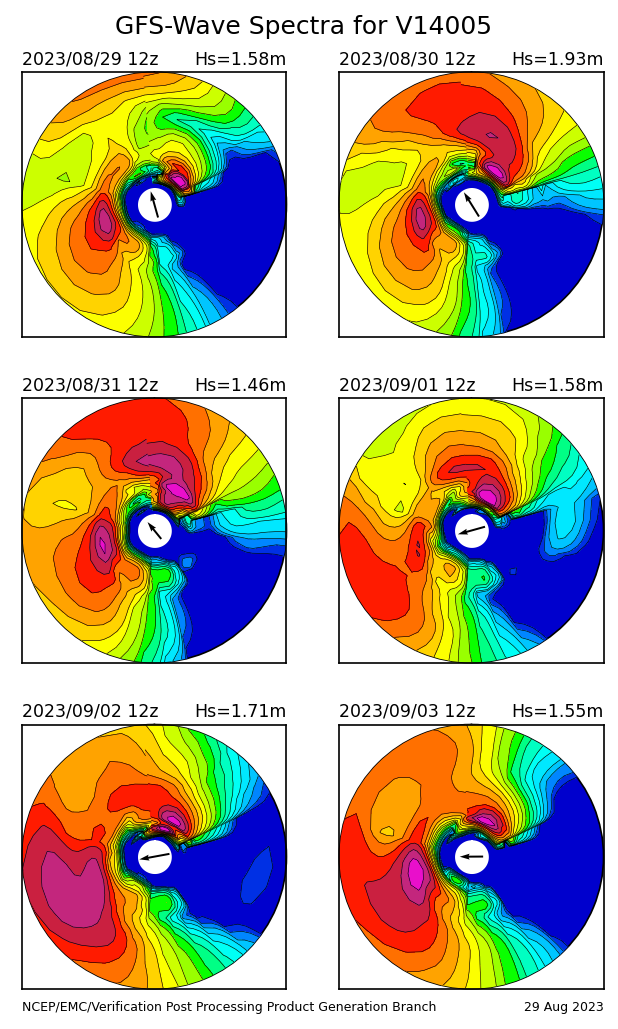
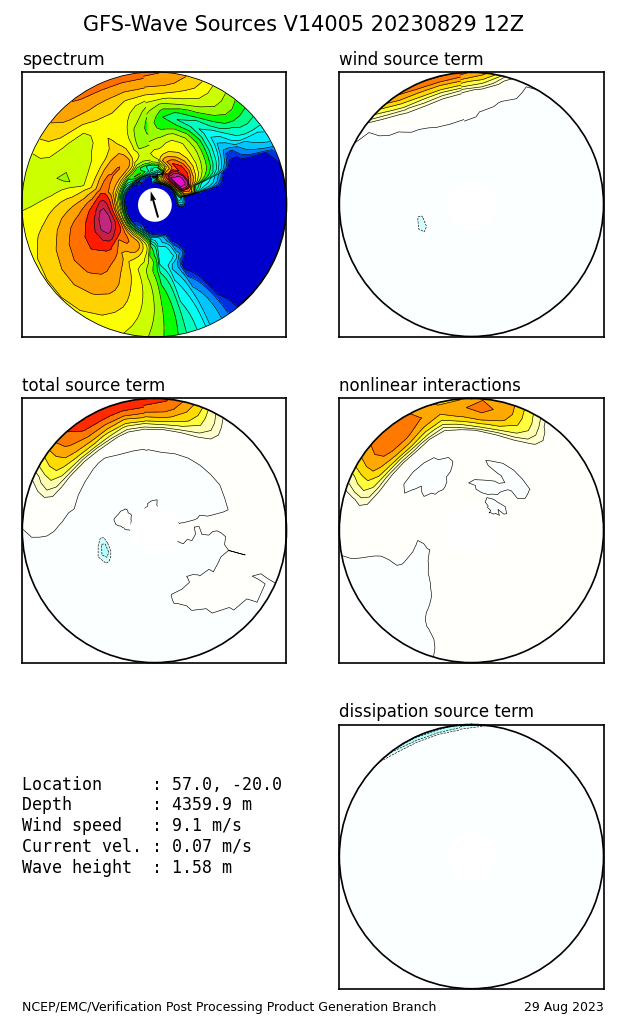
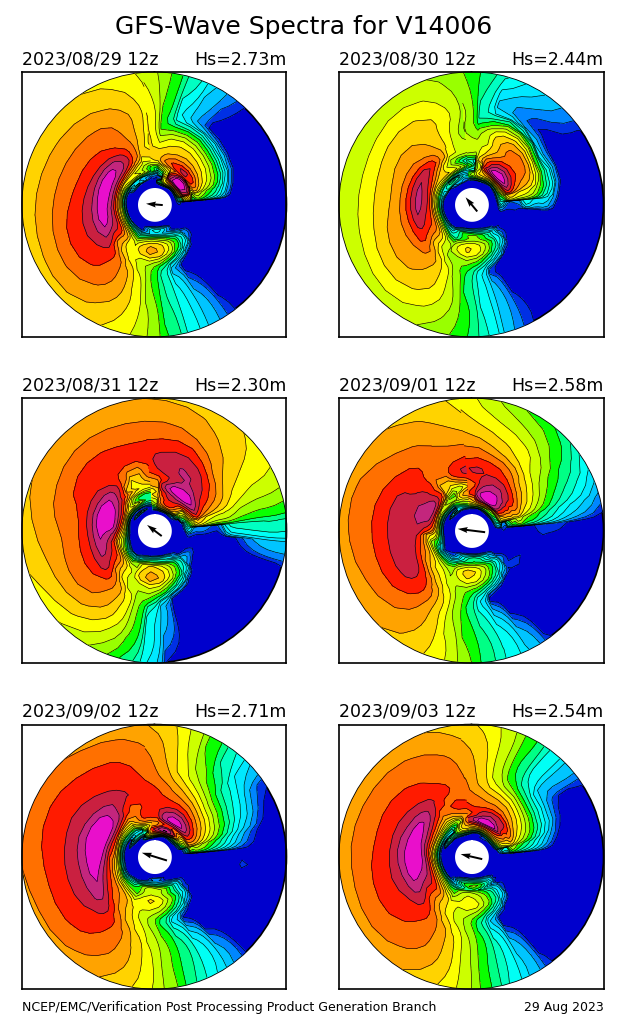
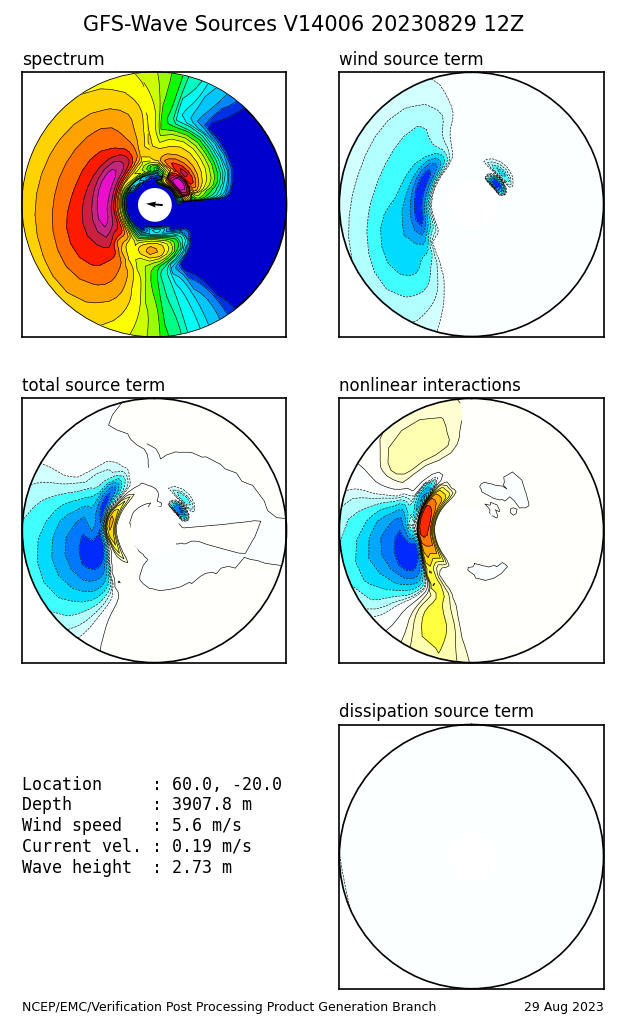
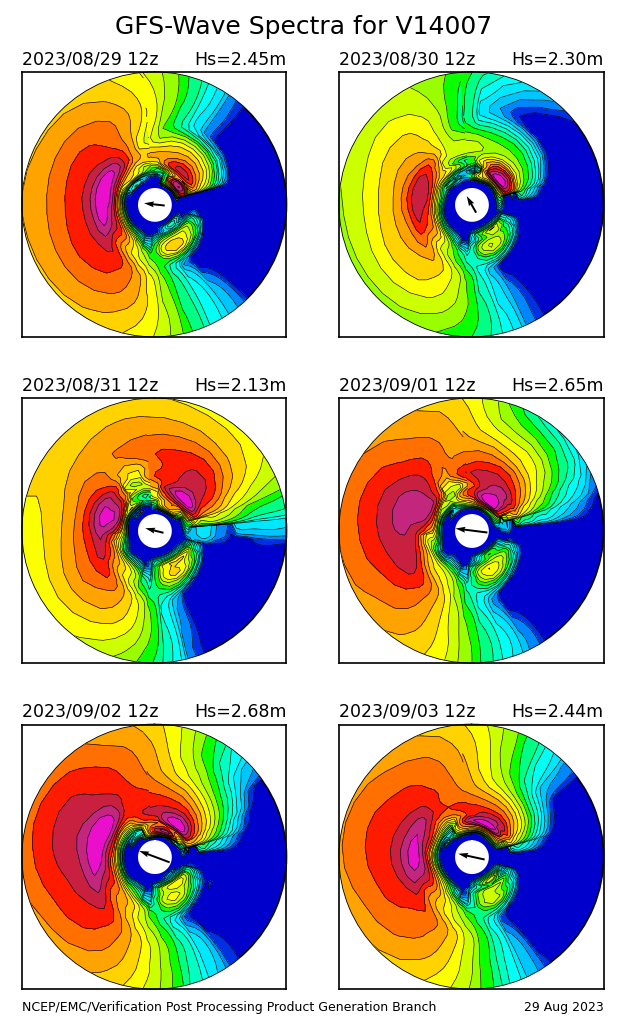
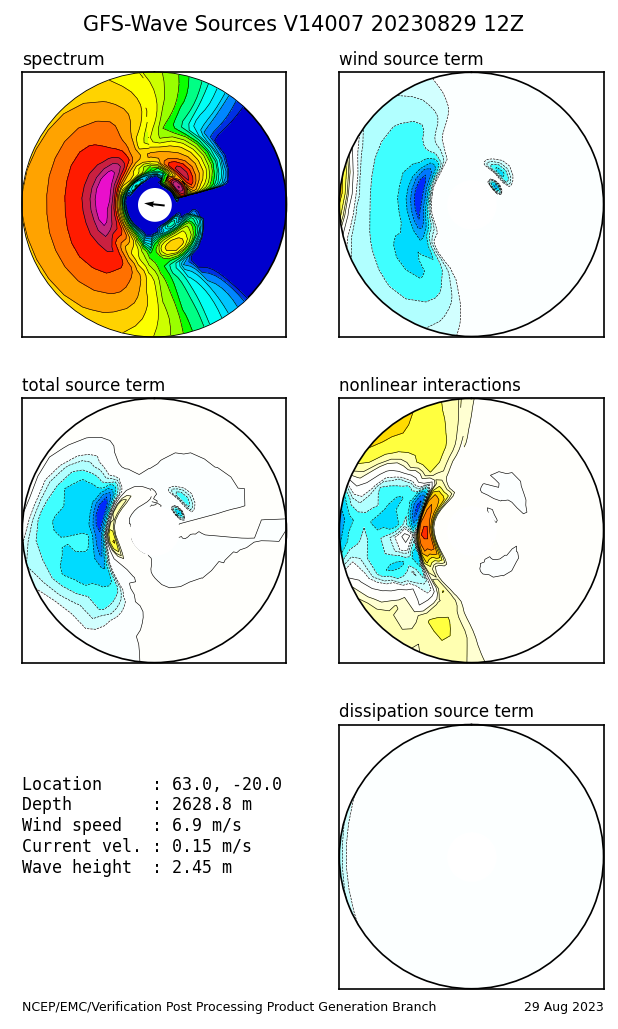
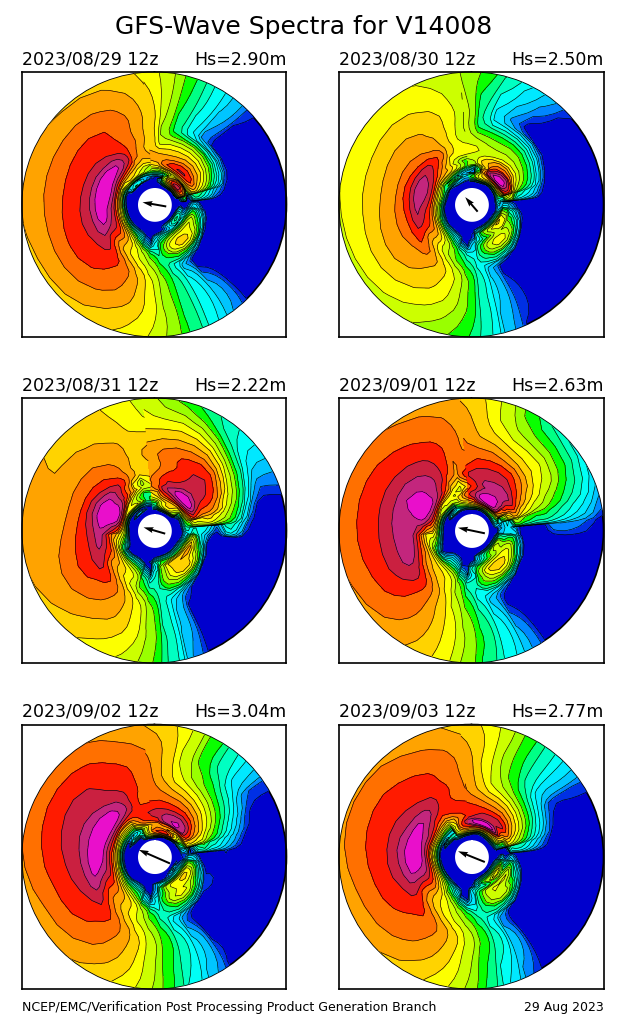
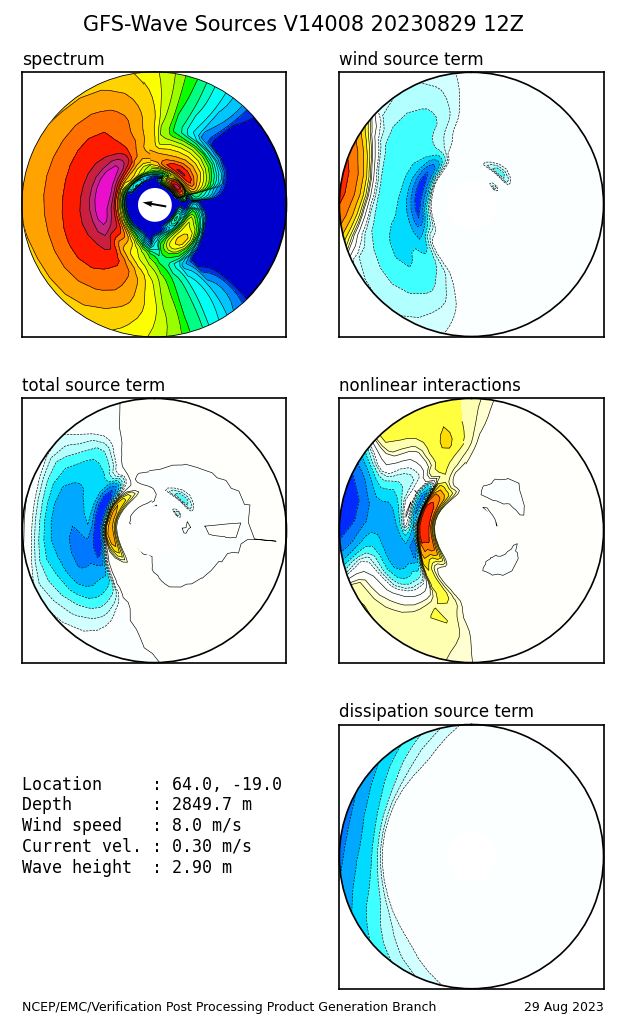
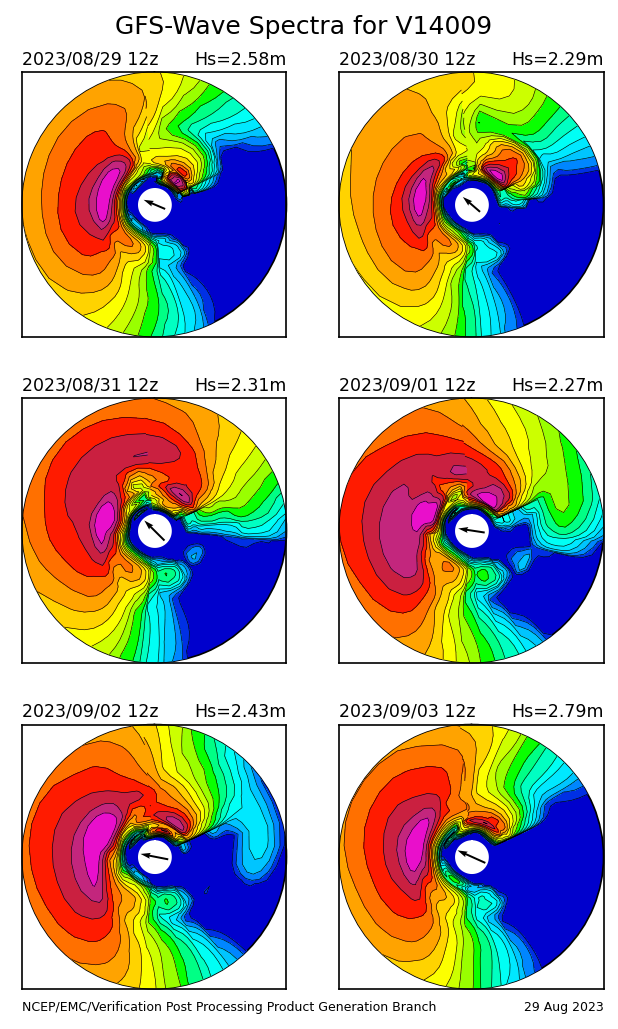
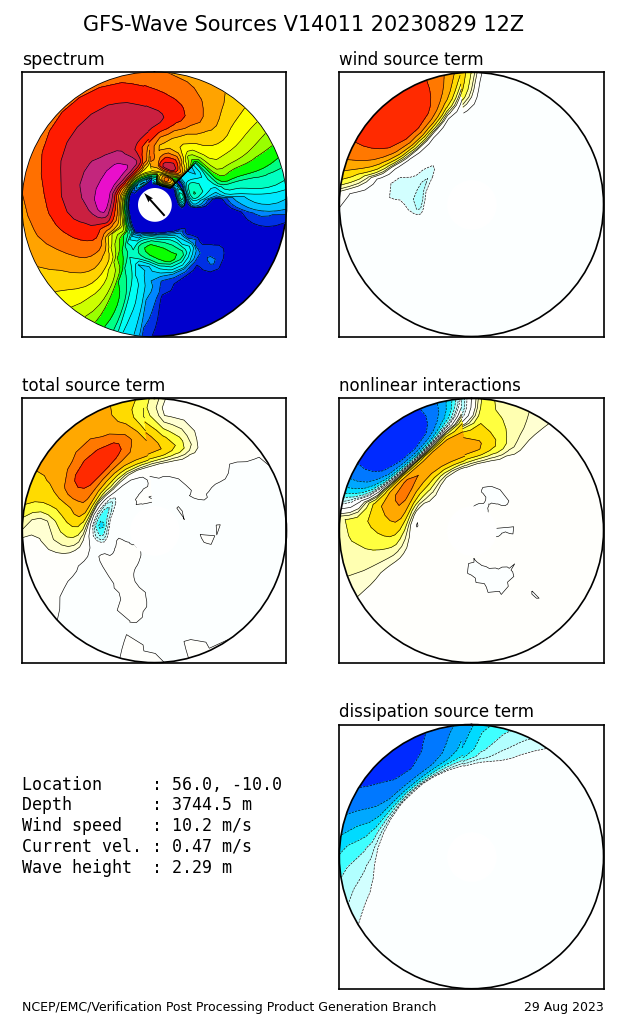
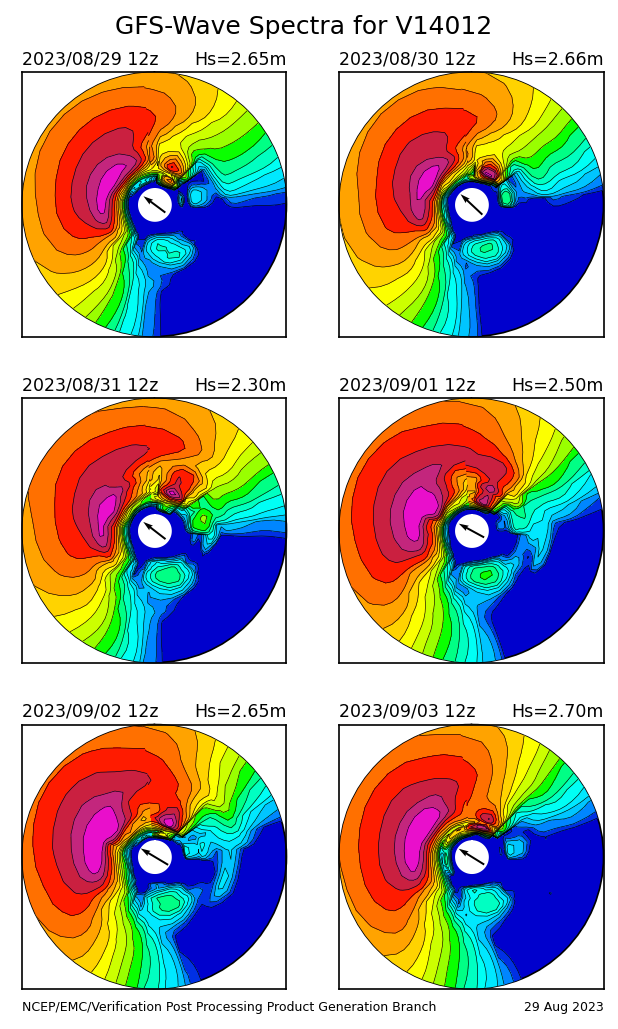
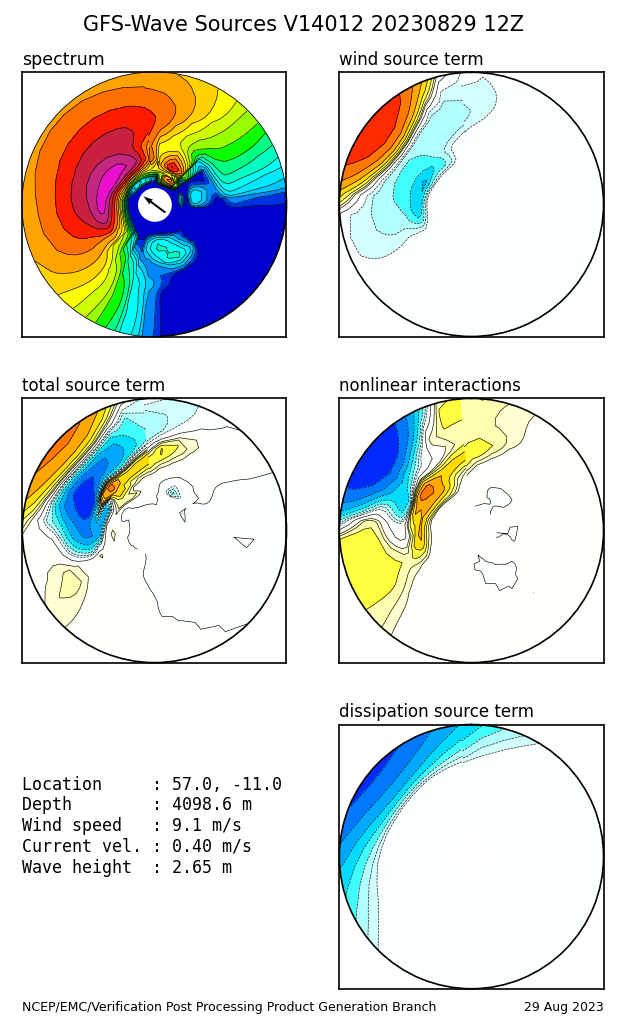
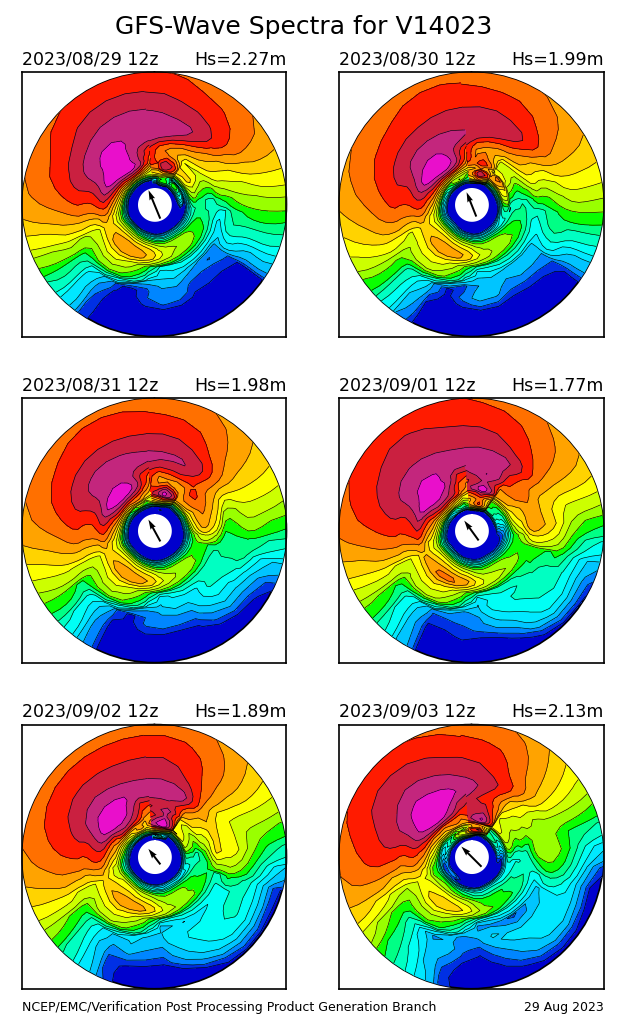
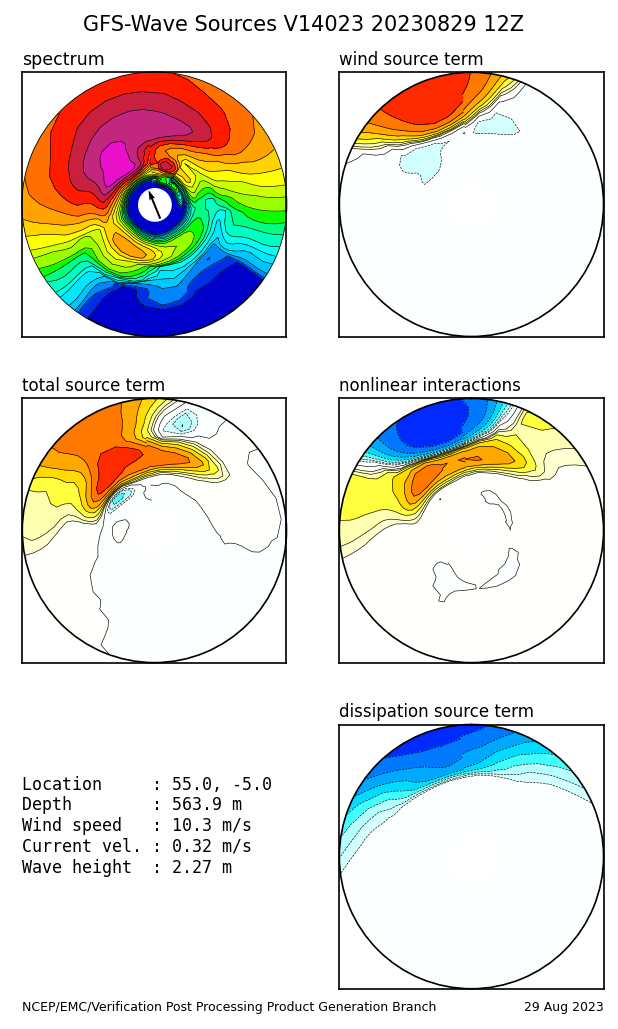
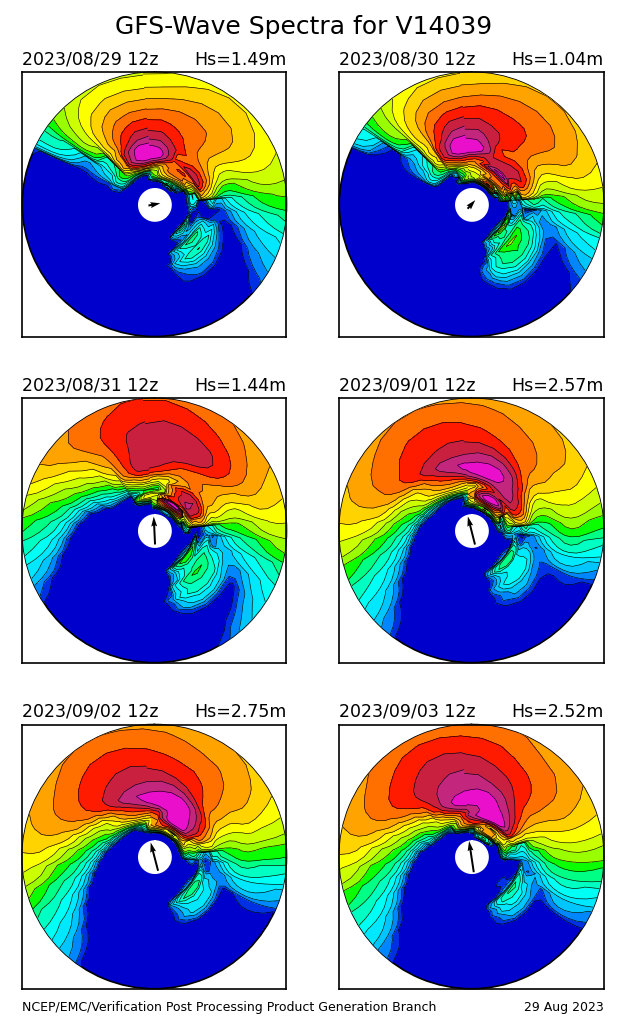
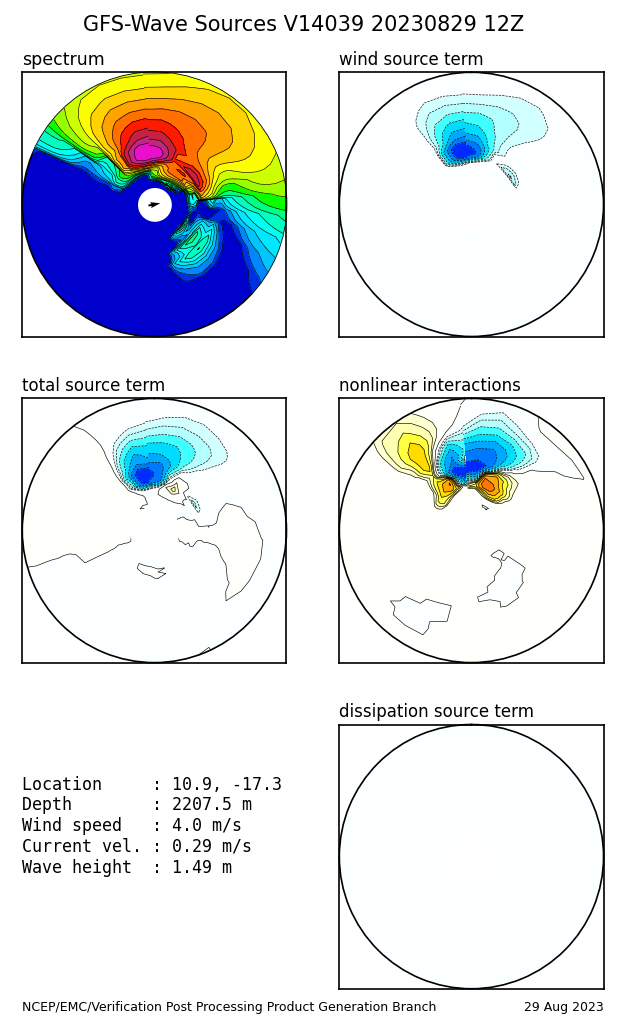
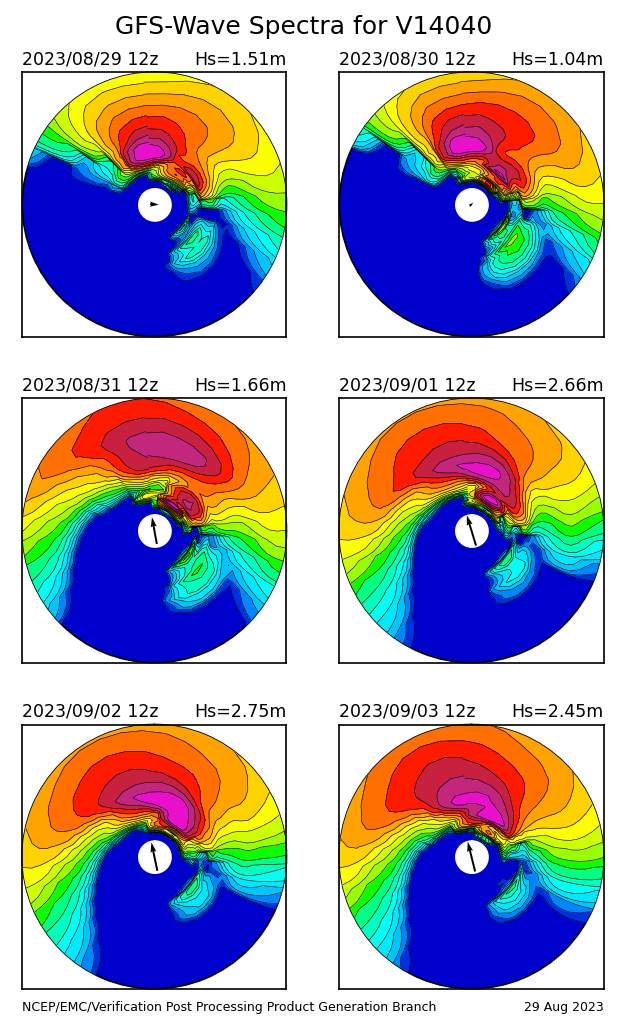
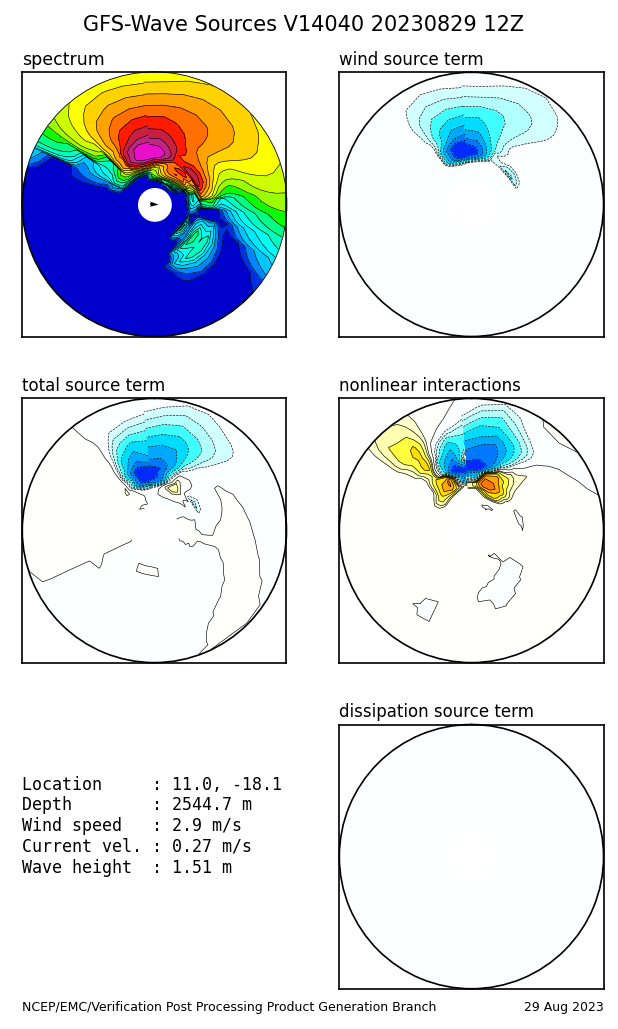
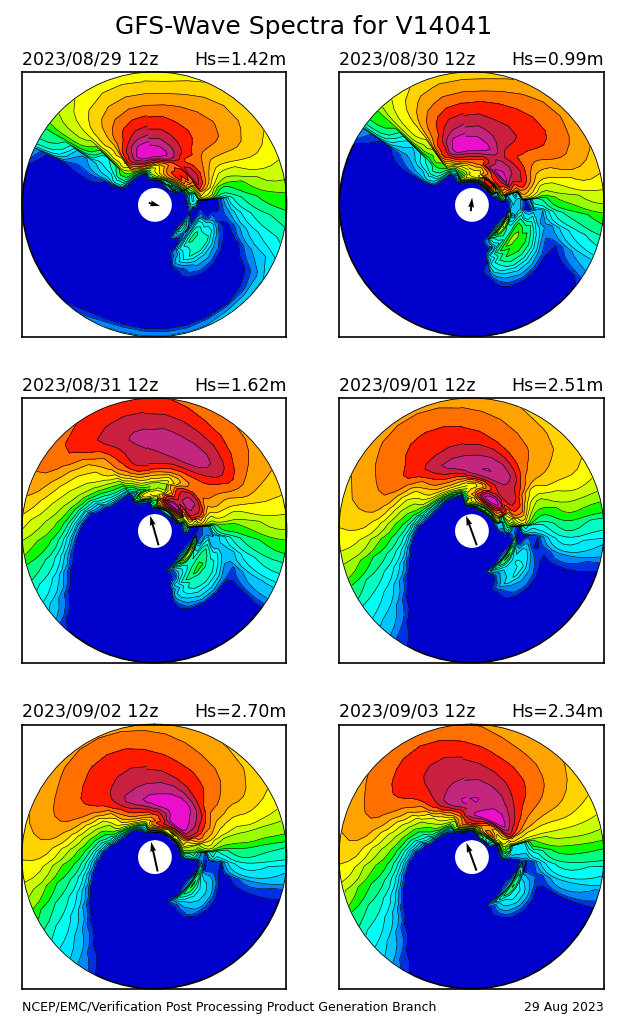
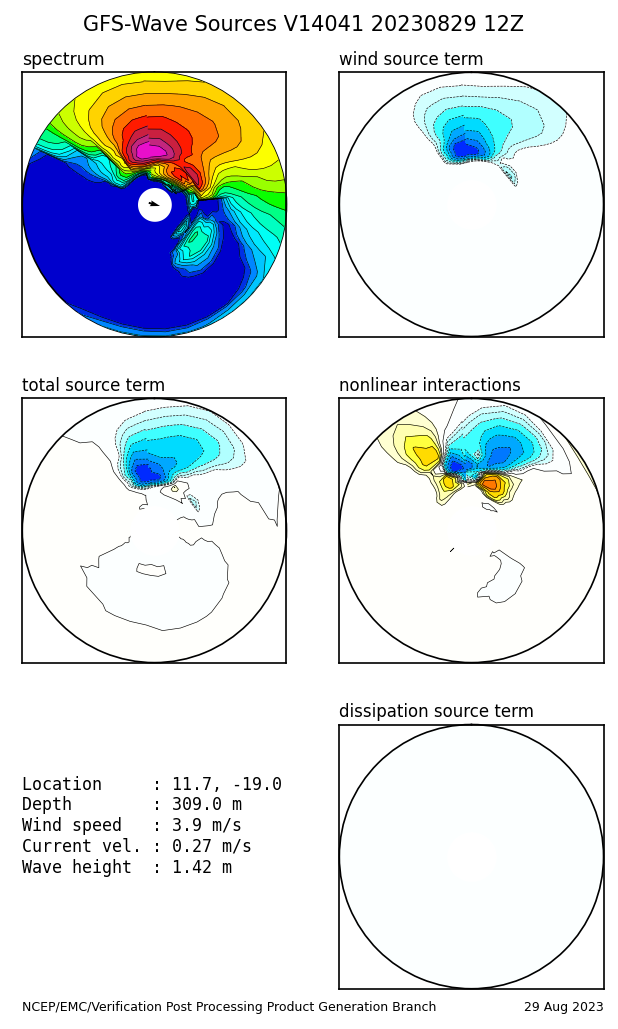
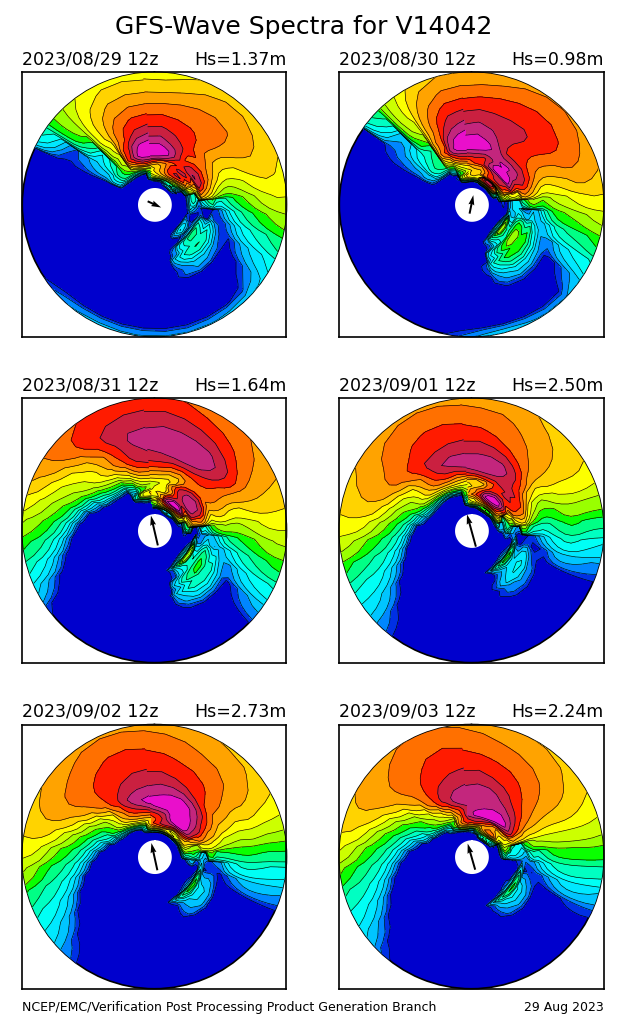
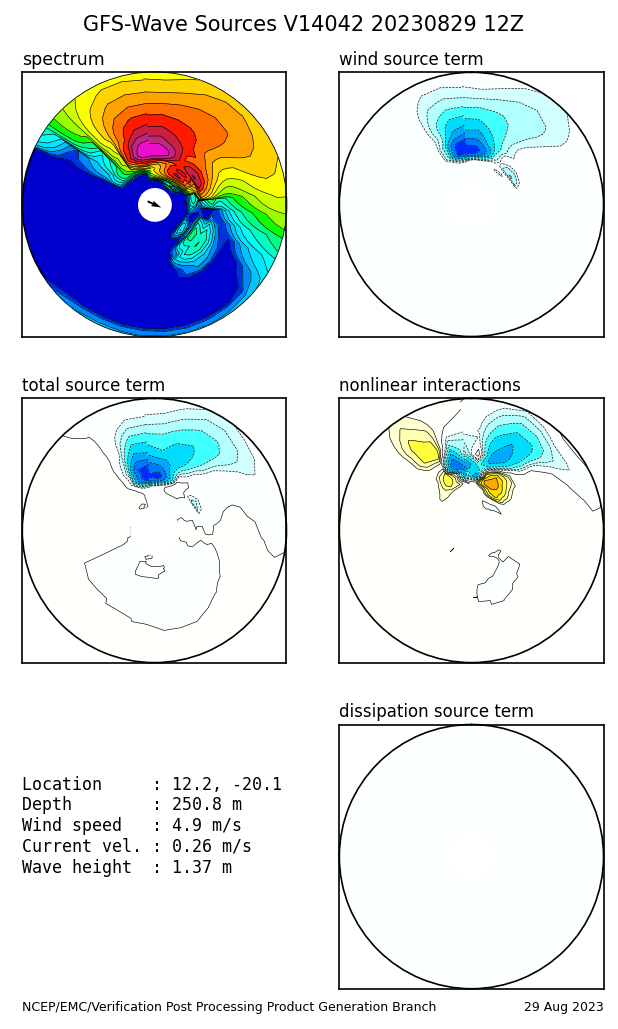
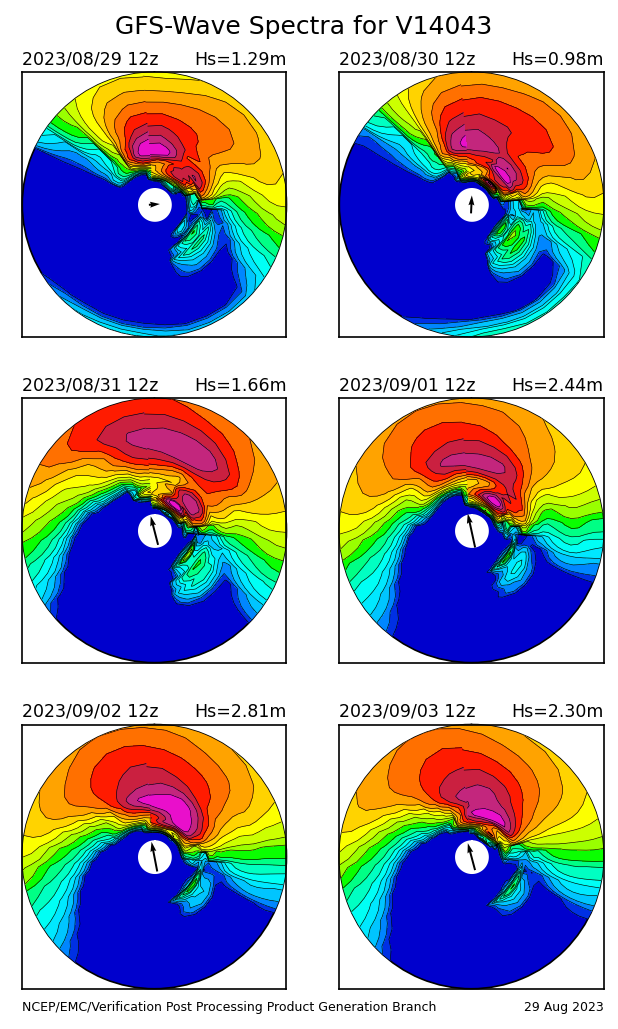
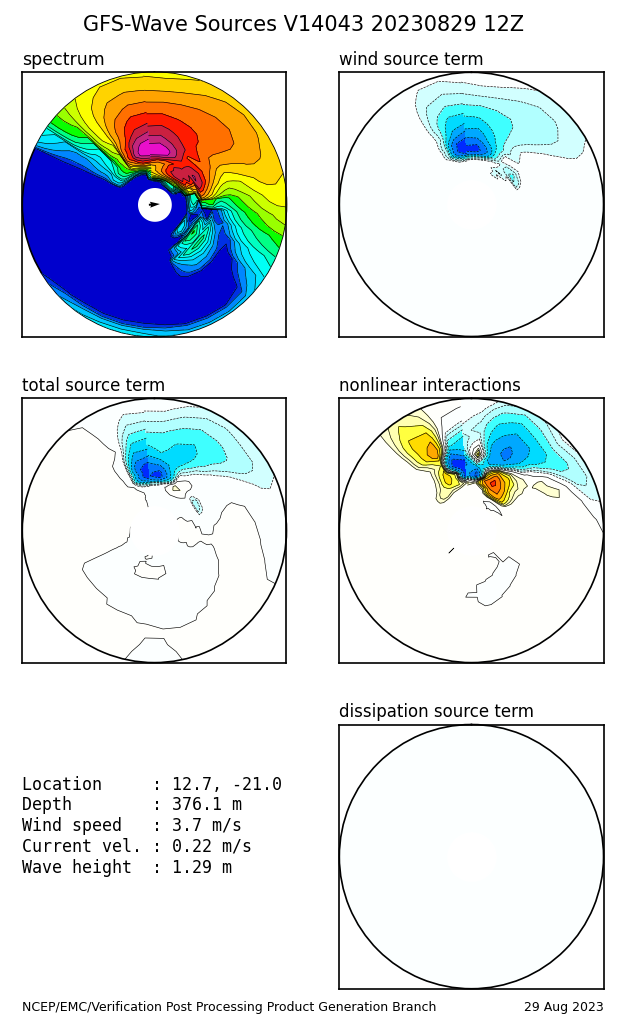
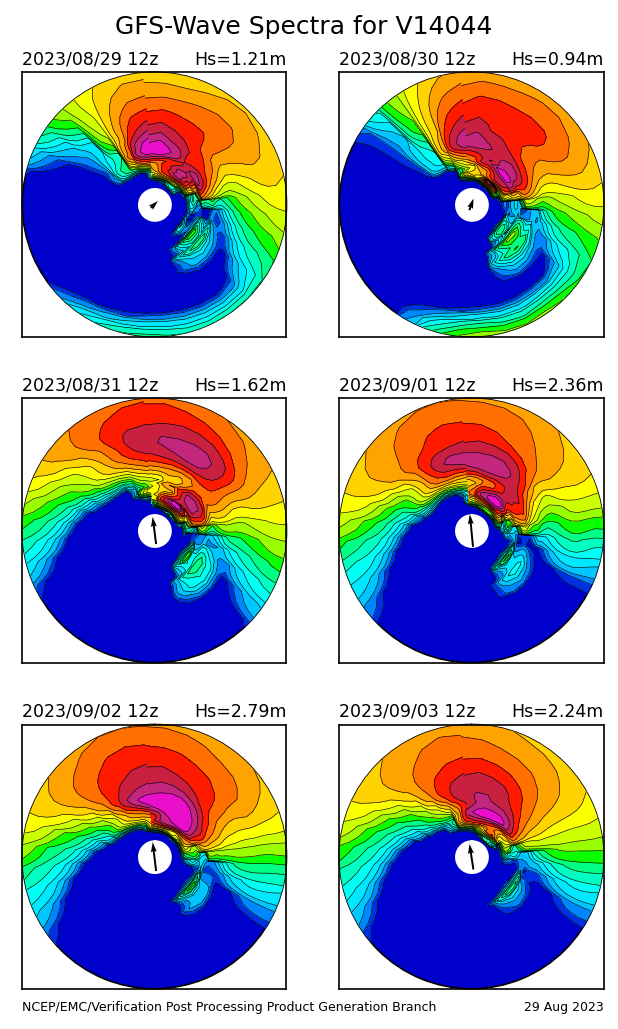
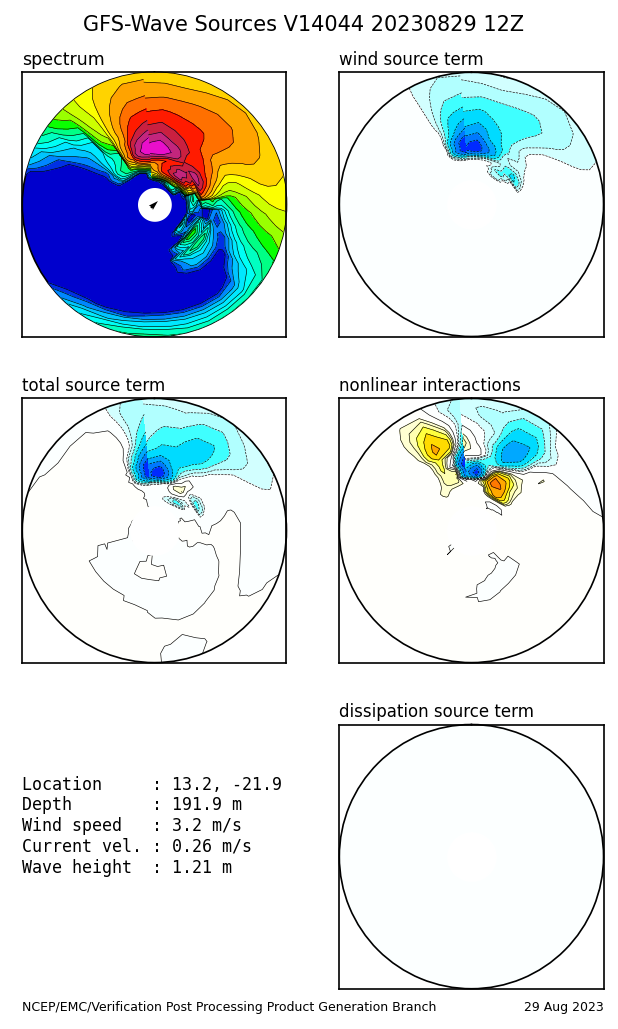
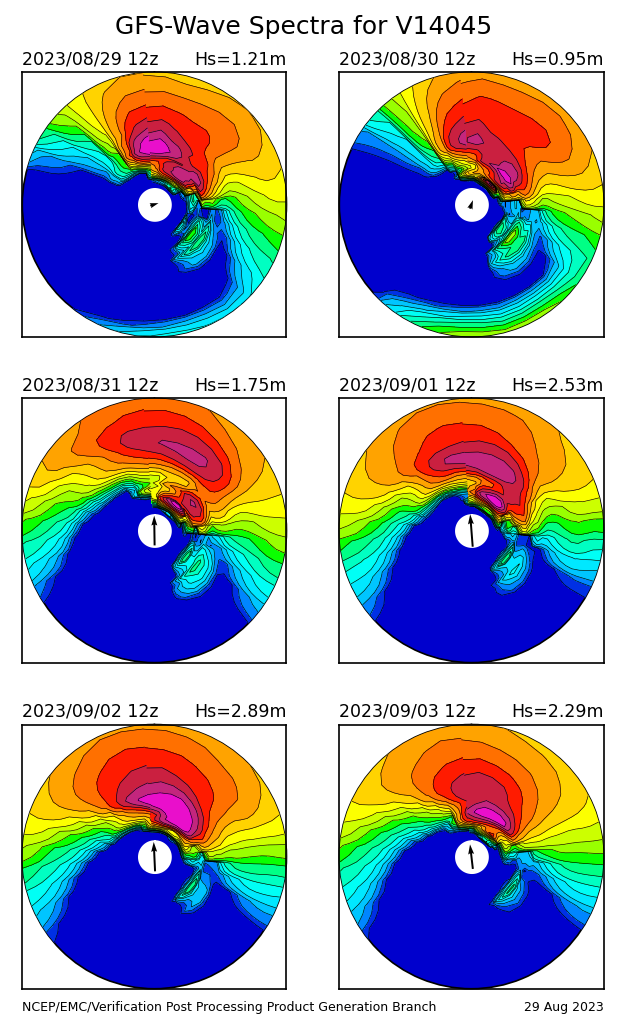
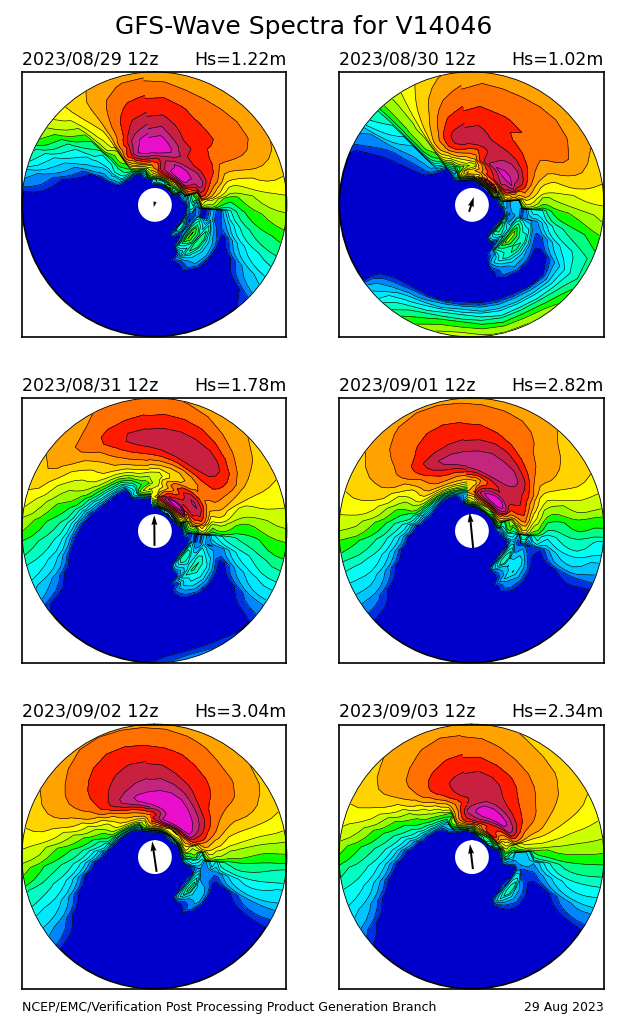
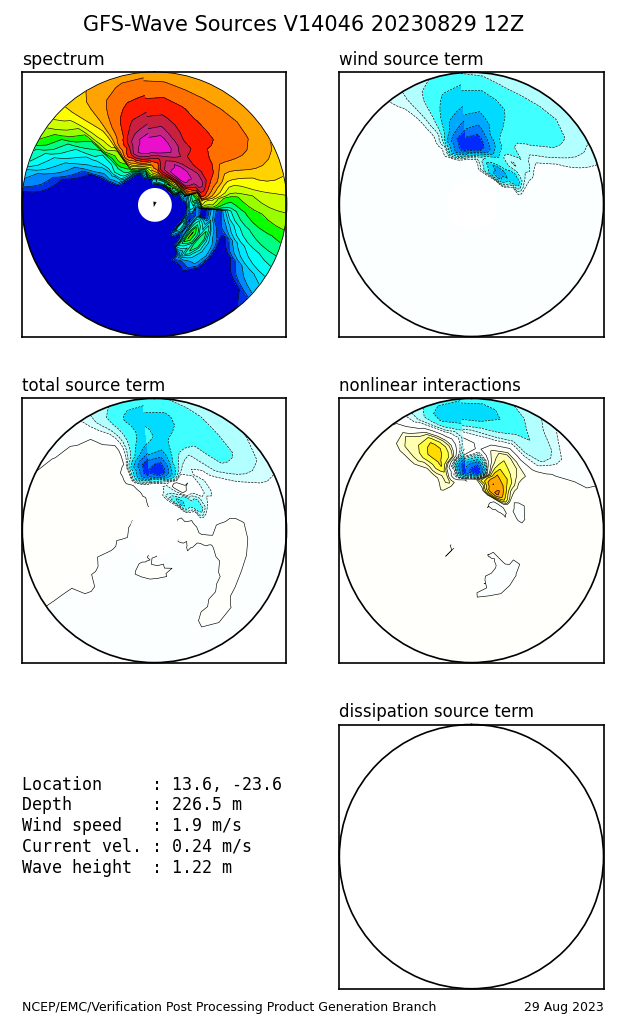
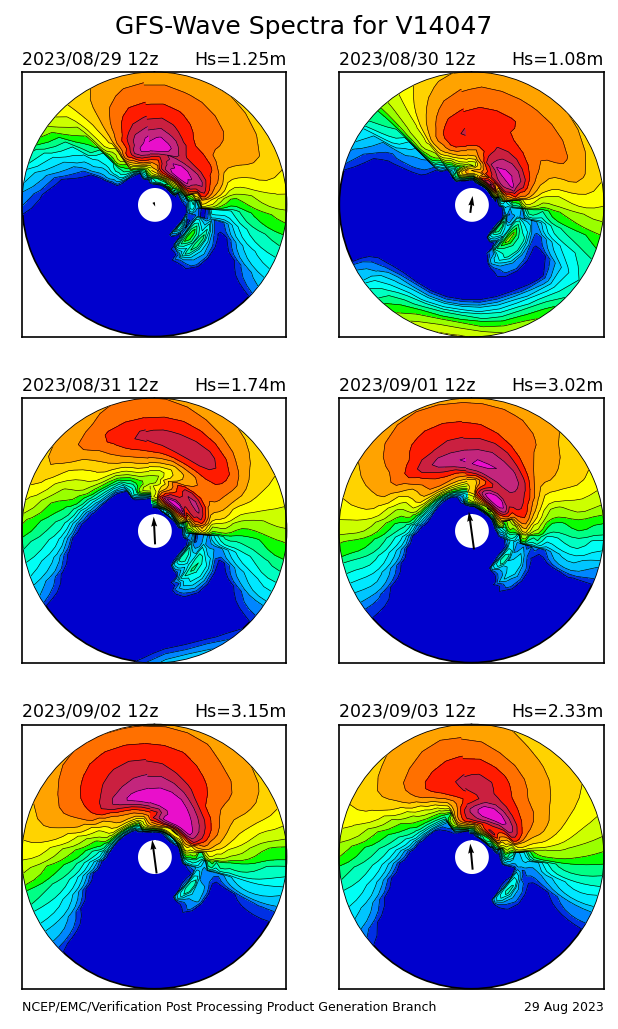
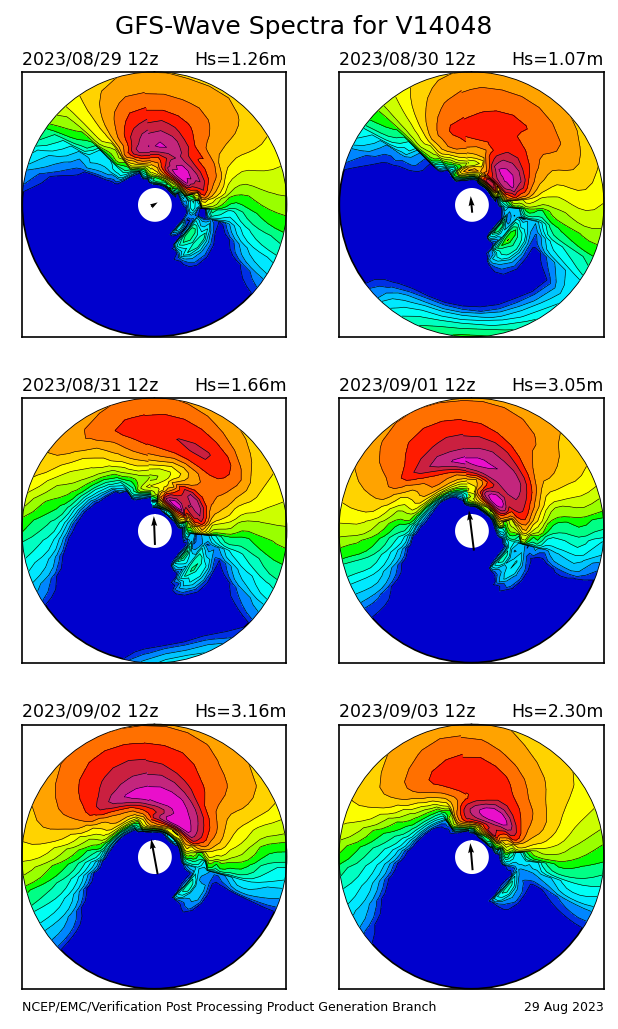
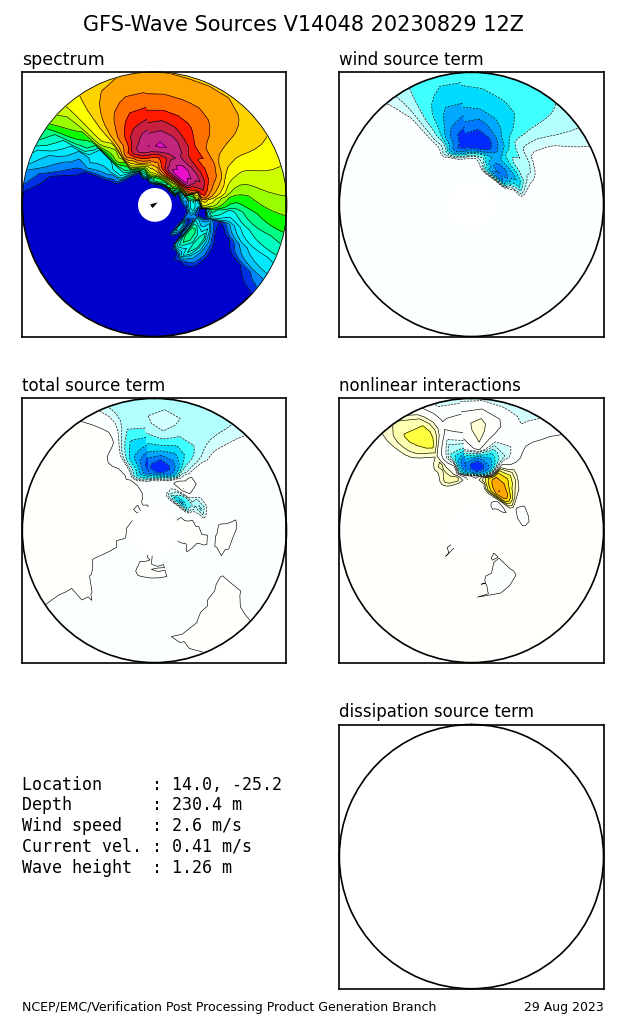
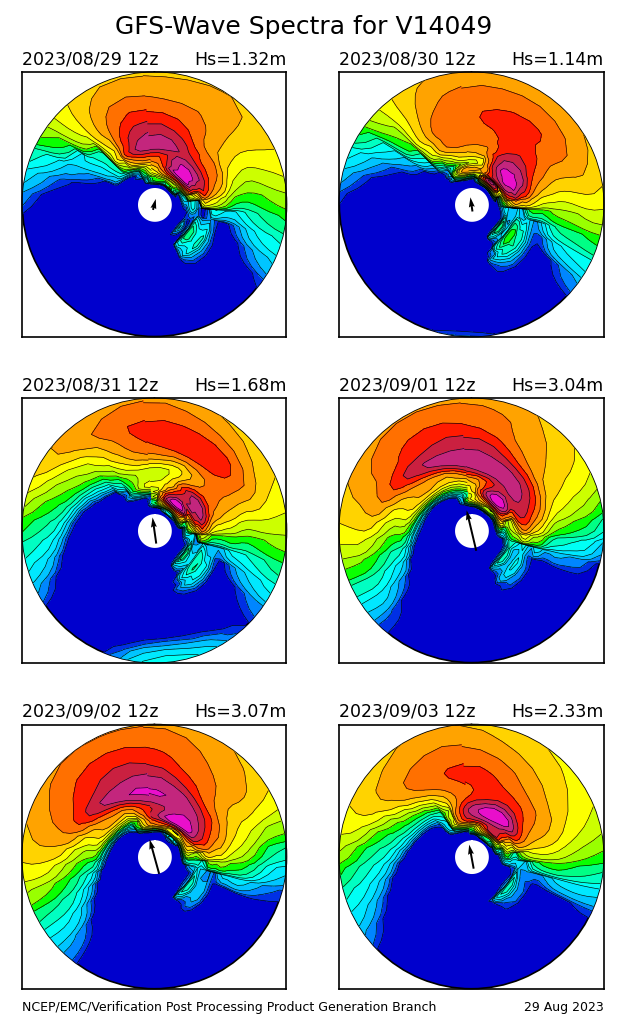
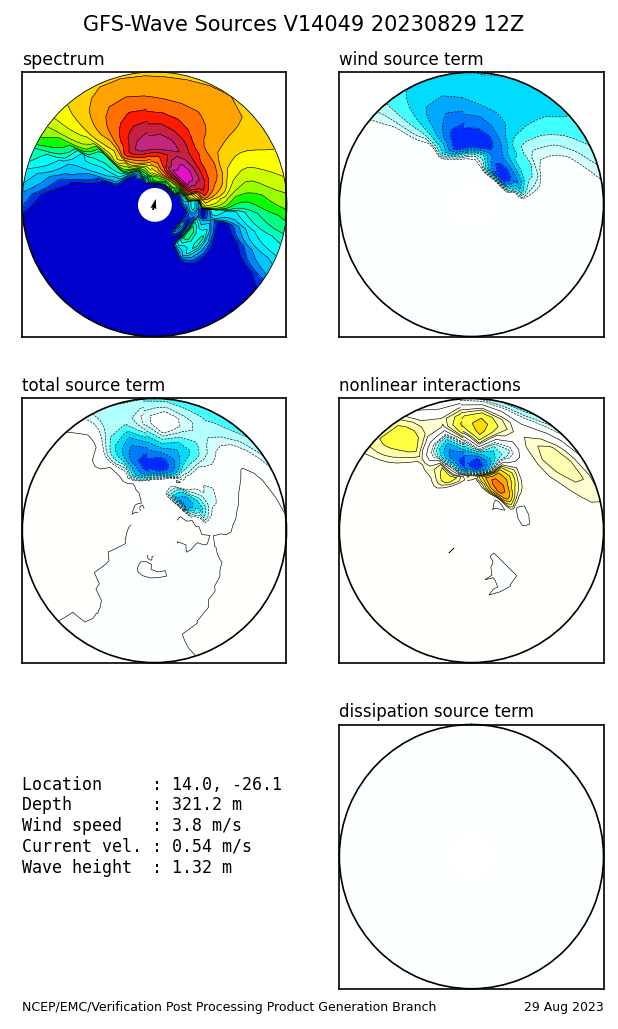
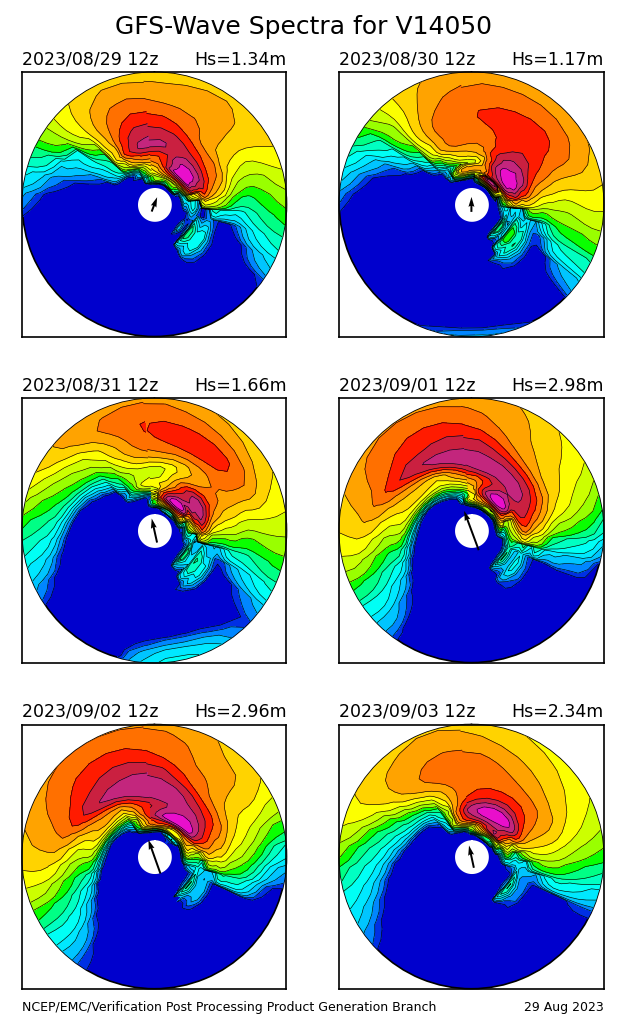
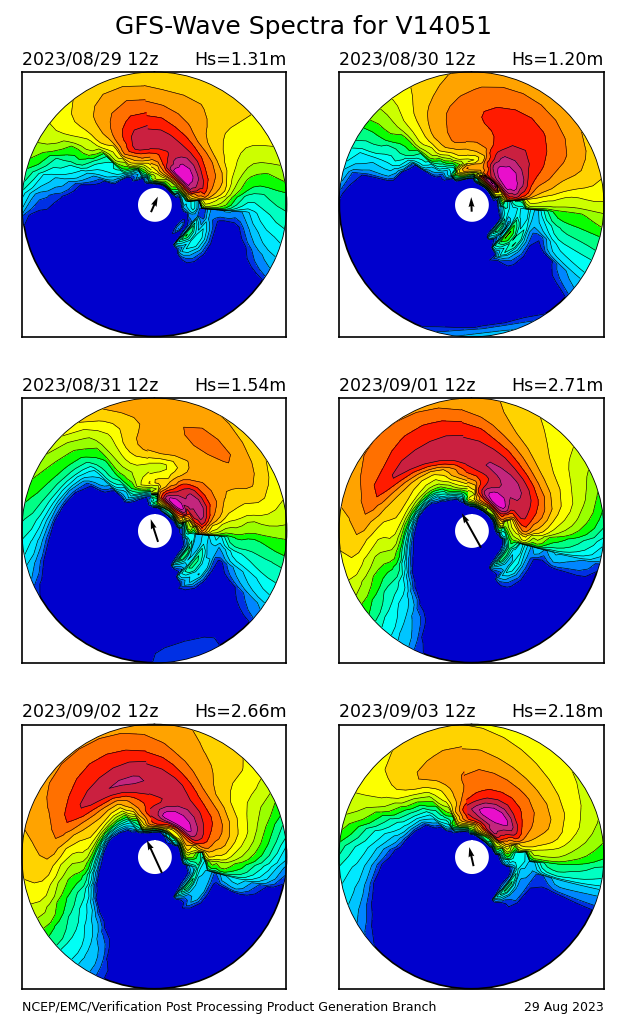
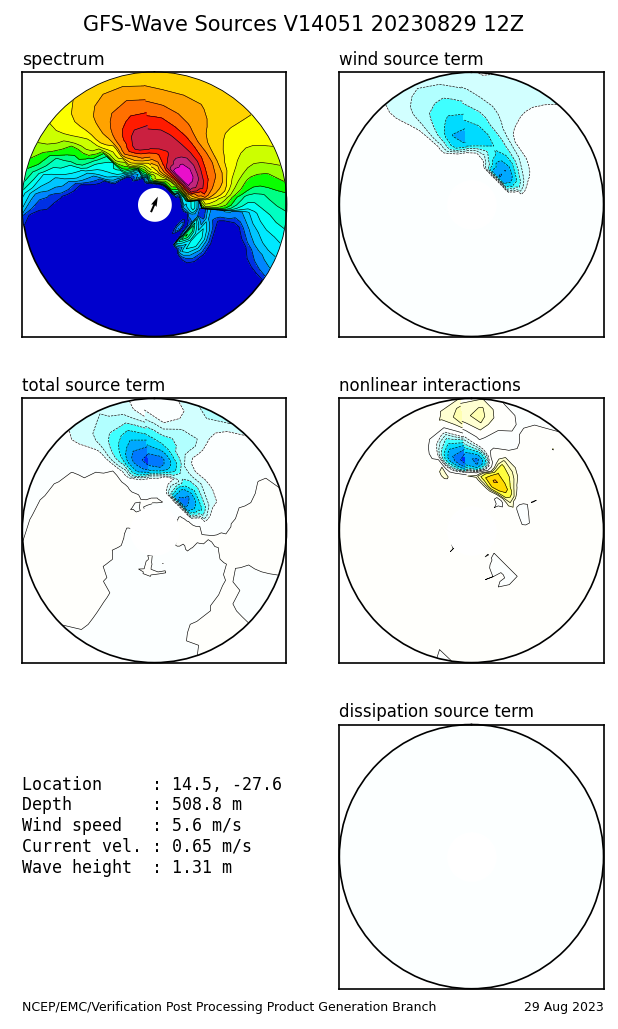
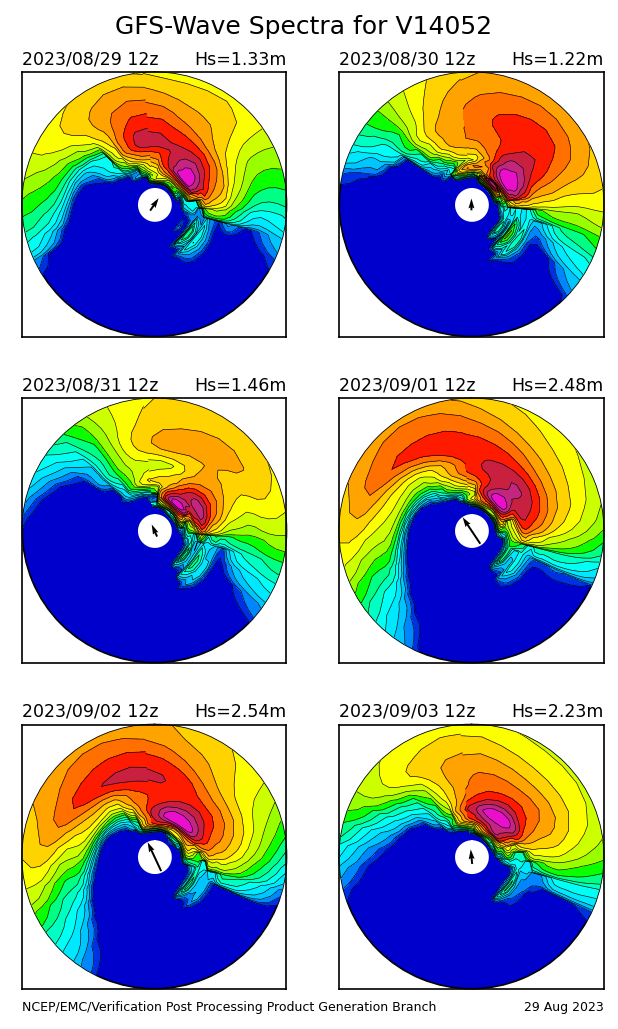
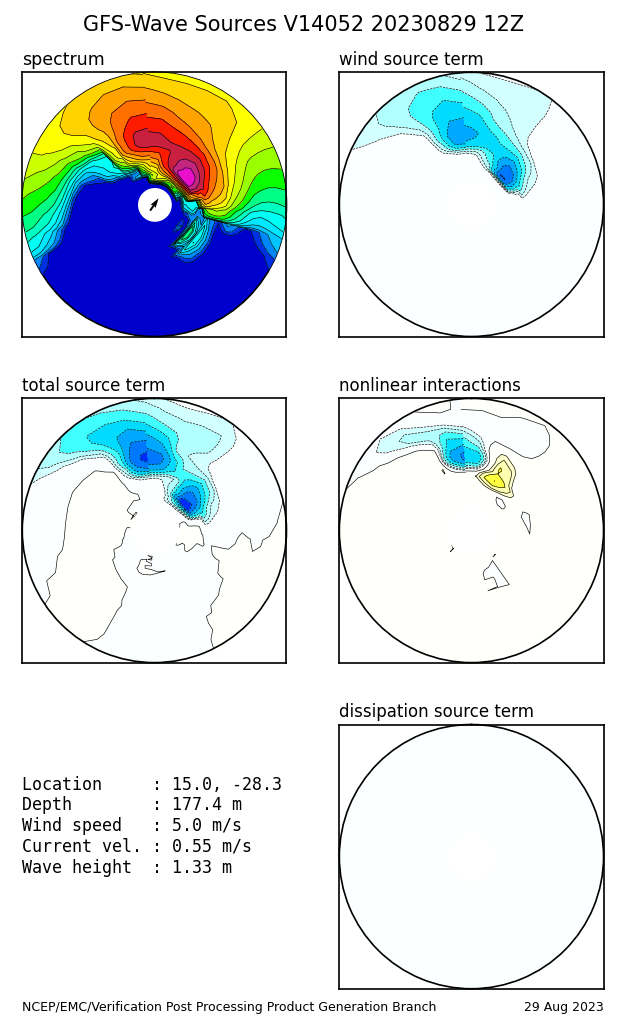
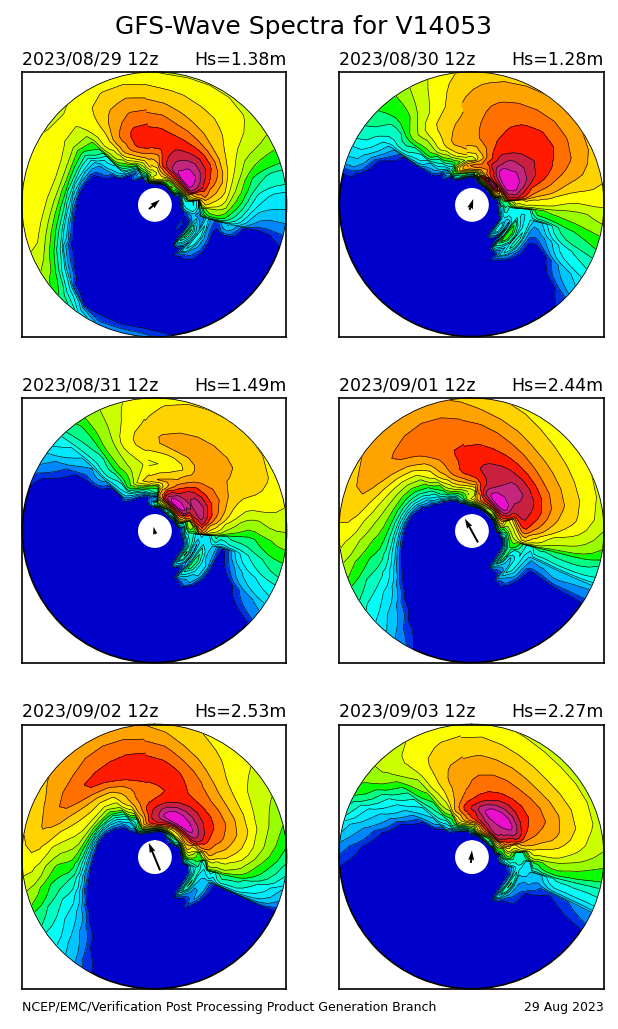
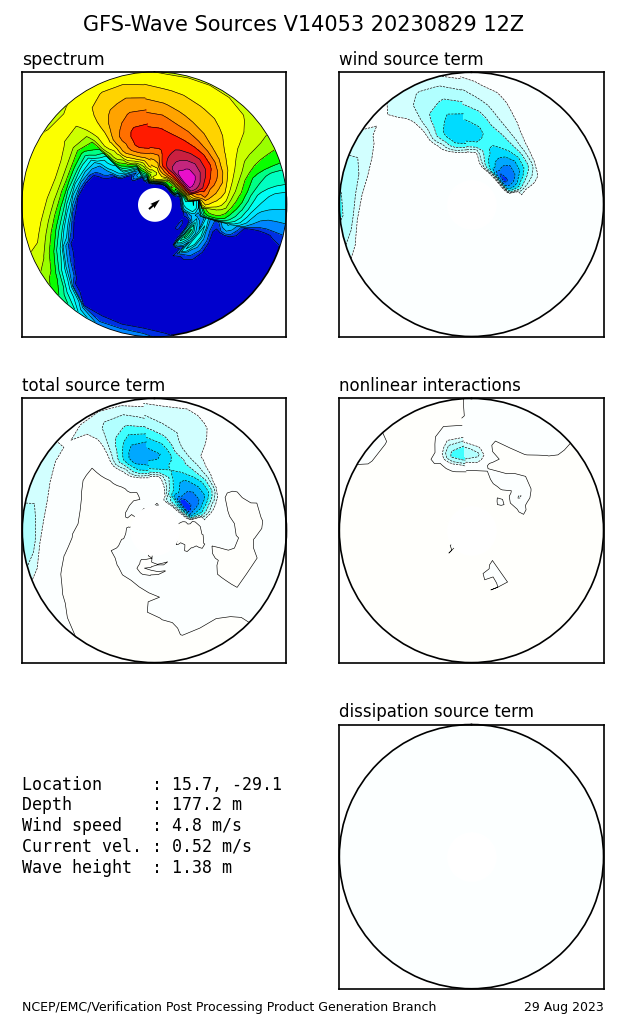
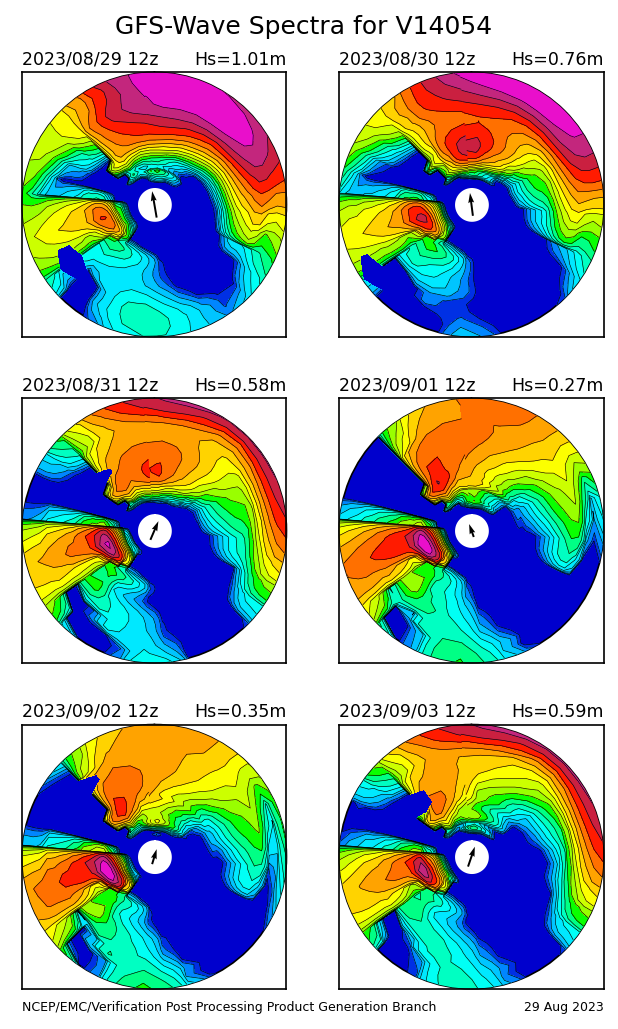
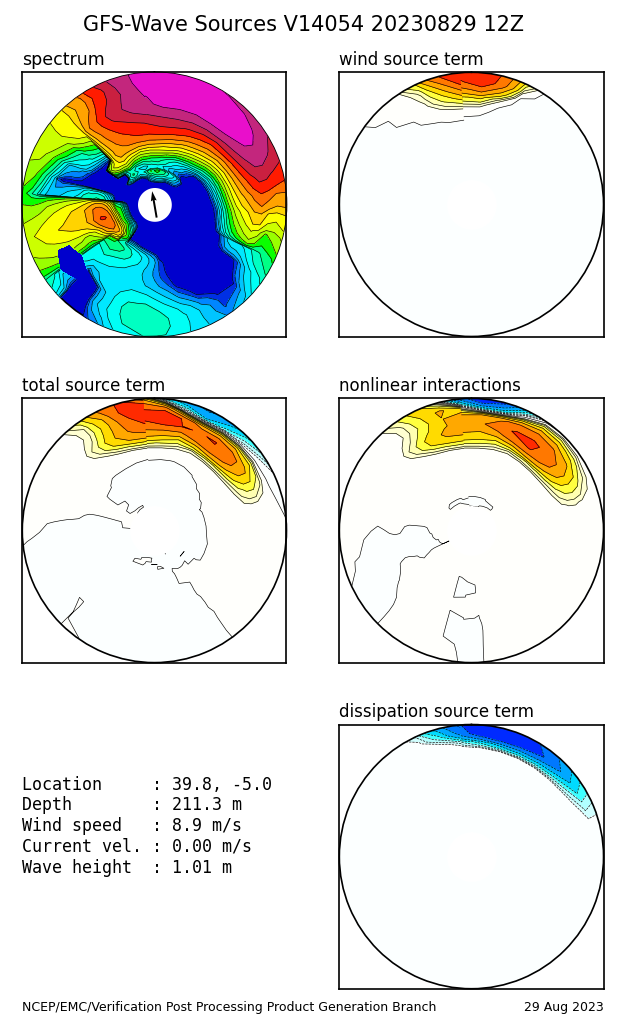
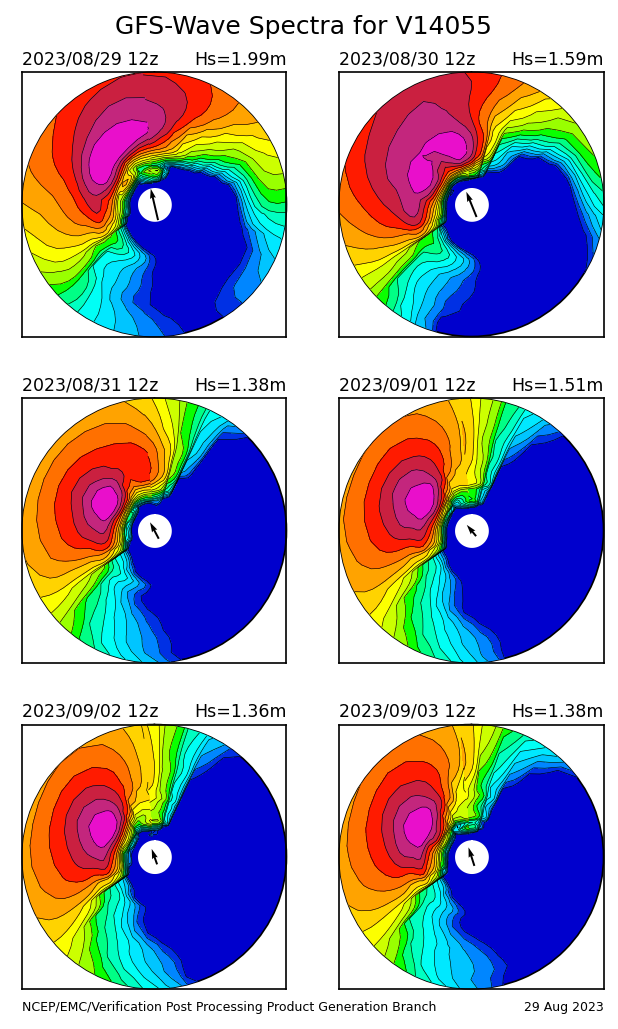
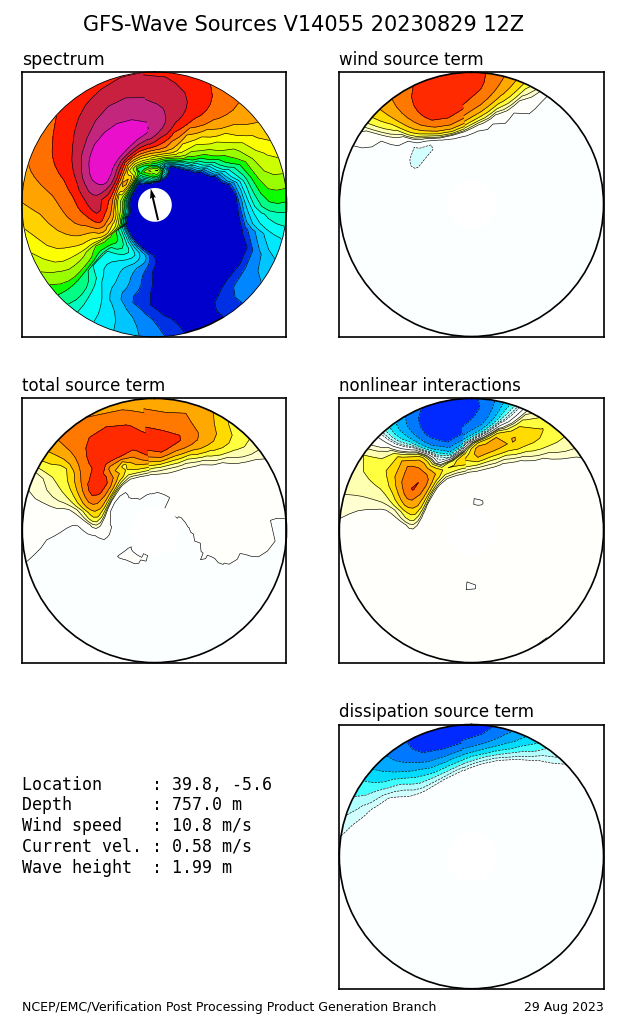
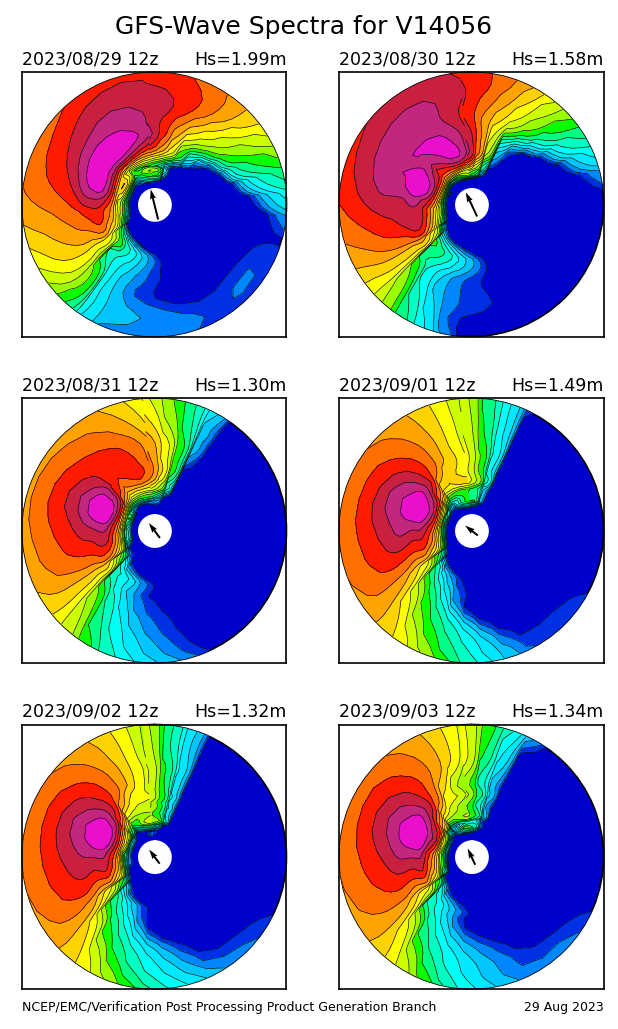
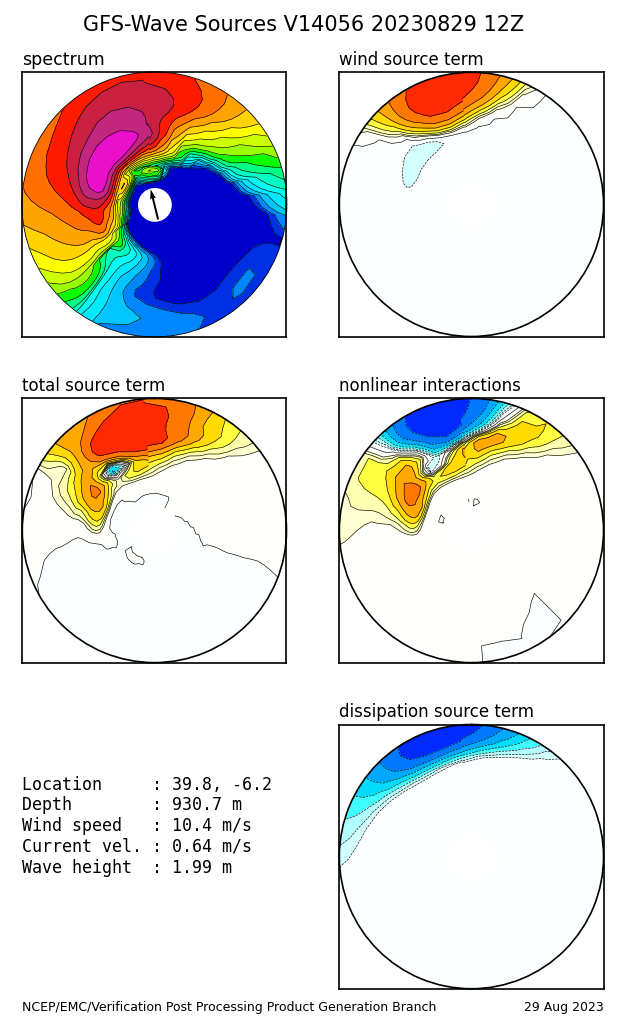
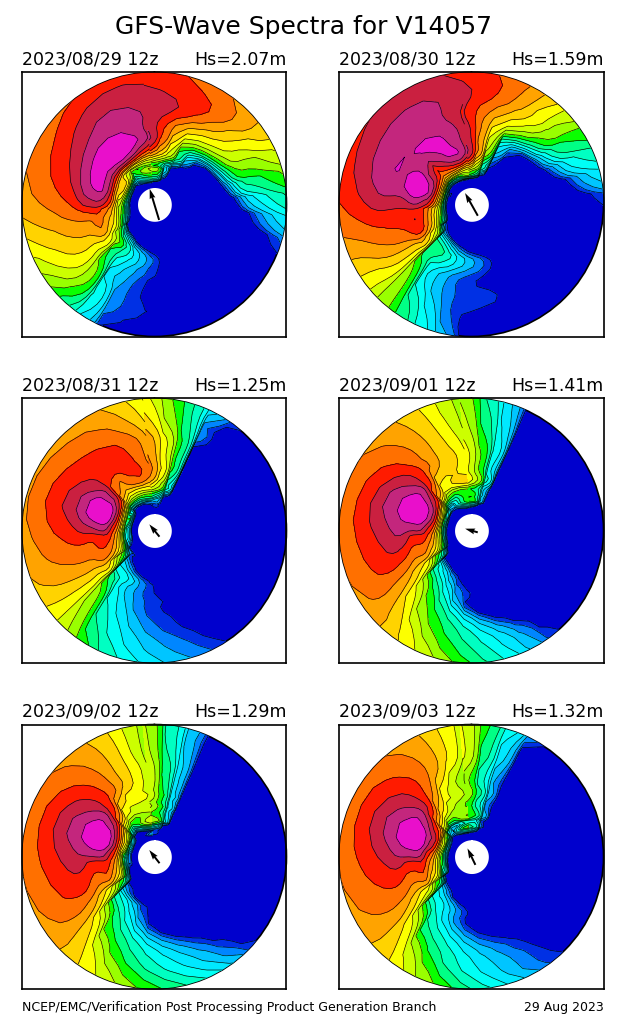
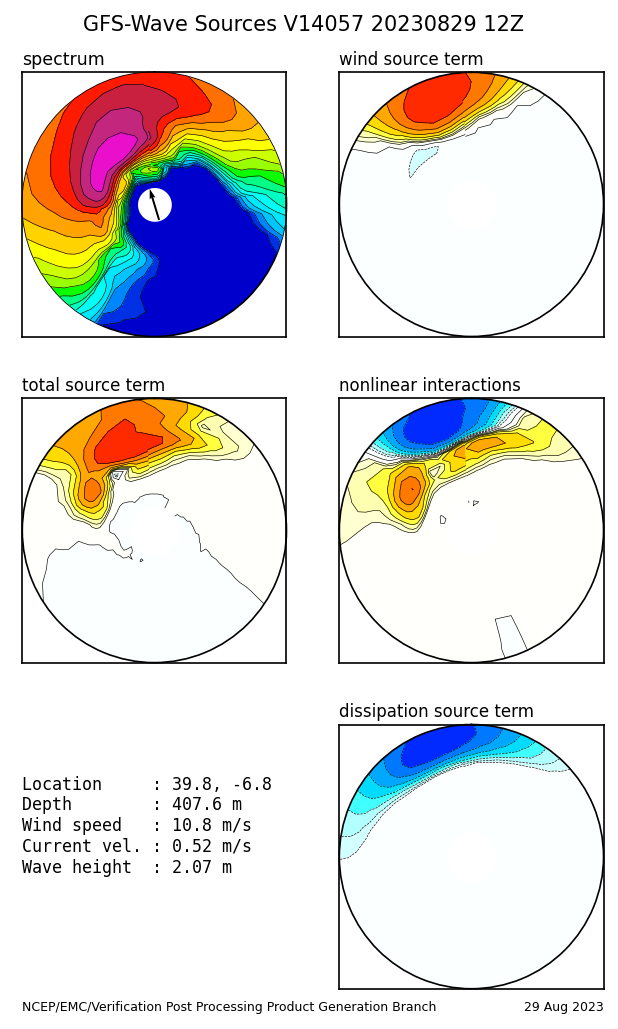
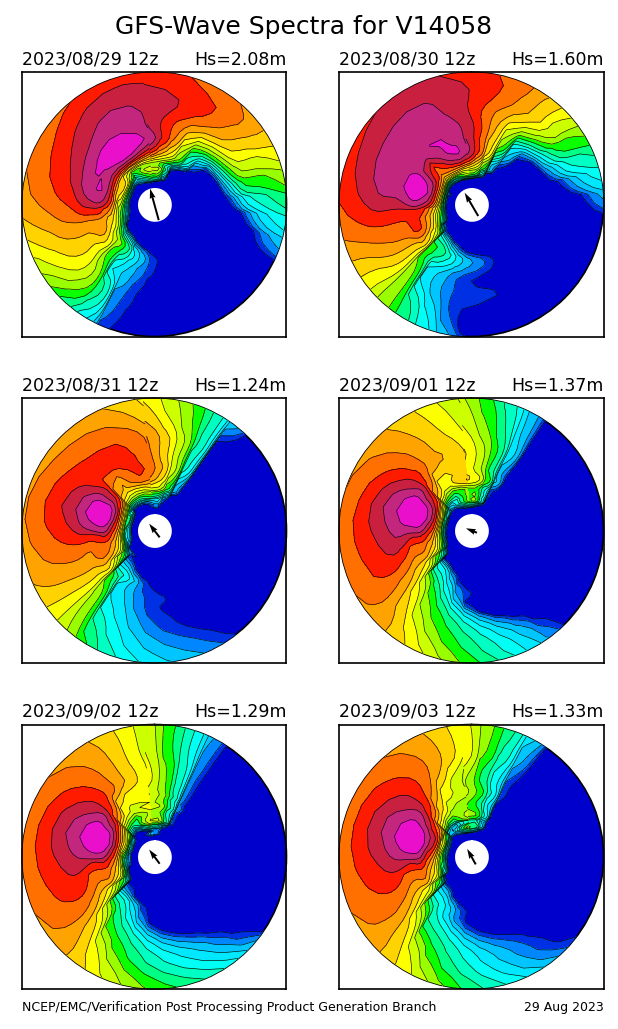
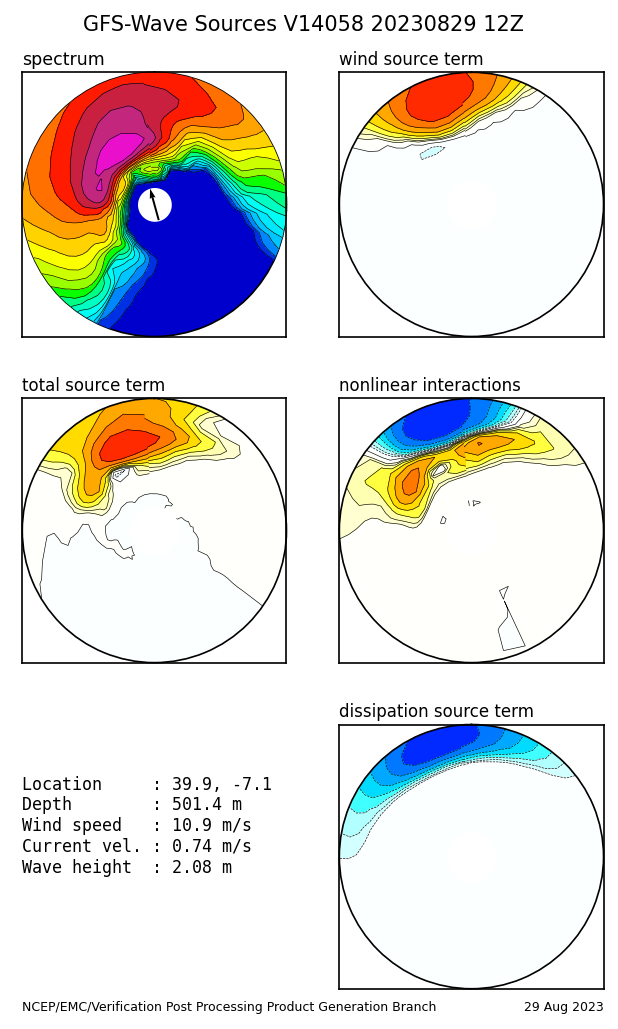
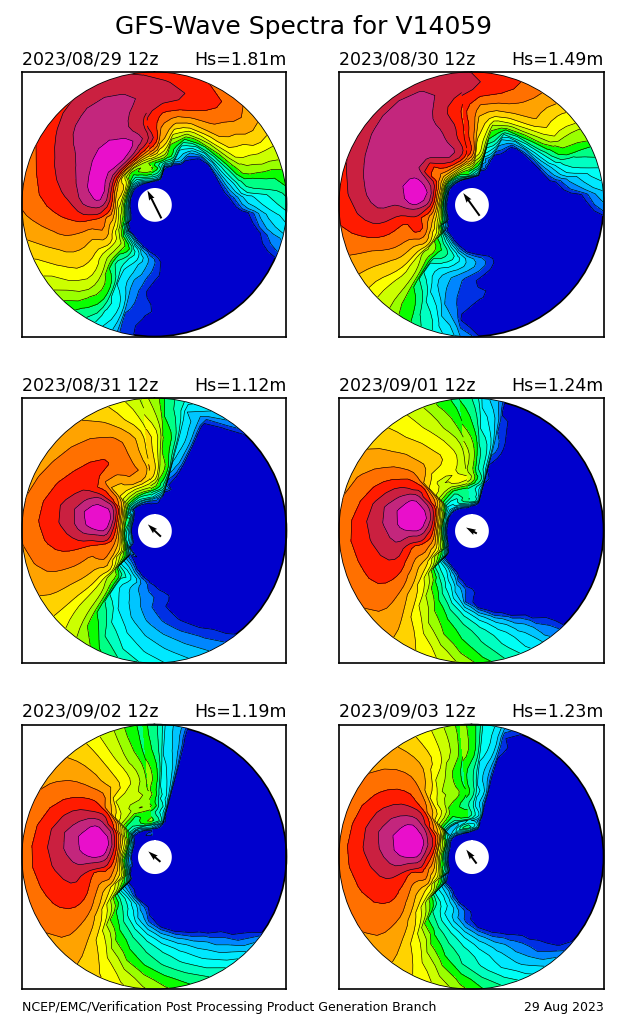
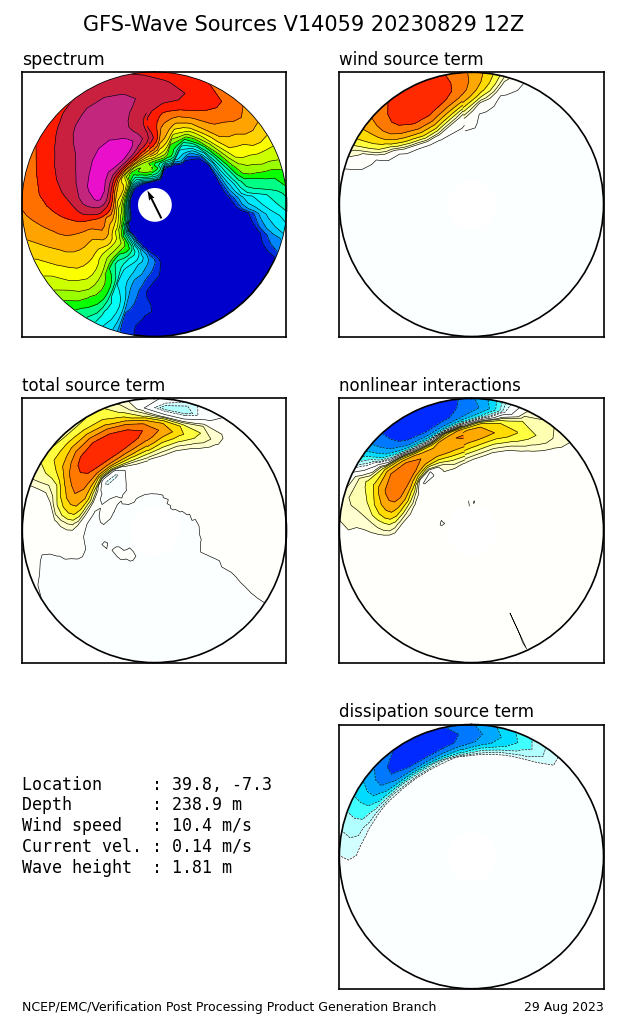
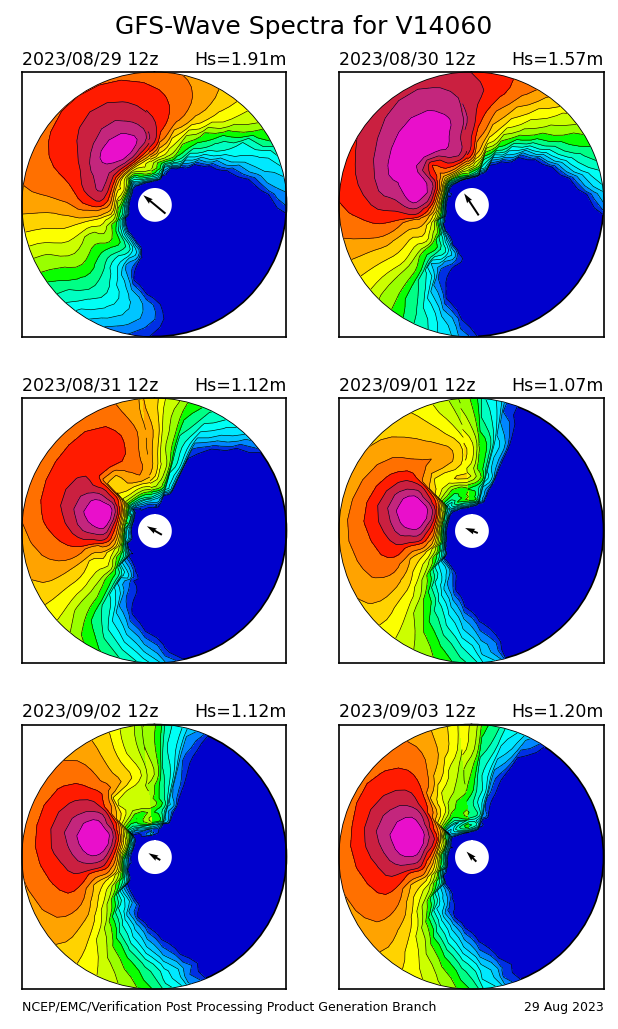
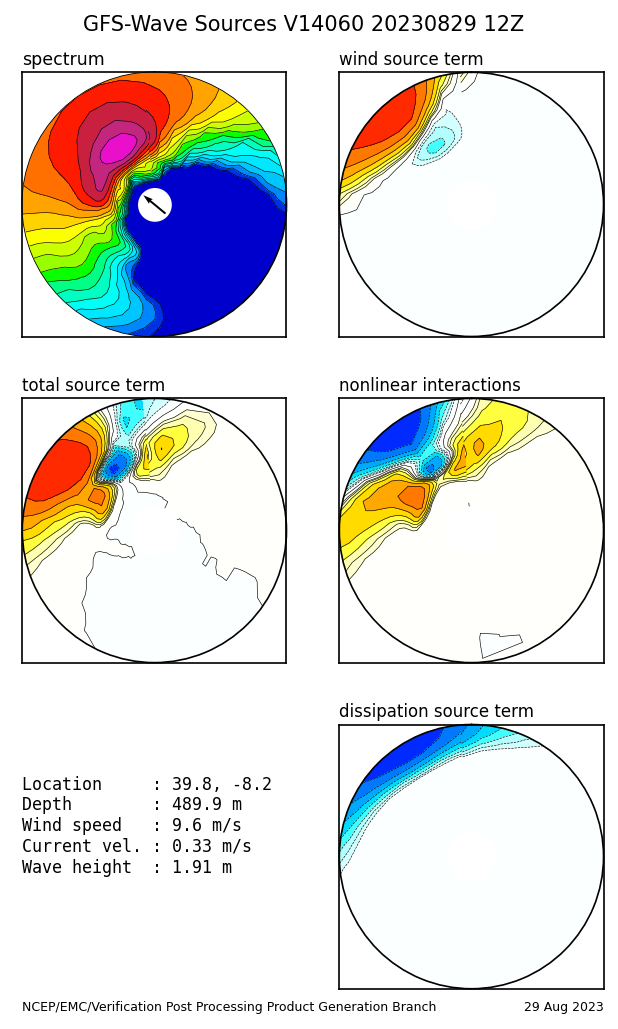
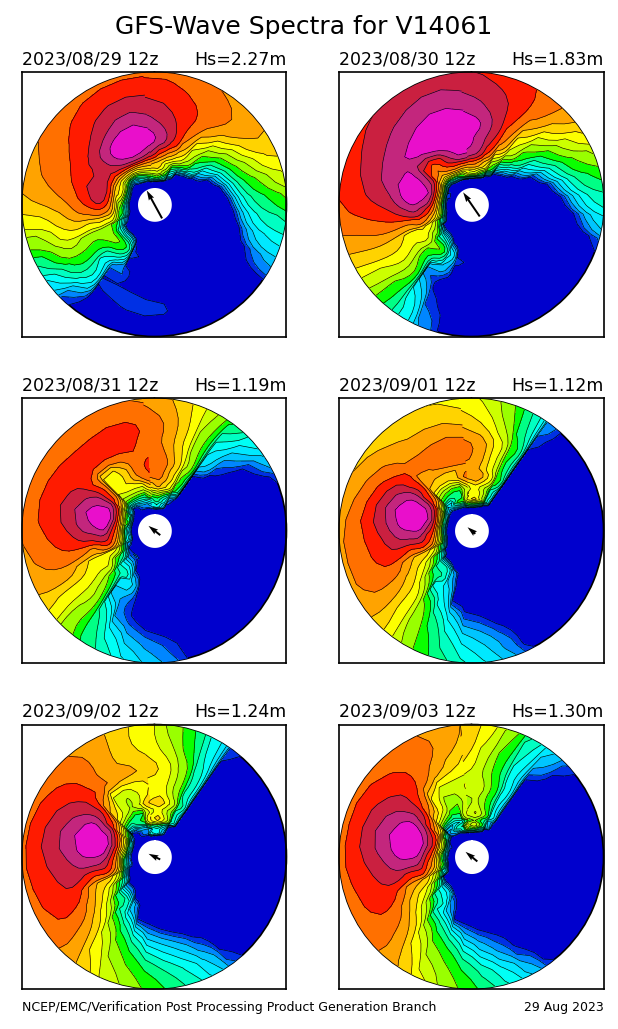
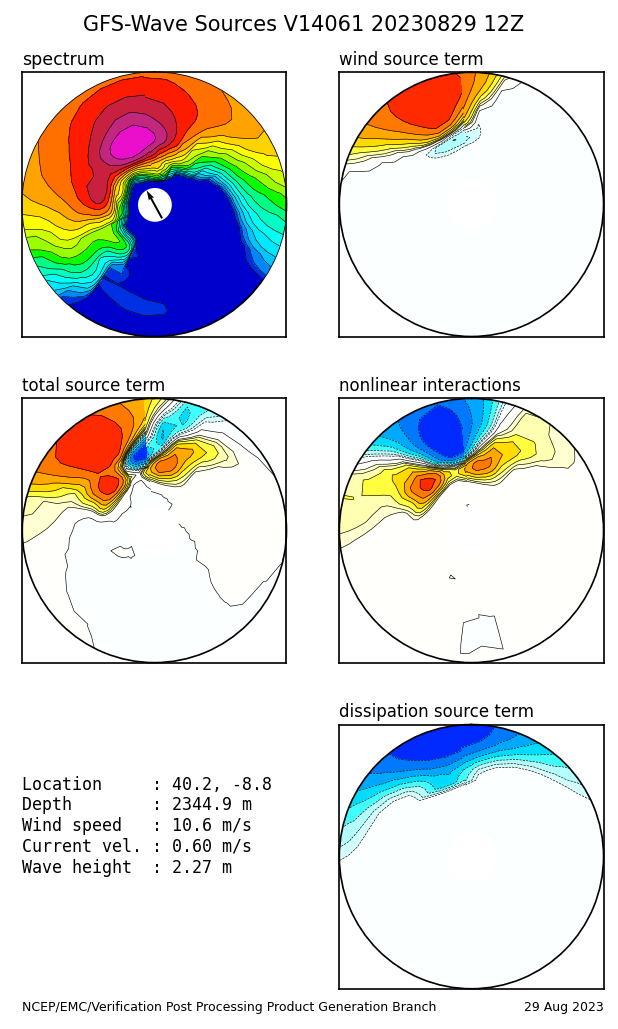
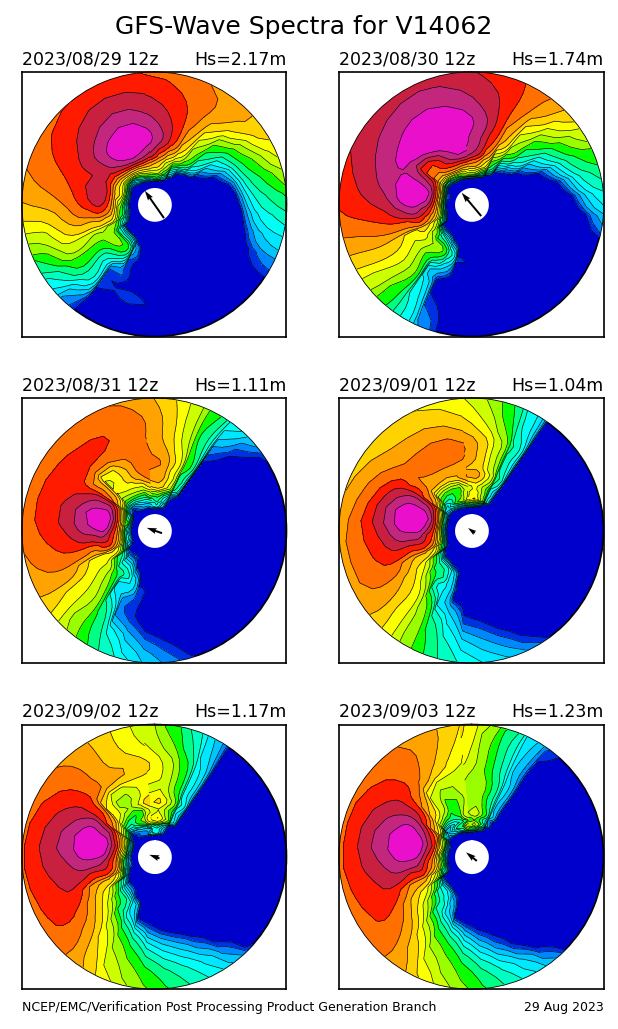
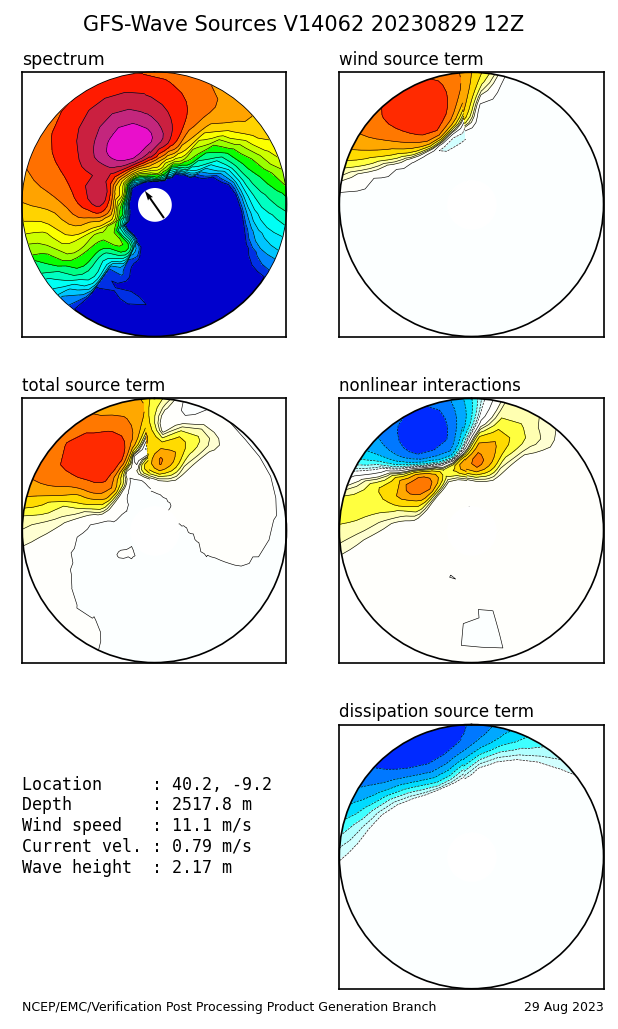
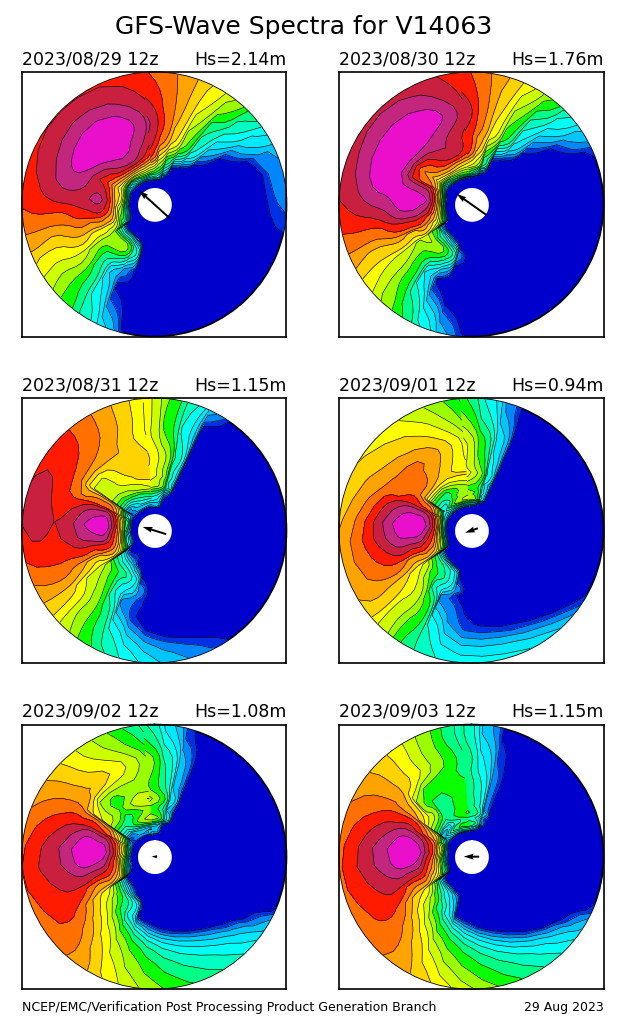
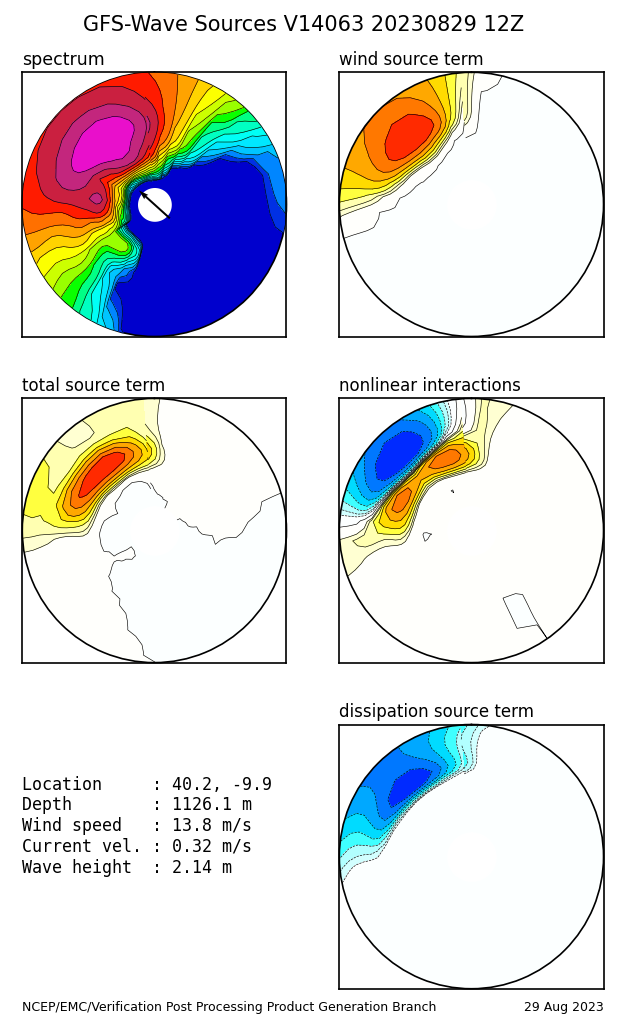
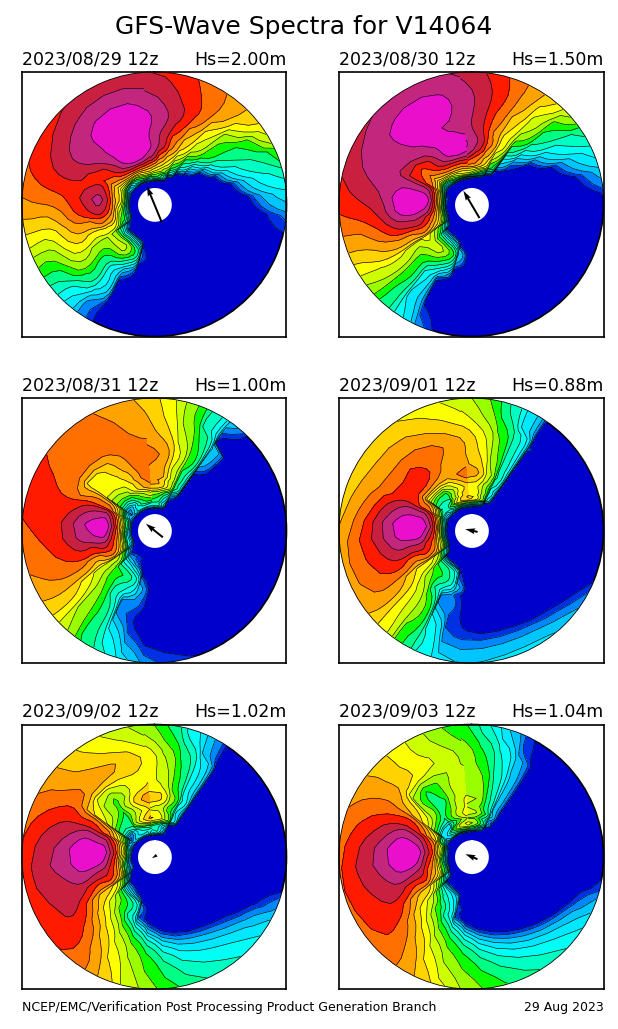
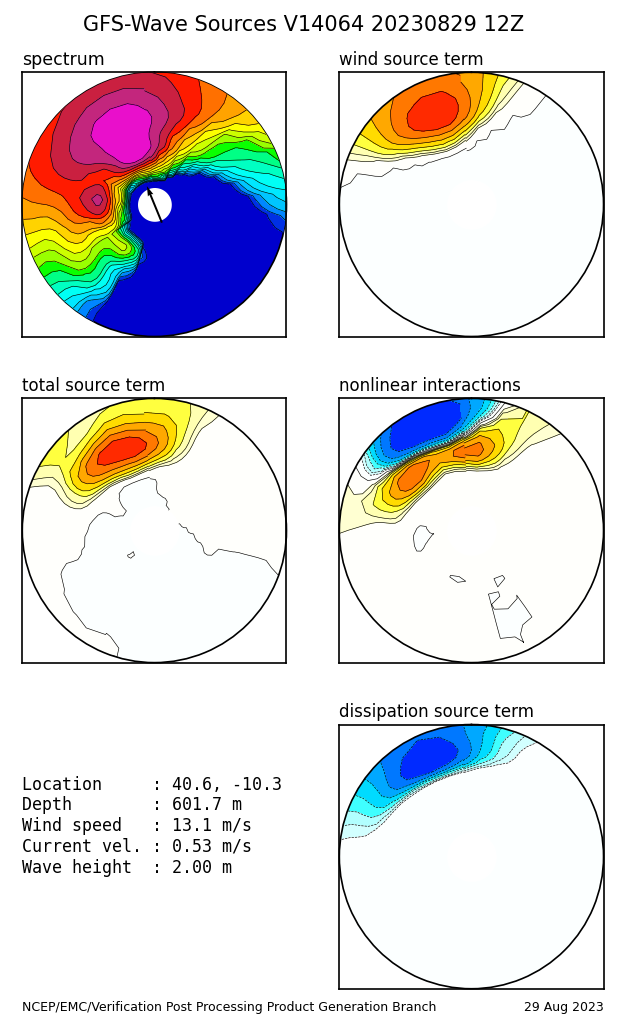
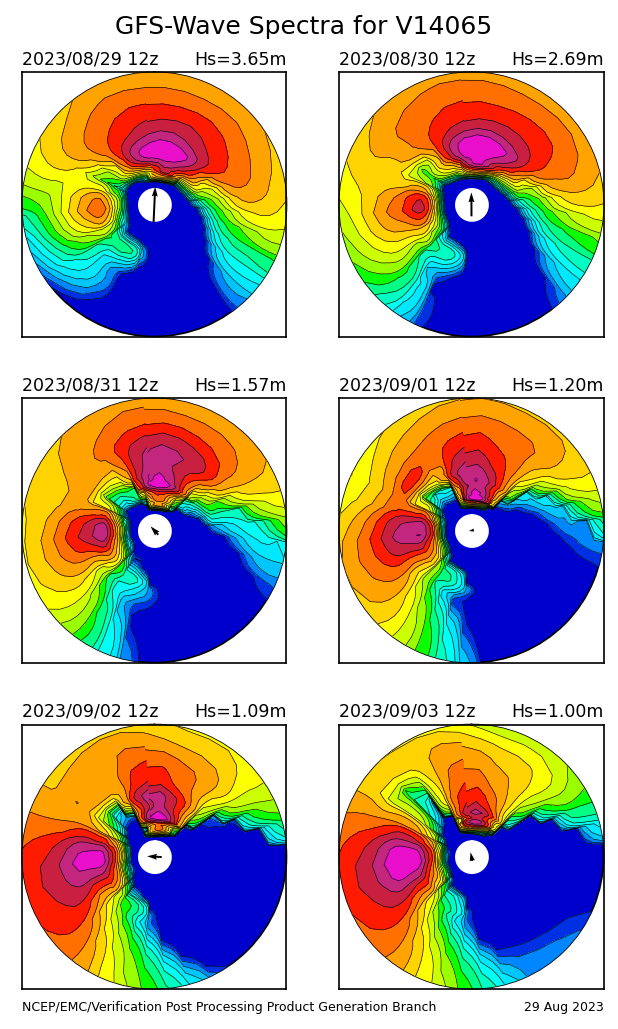
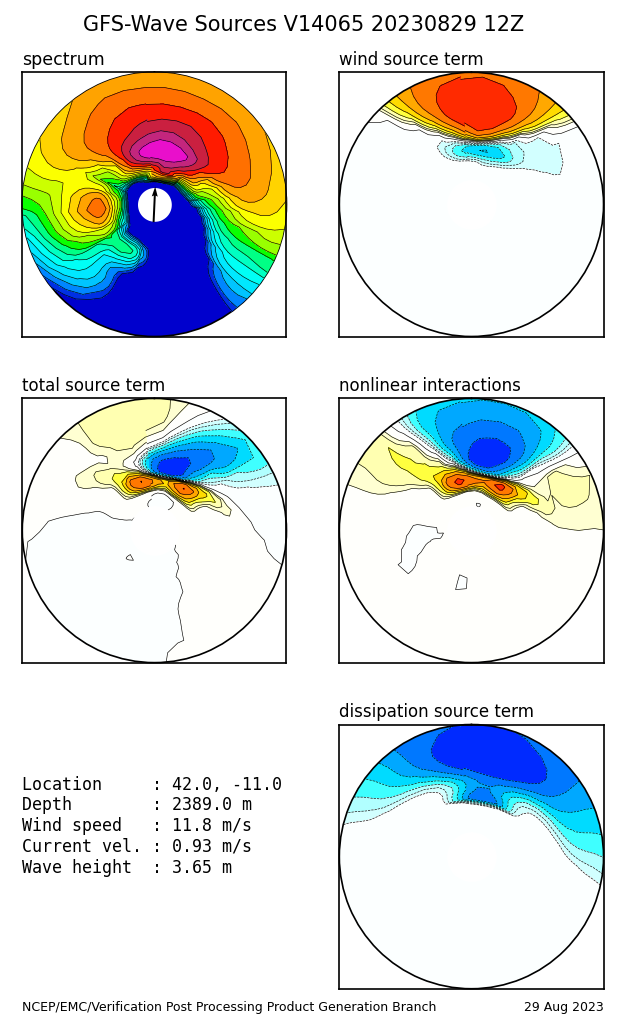
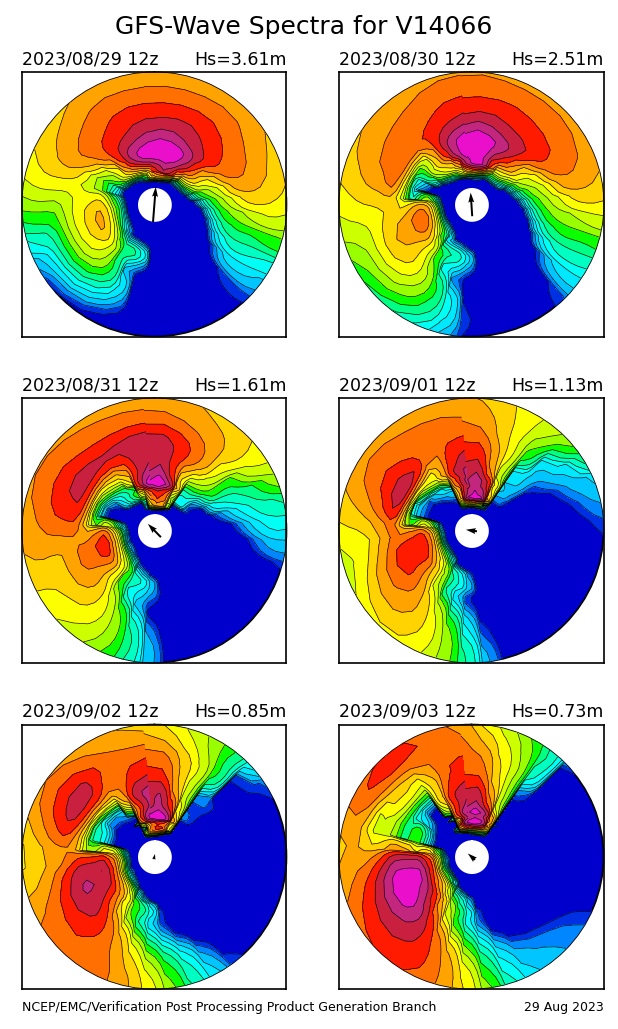
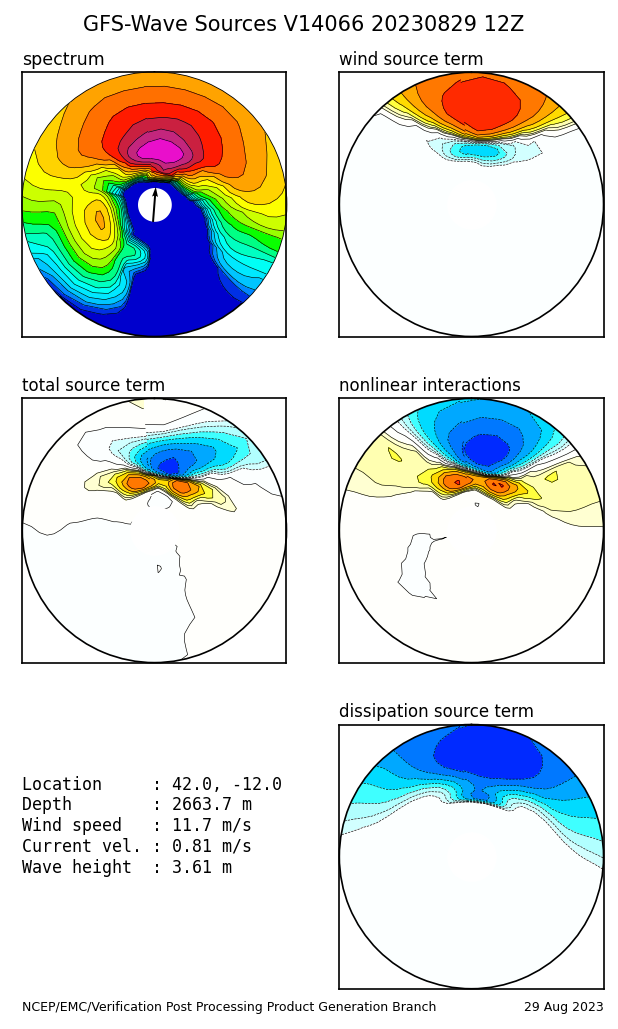
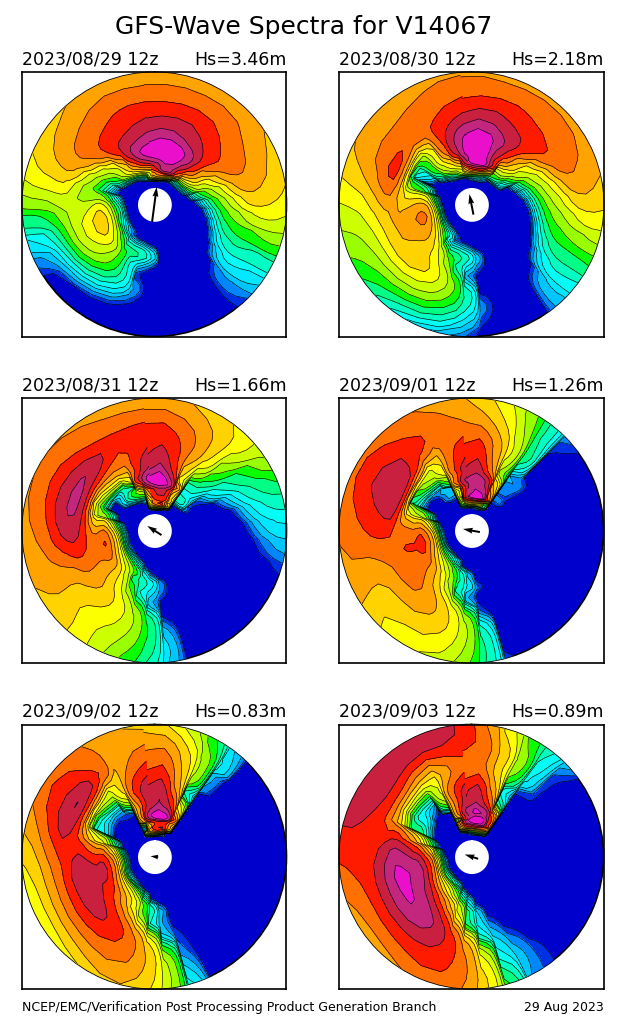
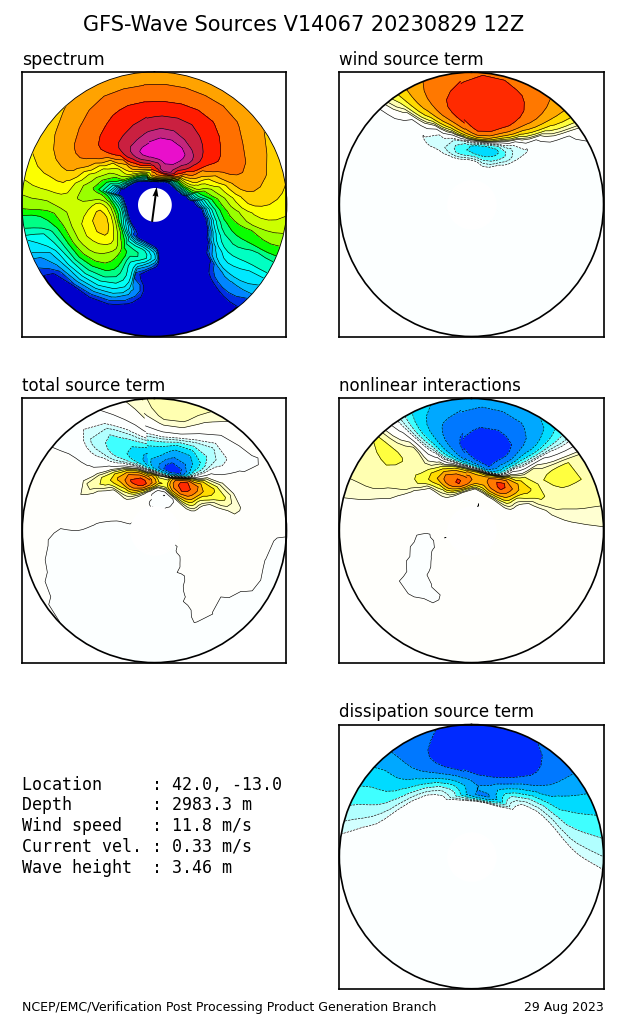
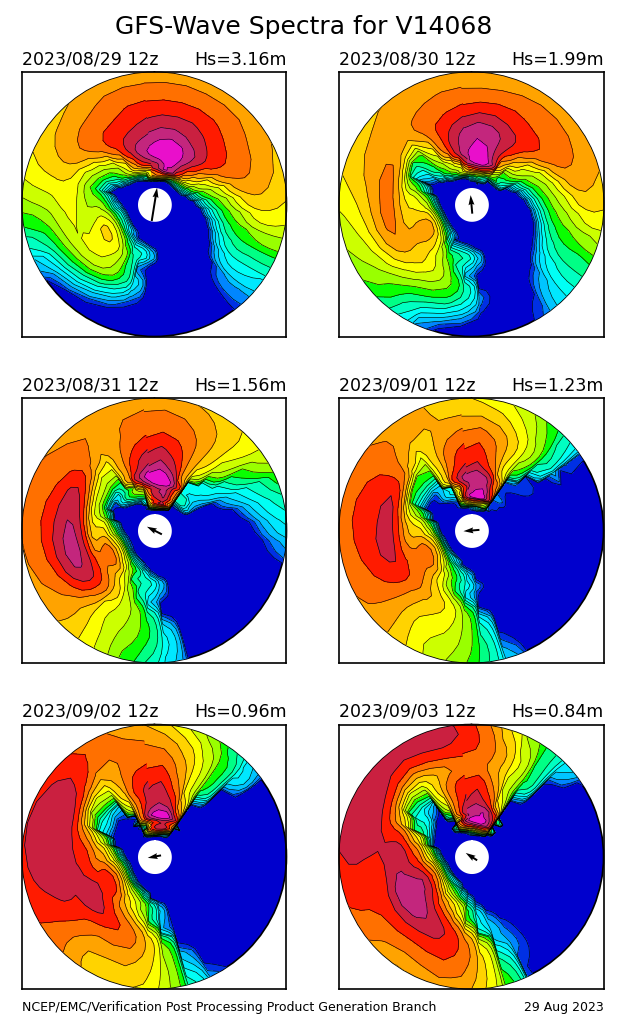
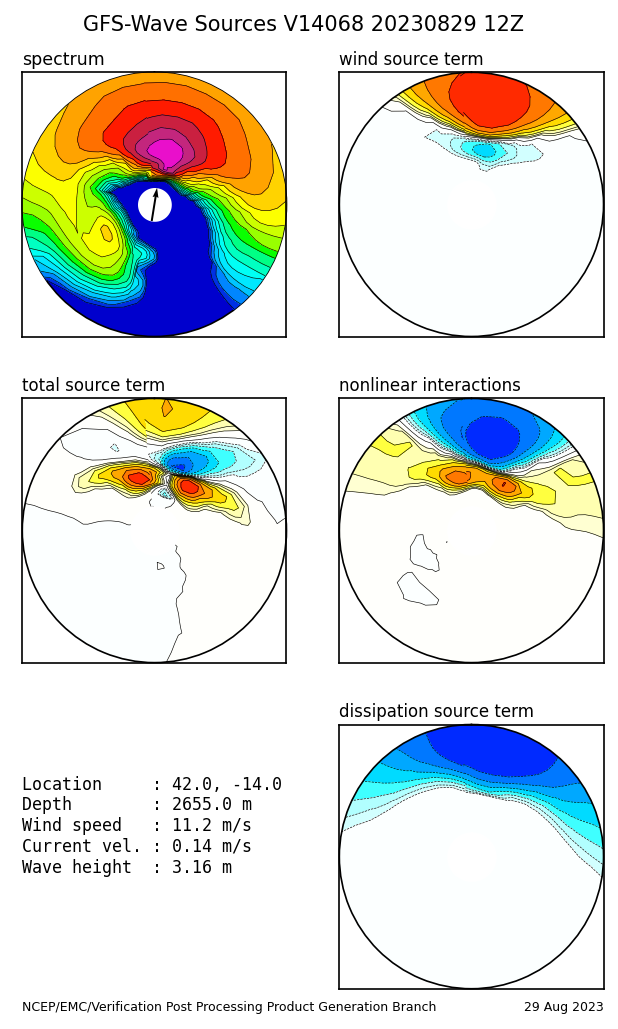
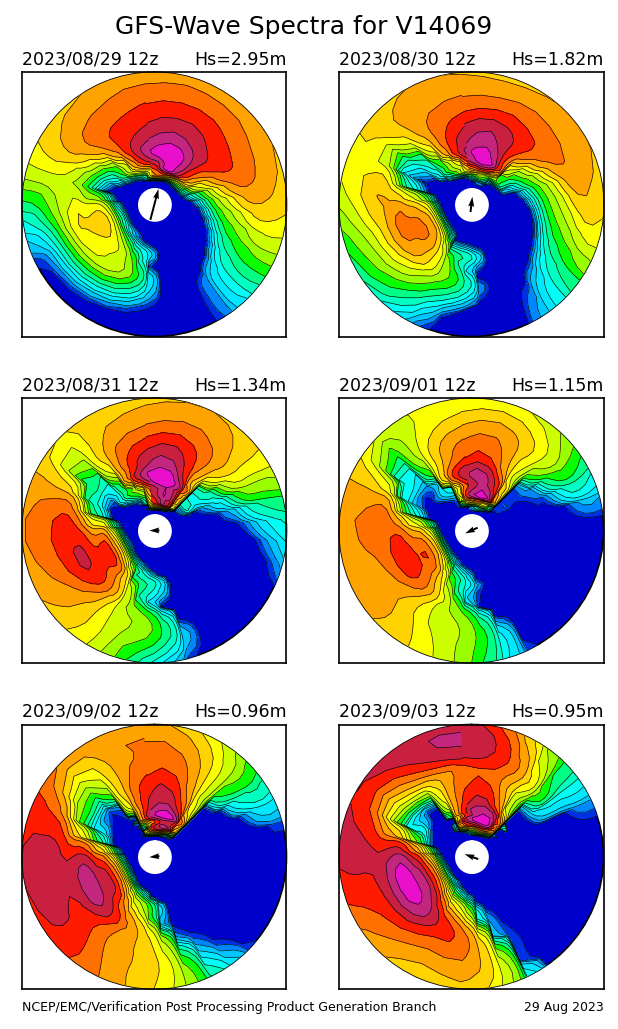
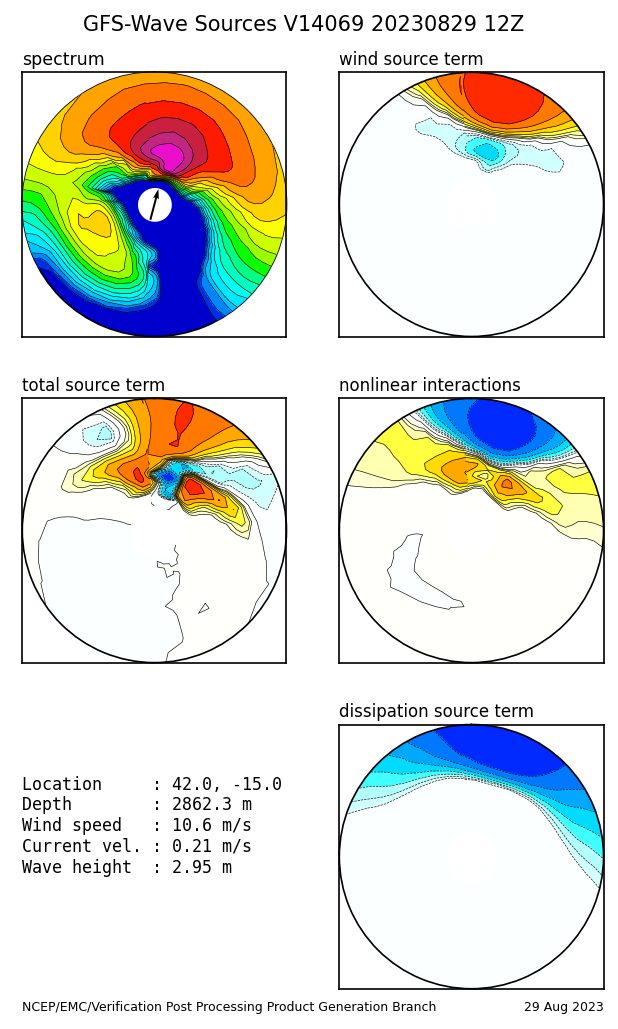
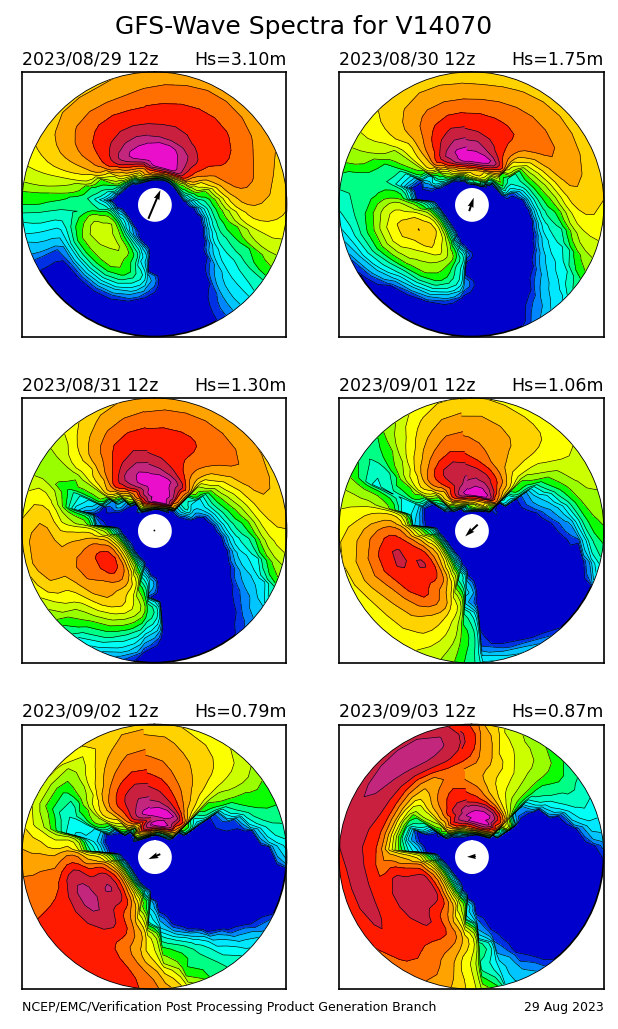
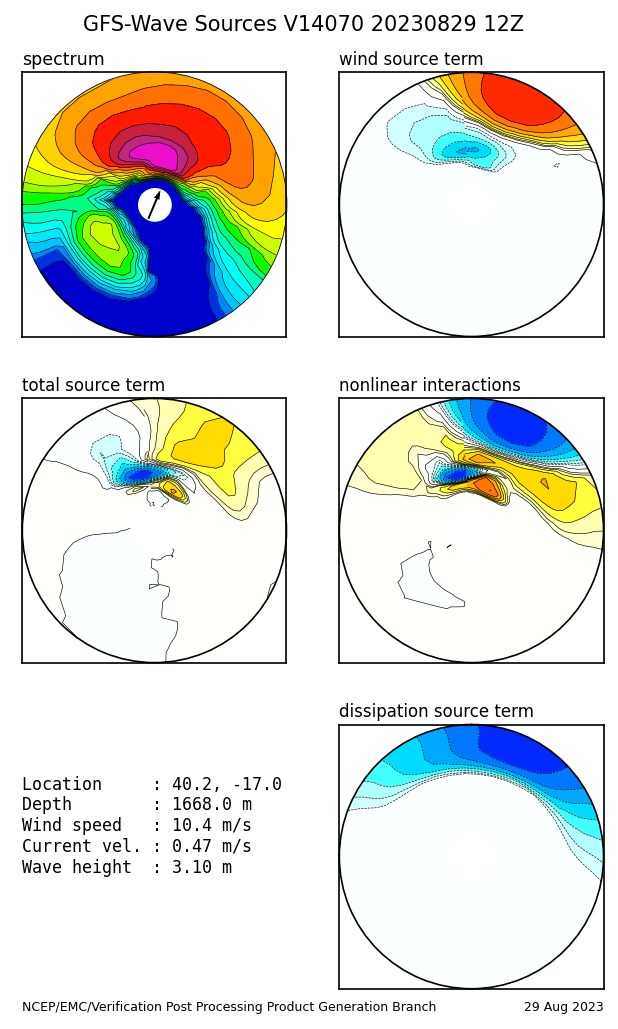
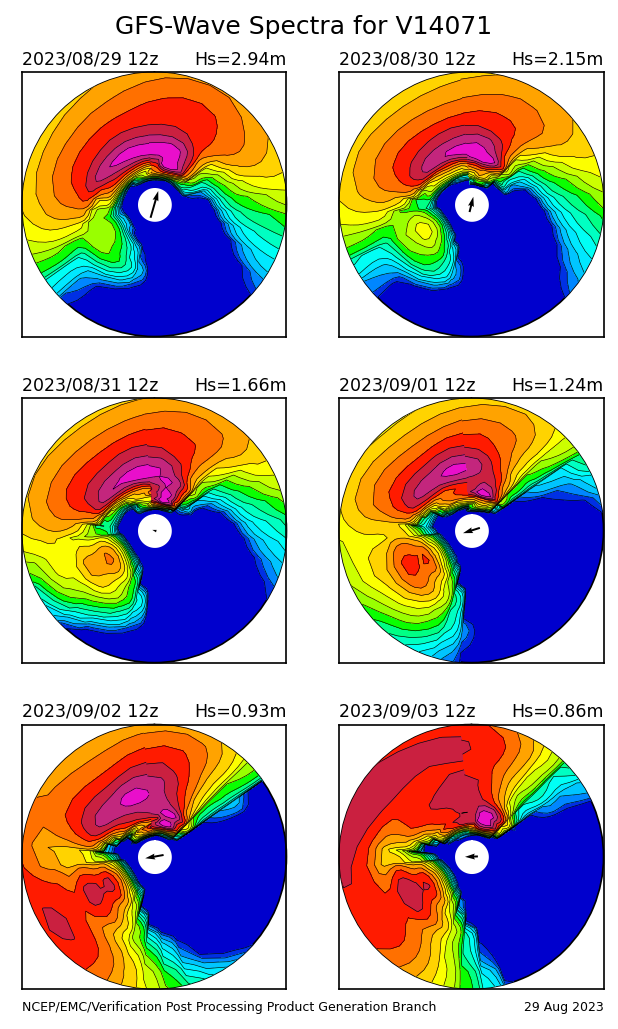
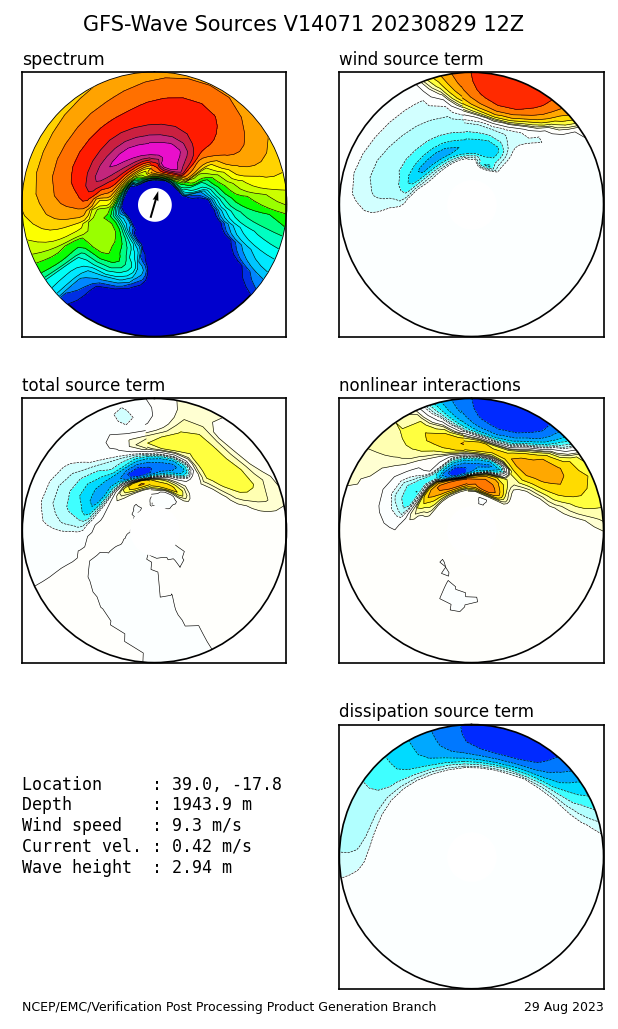
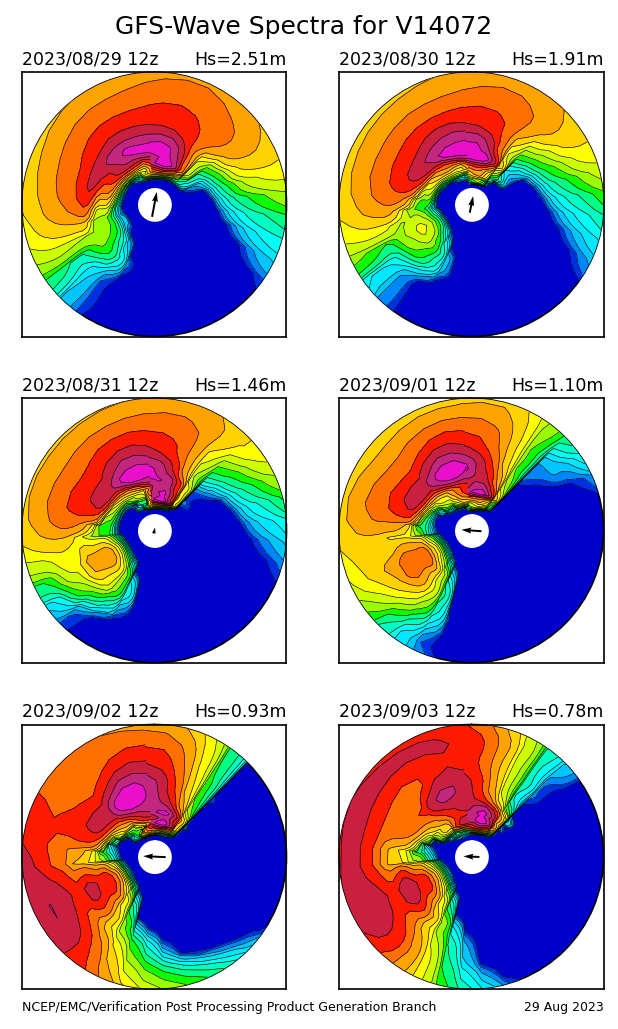
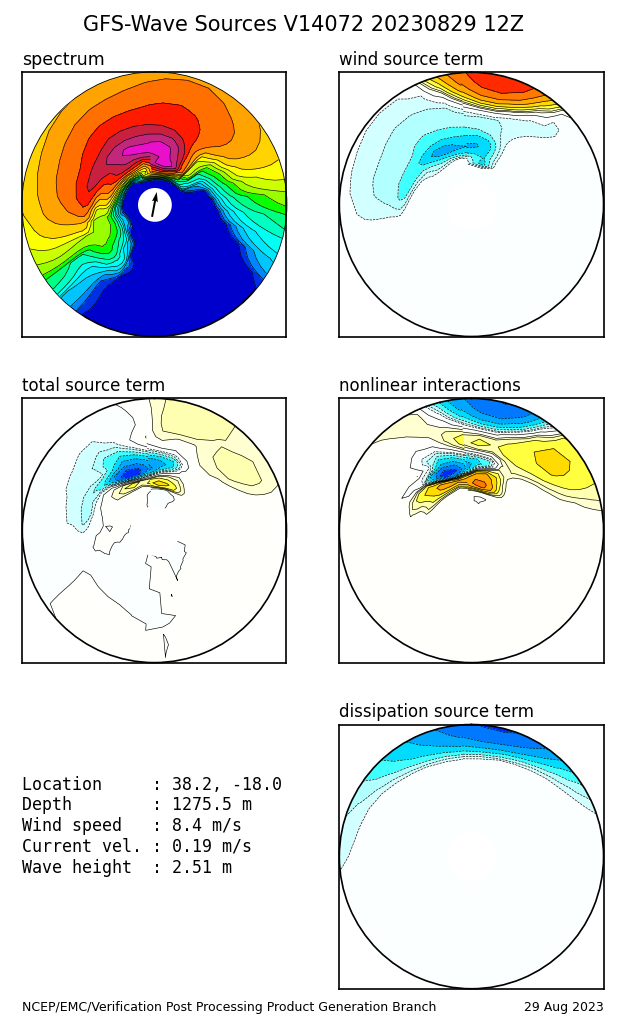
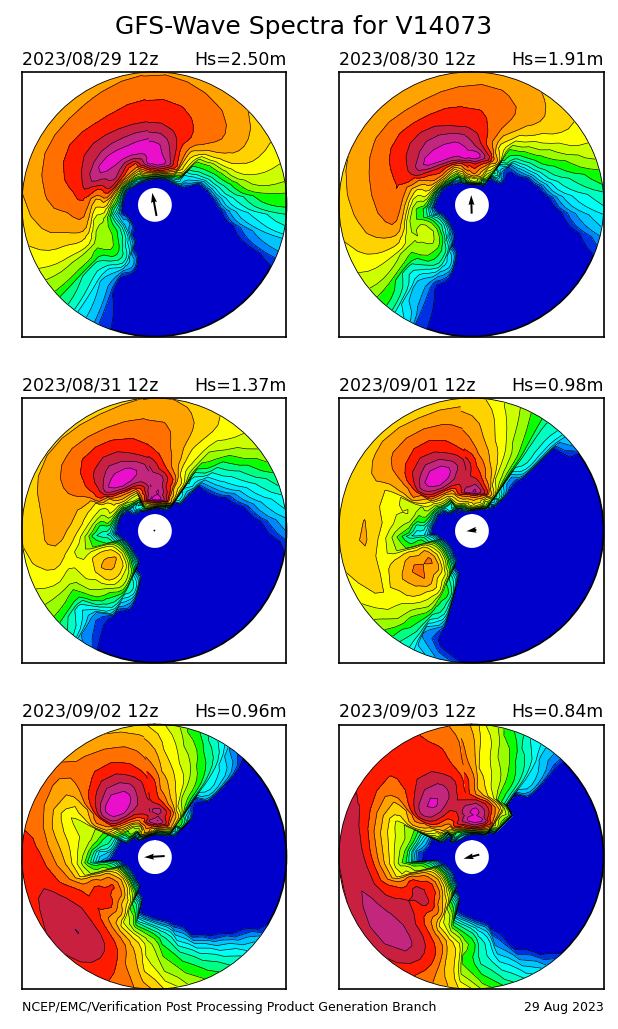
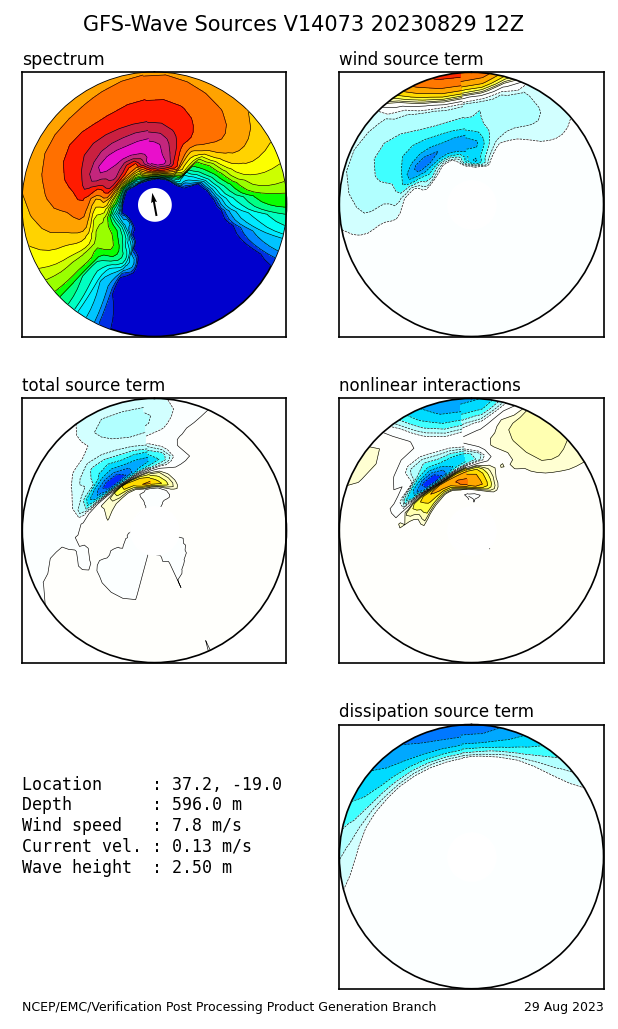
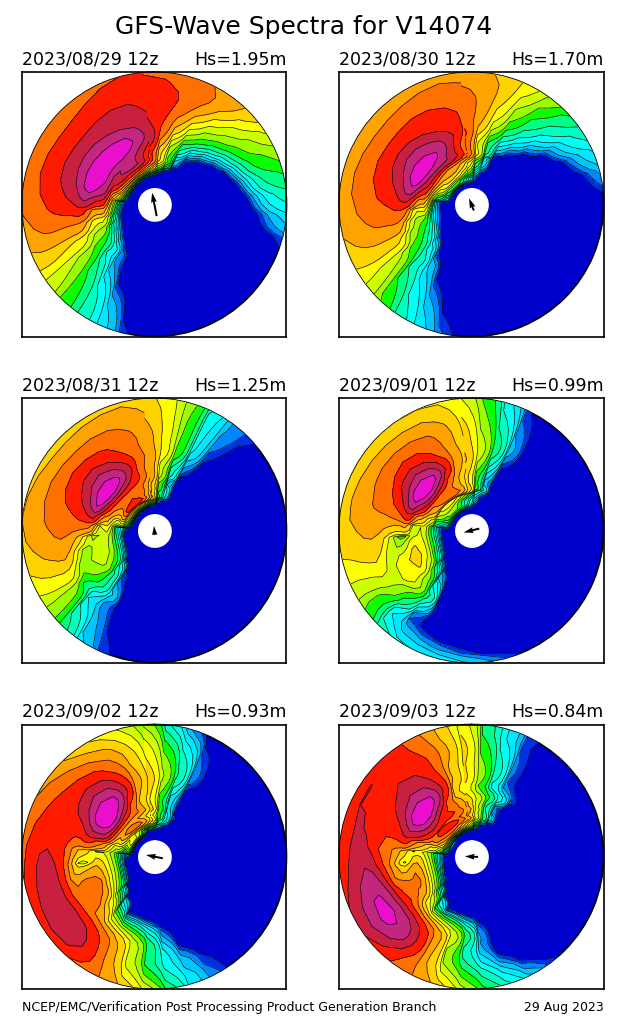
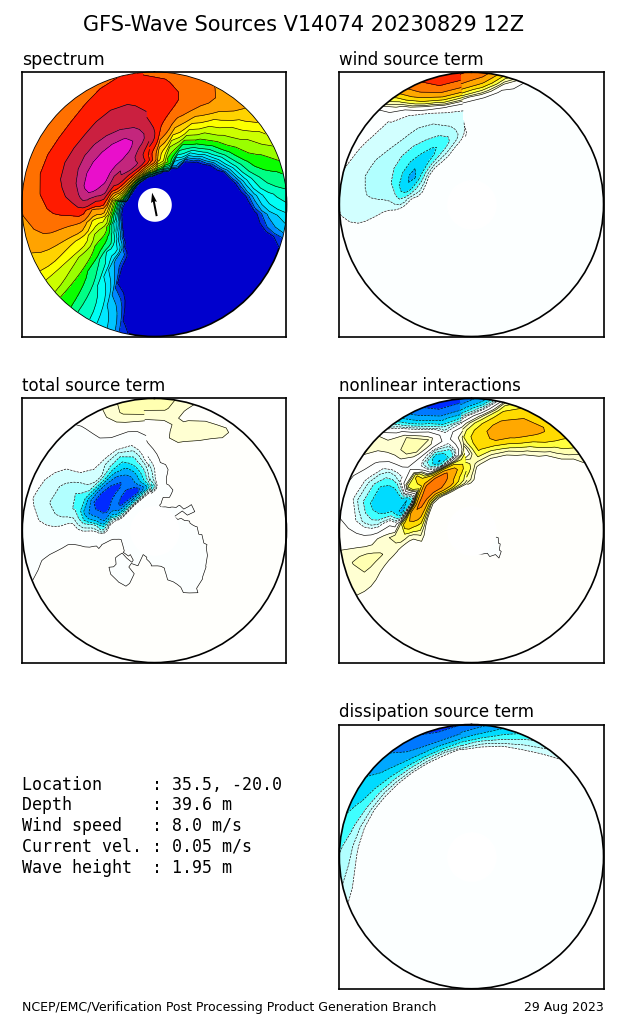
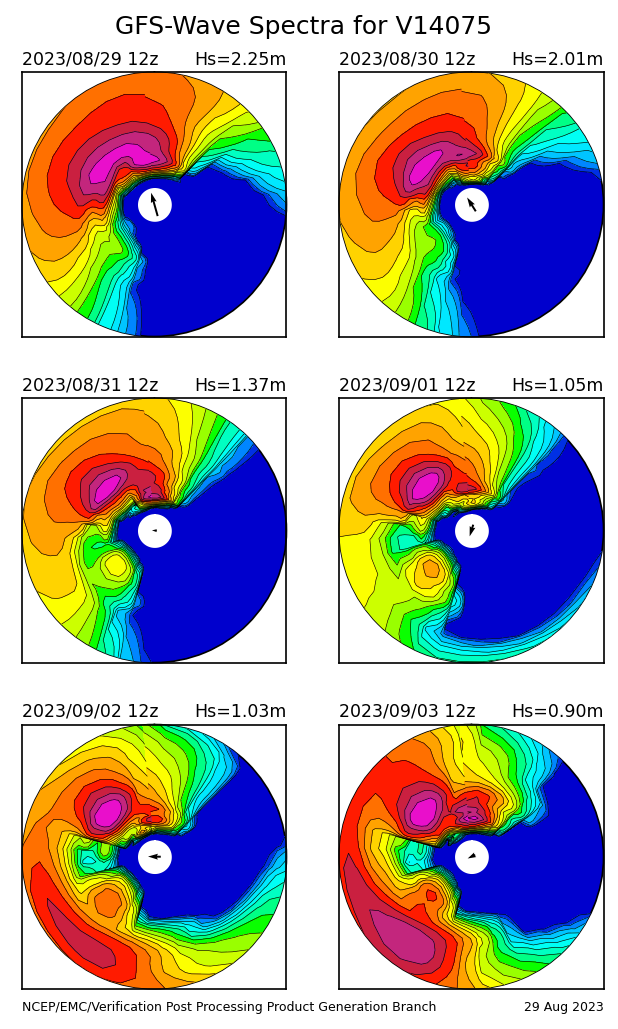
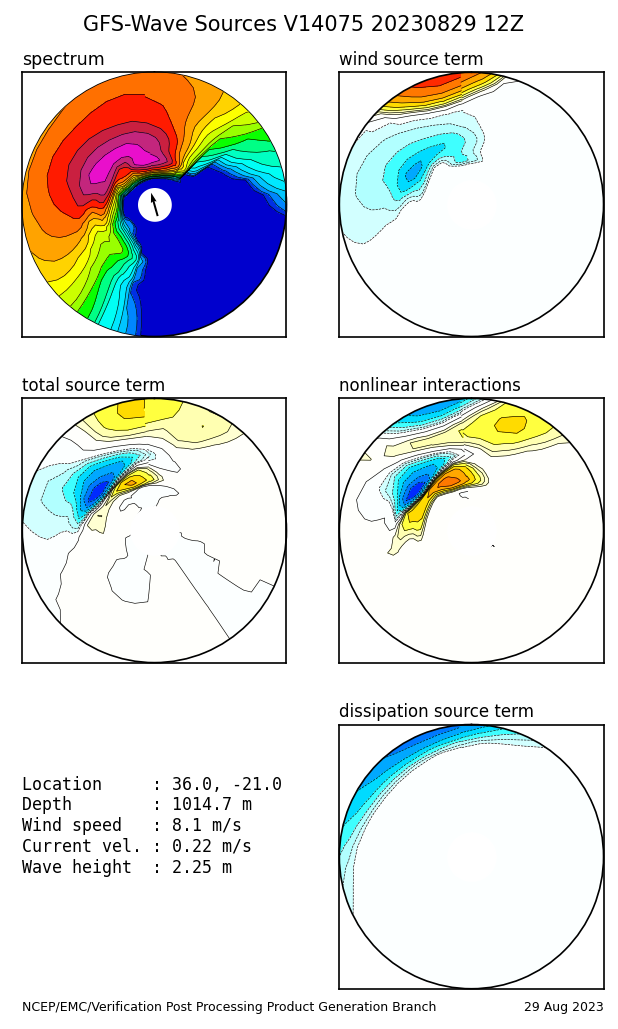
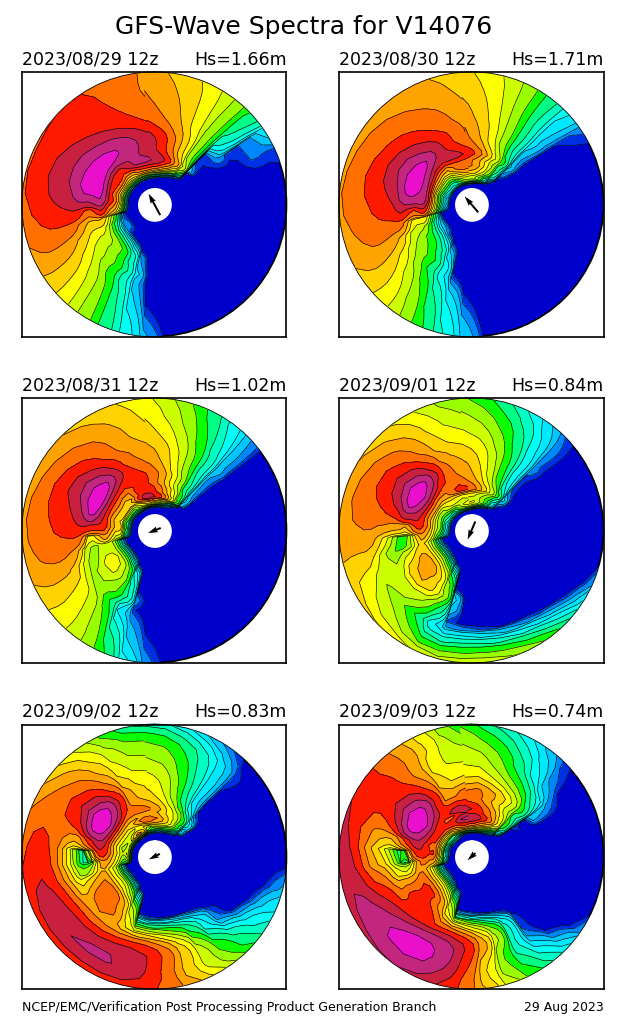
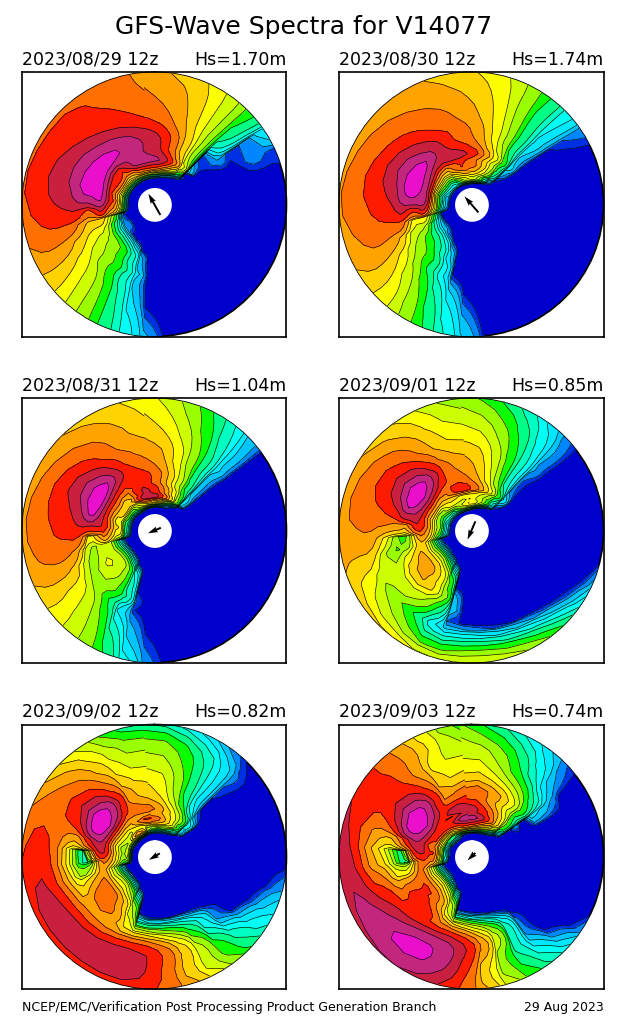
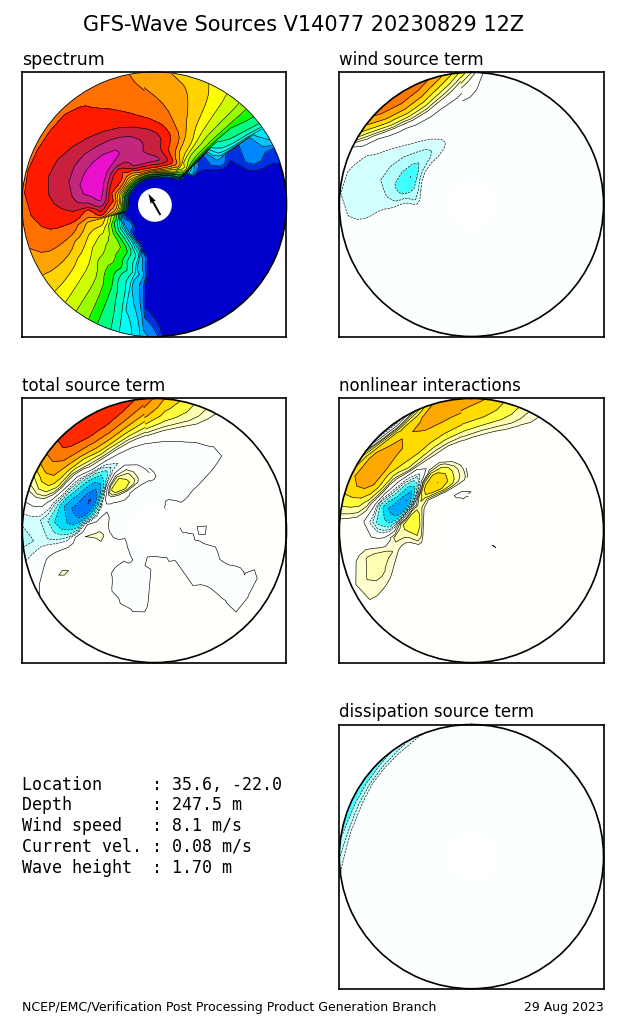
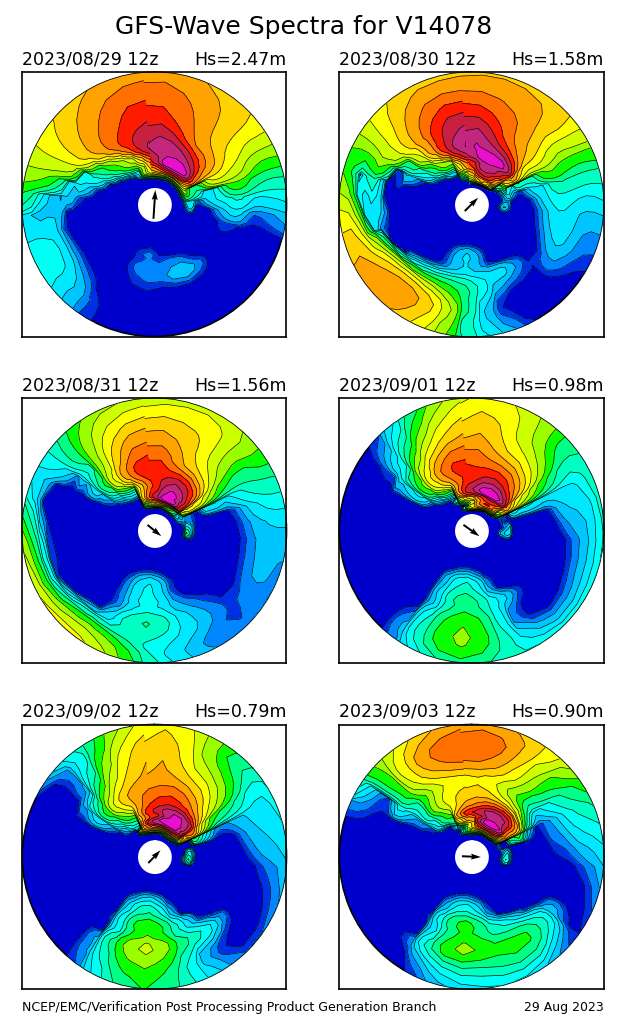
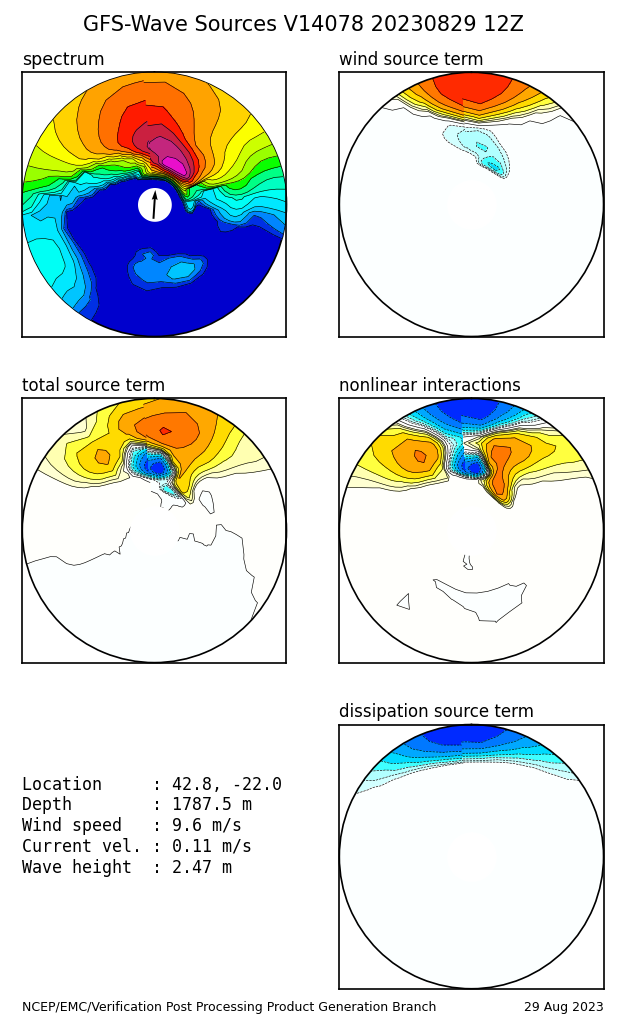
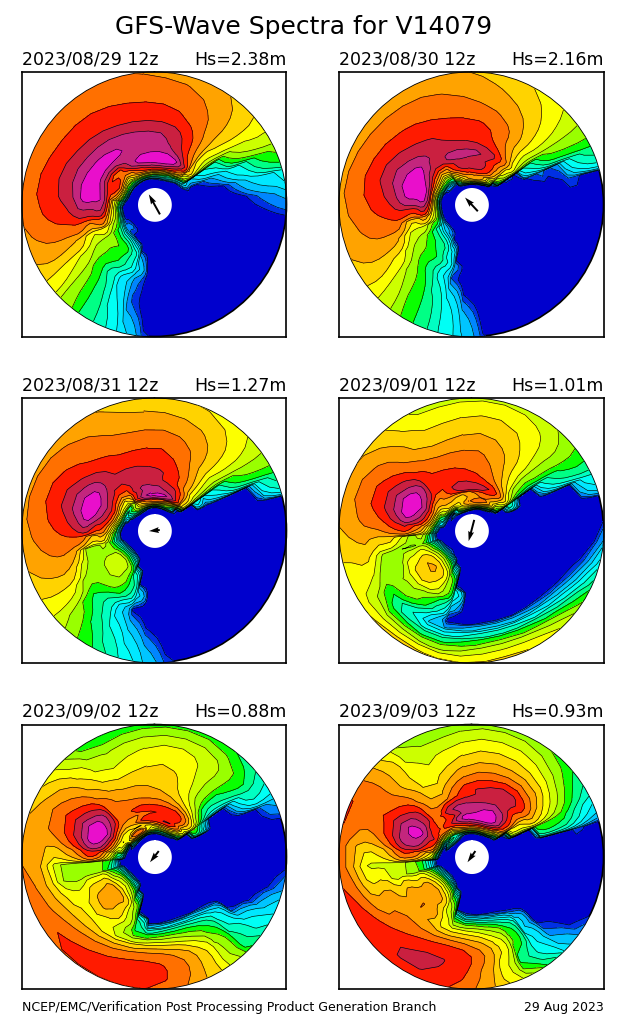
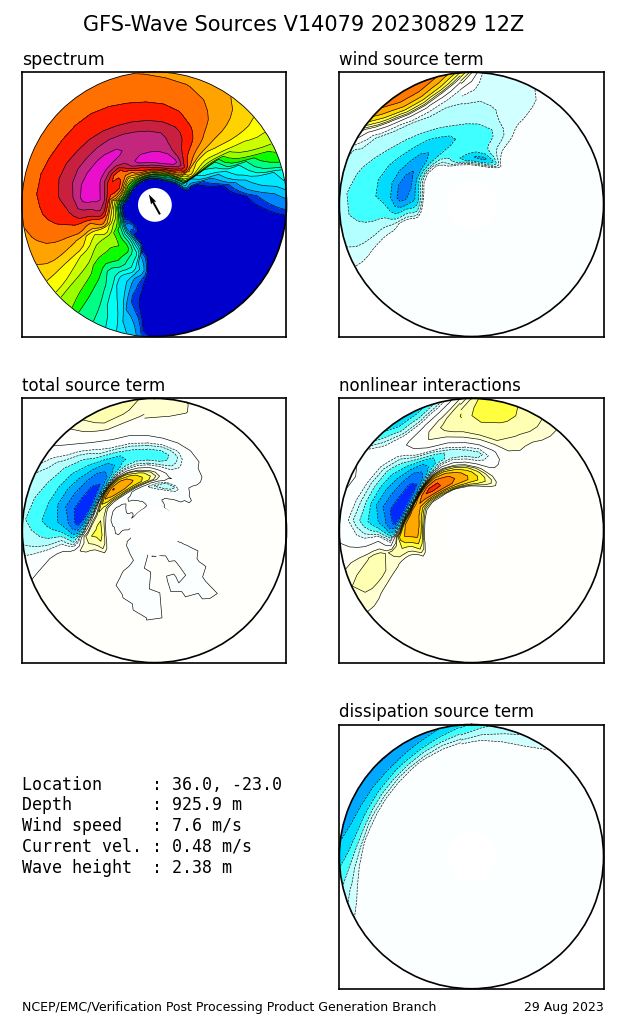
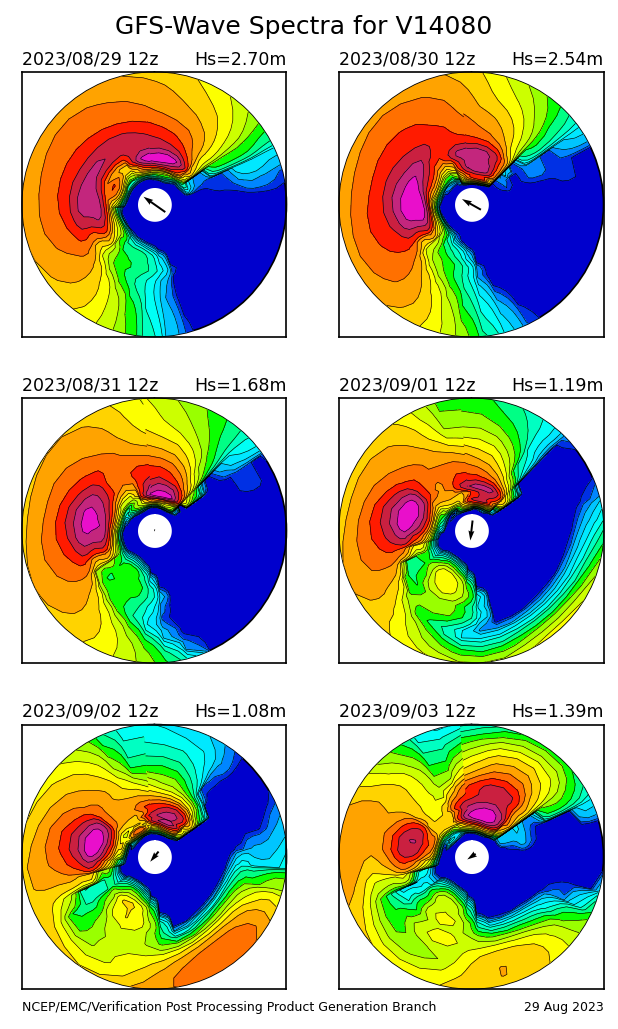
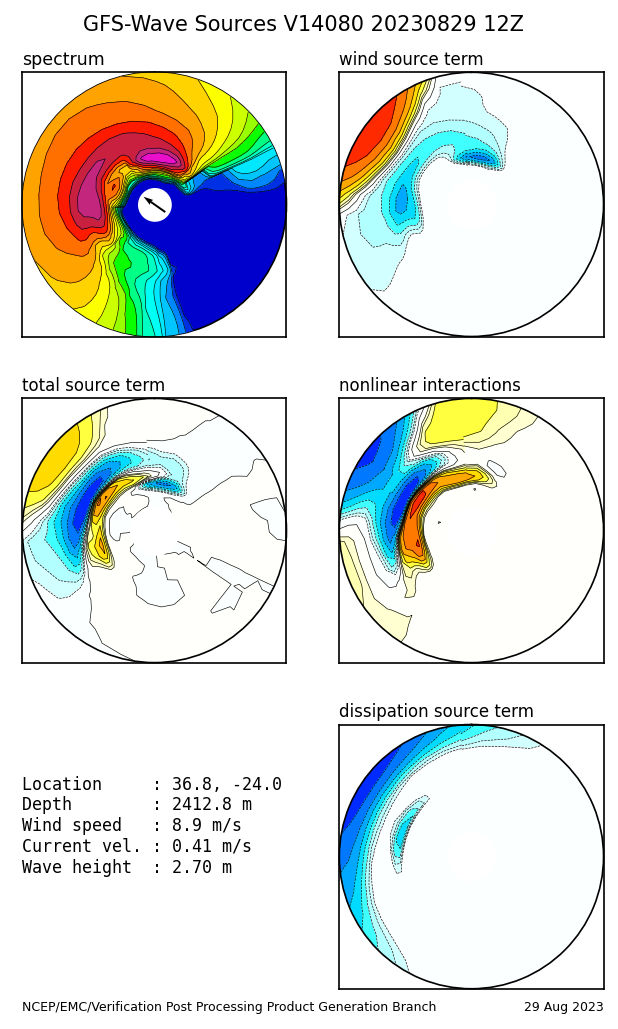
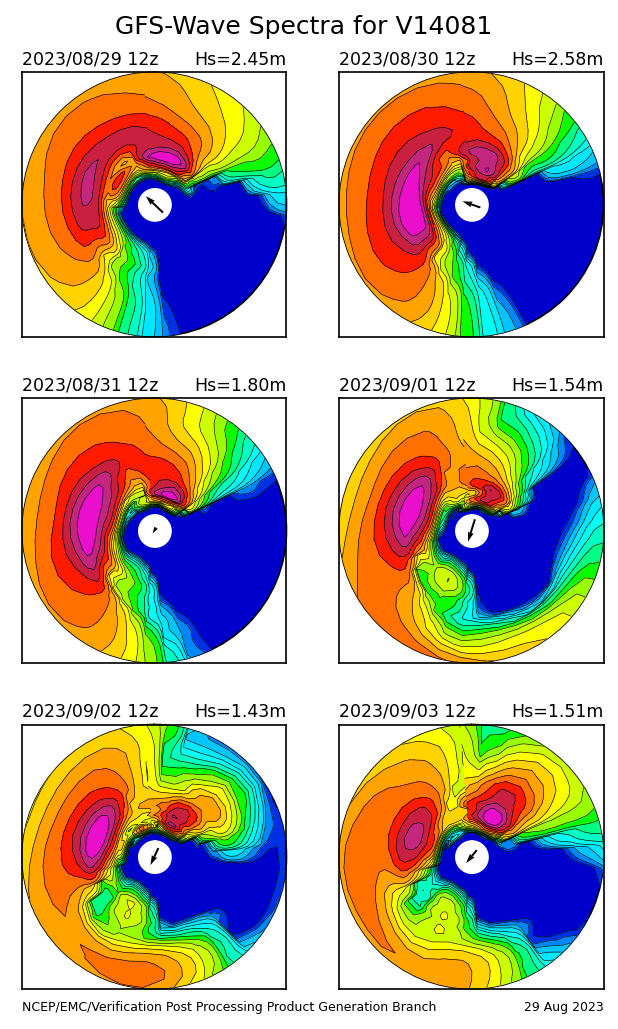
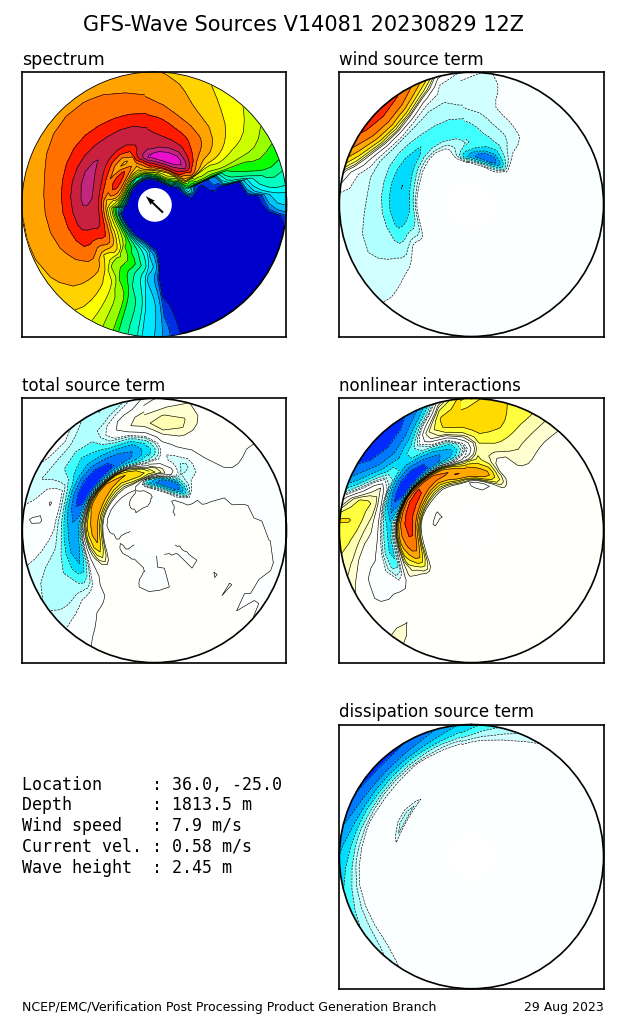
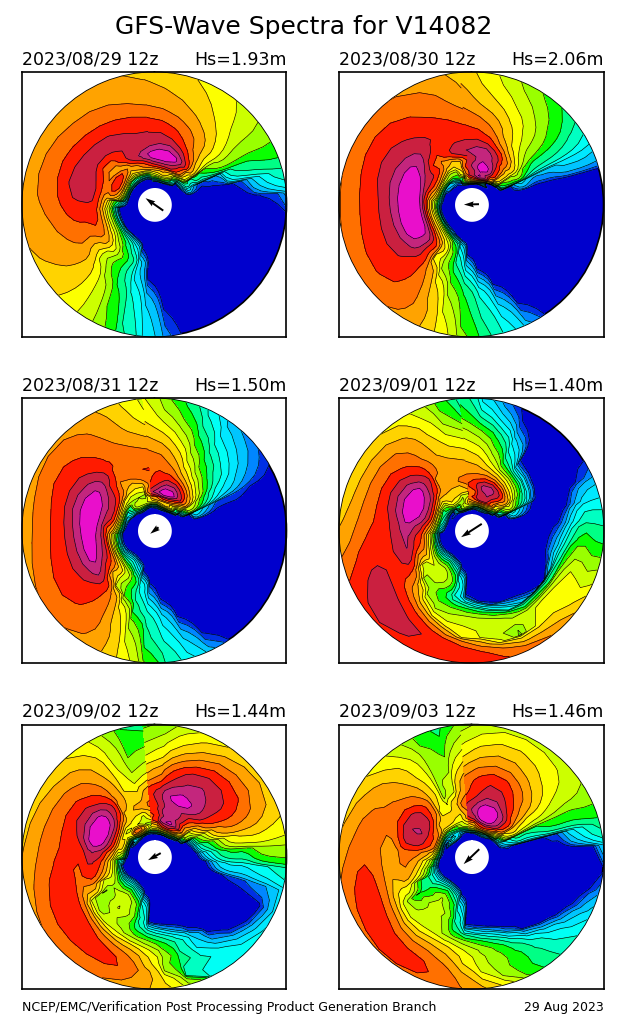
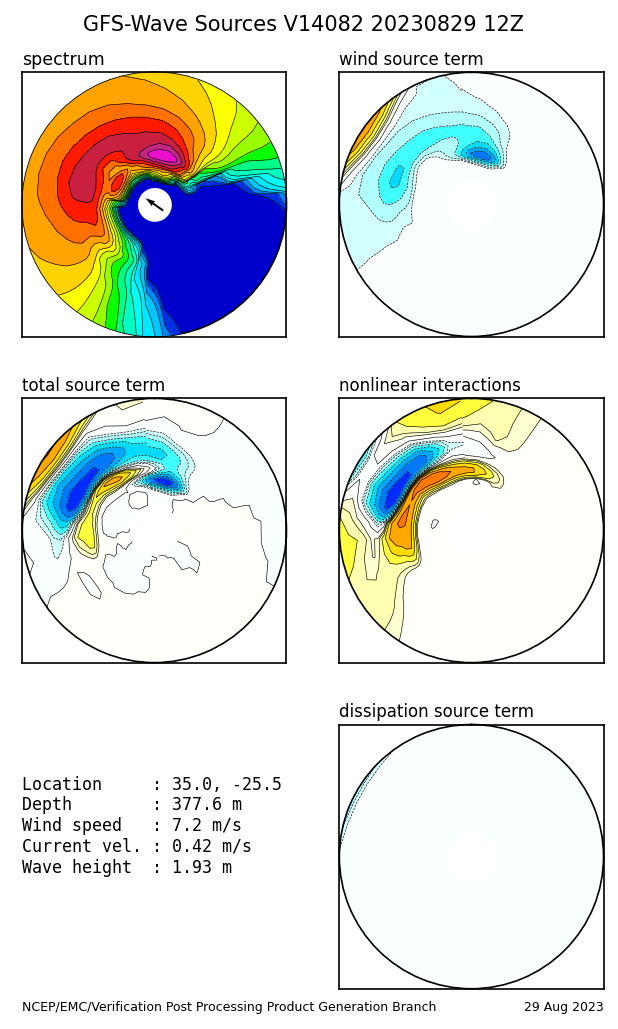
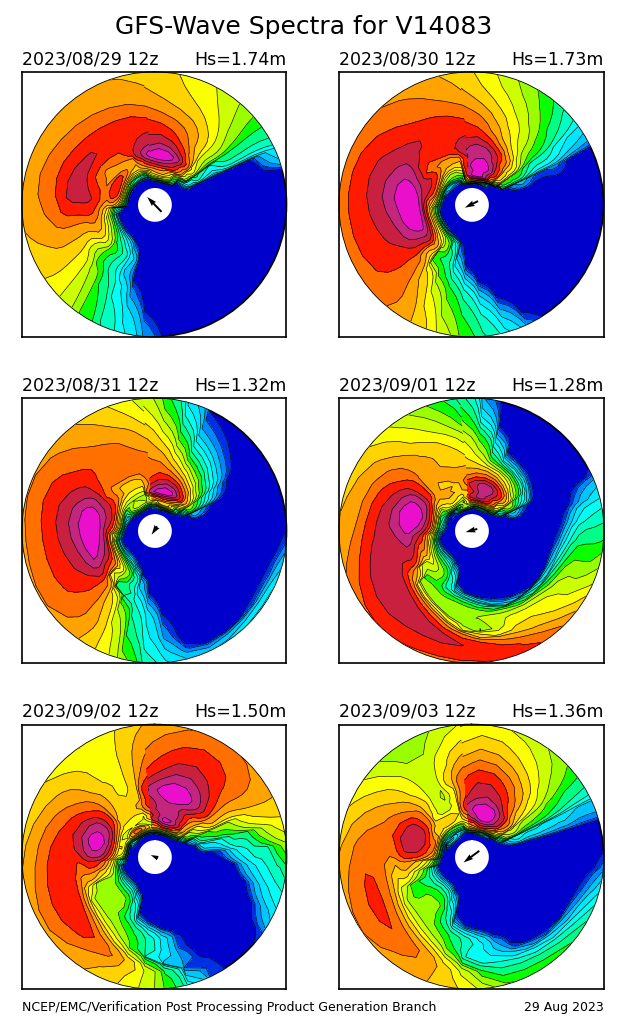
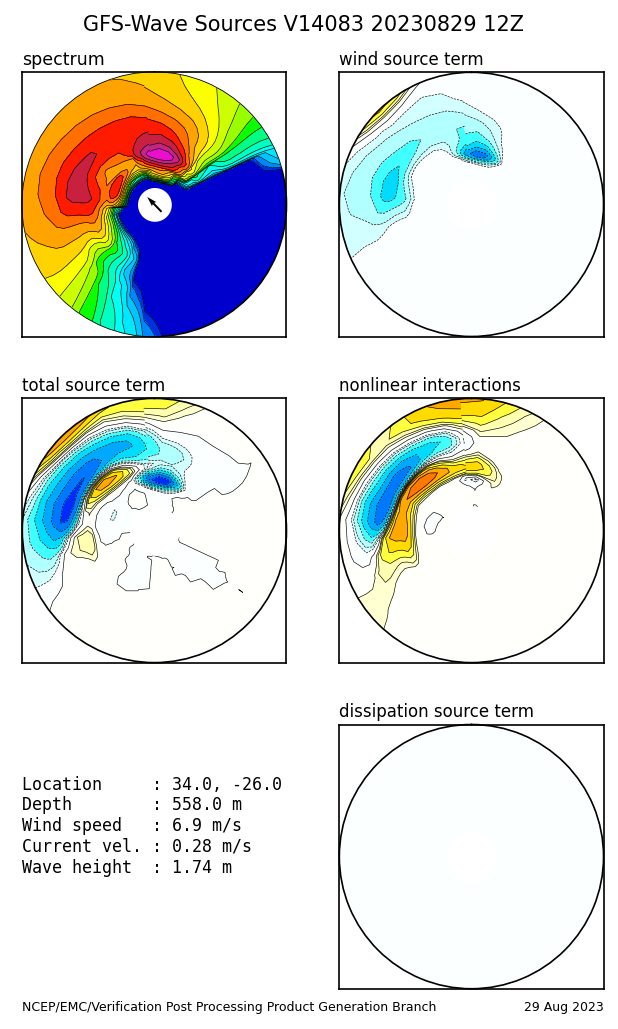
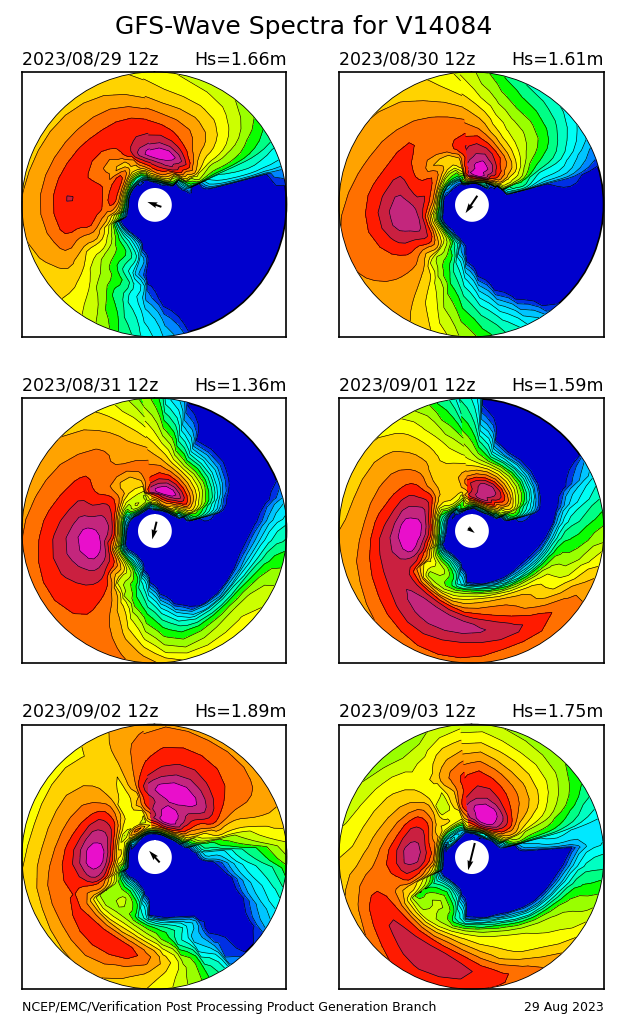
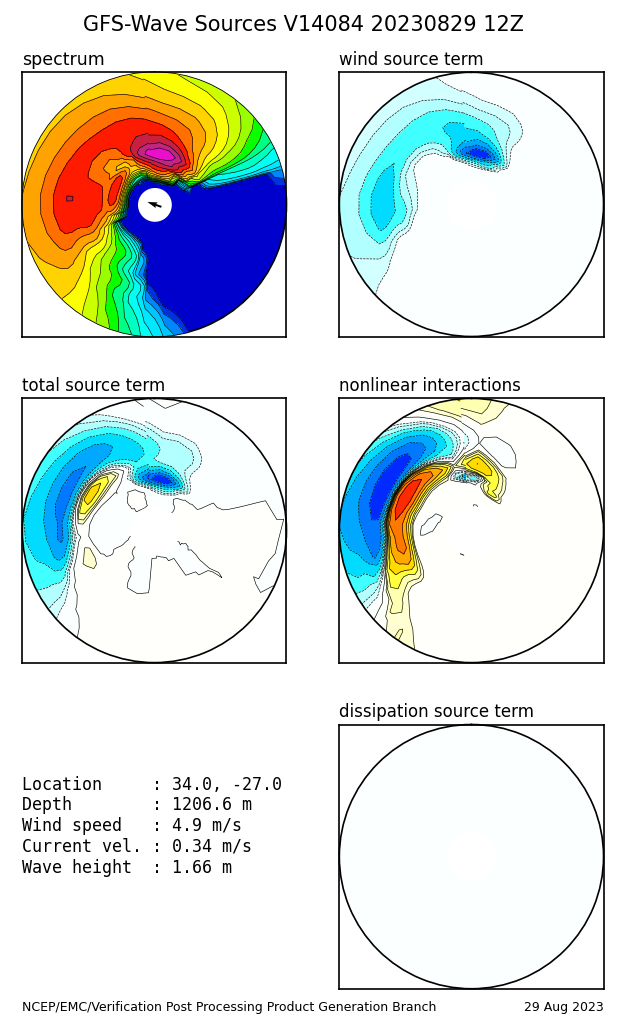
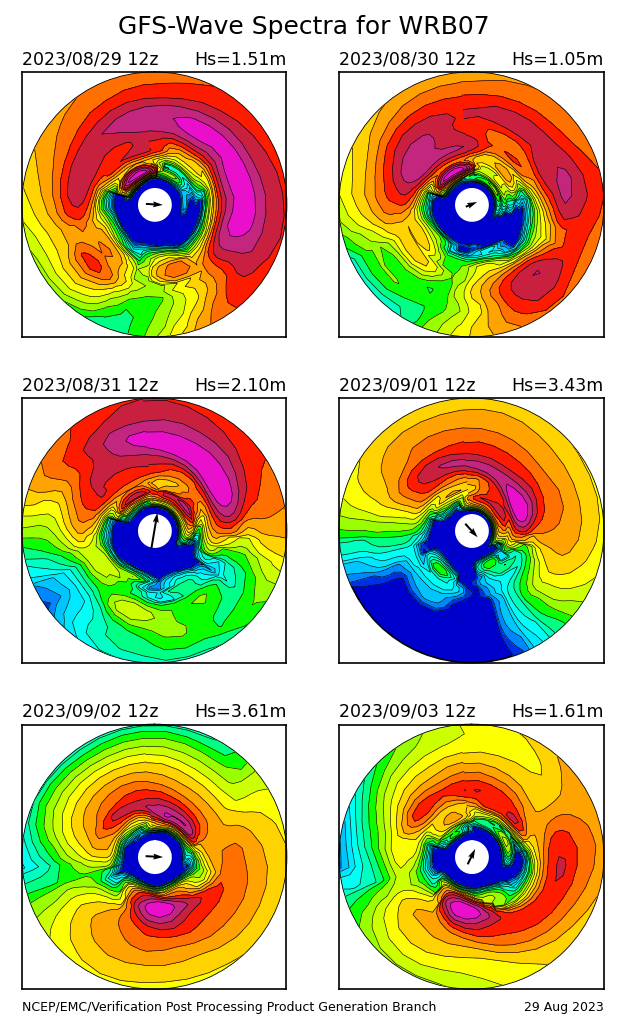
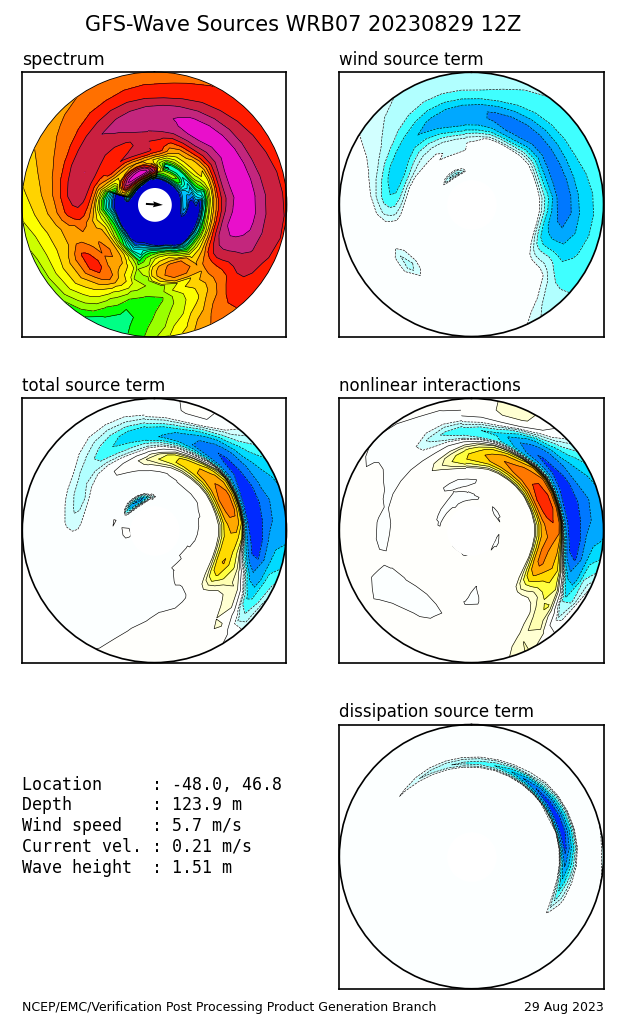
Here you can view any of the individual WAVEWATCH III® graphic products generated during the last six model runs. Simply follow the steps and click to choose the Model, Forecast Zone, Model Run Time, Product, and then click on a Forecast Time (0 is the nowcast, negative times are hindcasts, positive times are forecasts). Buoy information for the selected region is also given in the form of spectral plots, source term plots, and Spectral Bulletins.
| GFS-Wave |
Great Lakes (NDFD Winds) |
| Latest run |
6 hours back |
12 hours back |
18 hours back |
24 hours back |
30 hours back |
| 0 | 3 | 6 | 9 | 12 | 15 | 18 | 21 | 24 | 27 | 30 | 33 | 36 |
| 39 | 42 | 45 | 48 | 51 | 54 | 57 | 60 | 63 | 66 | 69 | 72 | 75 |
| 78 | 81 | 84 | 87 | 90 | 93 | 96 | 99 | 102 | 105 | 108 | 111 | 114 |
| 117 | 120 | 123 | 126 | 129 | 132 | 135 | 138 | 141 | 144 | 147 | 150 | 153 |
| 156 | 159 | 162 | 165 | 168 | 171 | 174 | 177 | 180 | 183 | 186 | 189 | 192 |
| 195 | 198 | 201 | 204 | 207 | 210 | 213 | 216 | 219 | 222 | 225 | 228 | 231 |
| 234 | 237 | 240 |