| Home |
Product Viewer |
Product Table |
Product Descriptions |
Model Description |
Model Validation |
Model Data Access |
| Home |
Product Viewer |
Product Table |
Product Descriptions |
Model Description |
Model Validation |
Model Data Access |
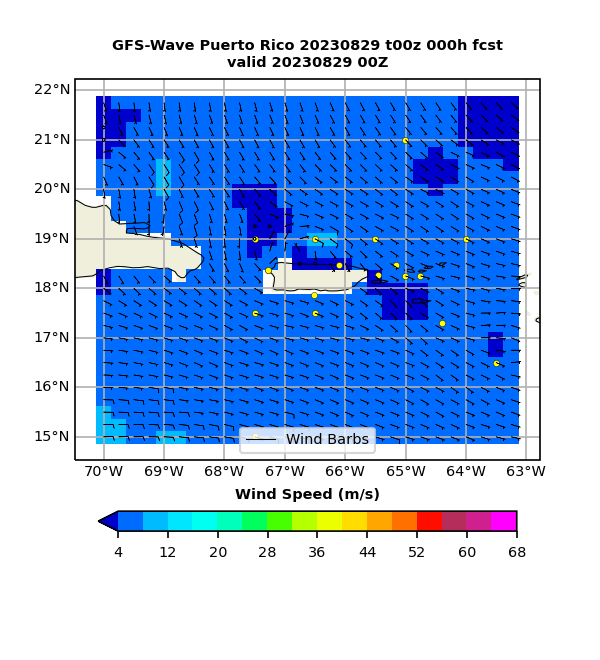
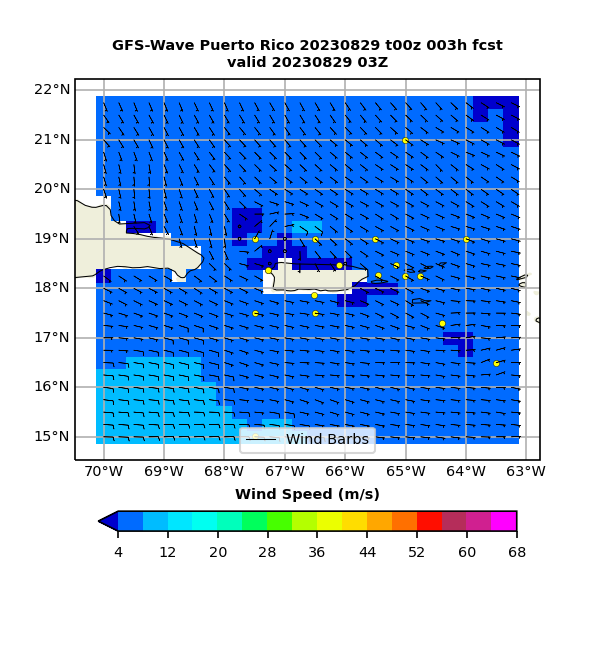
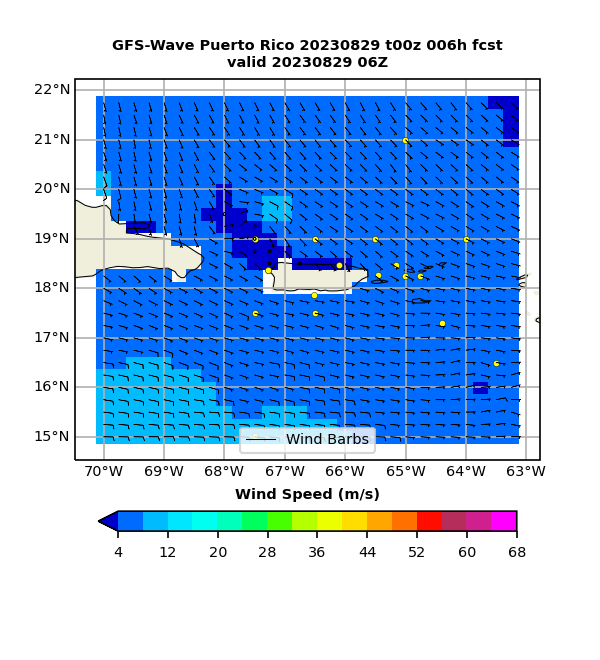
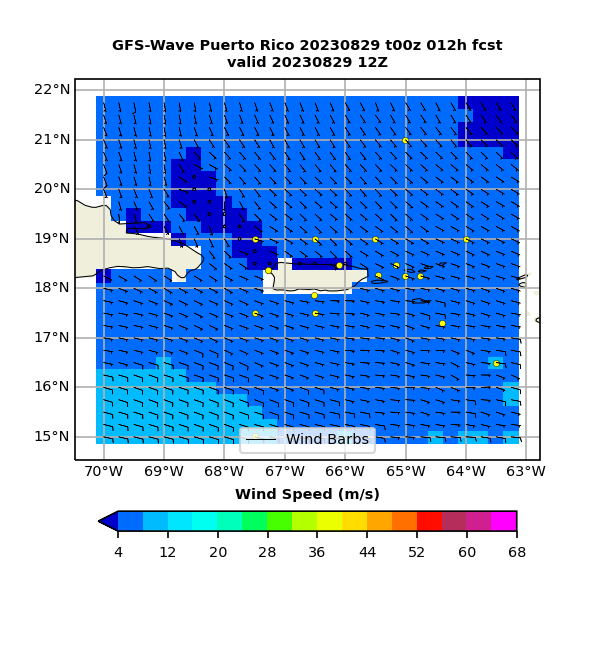
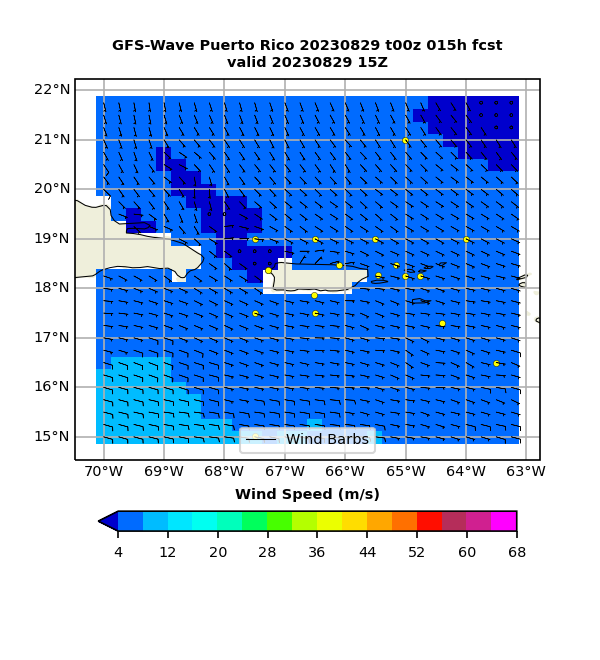
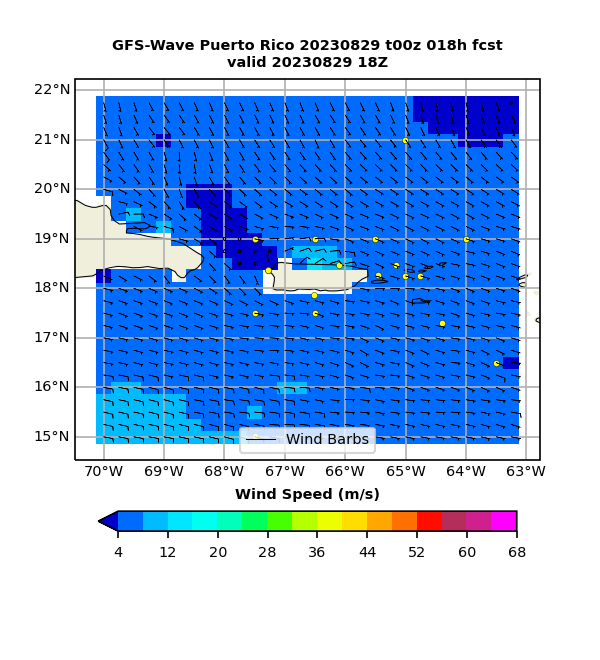
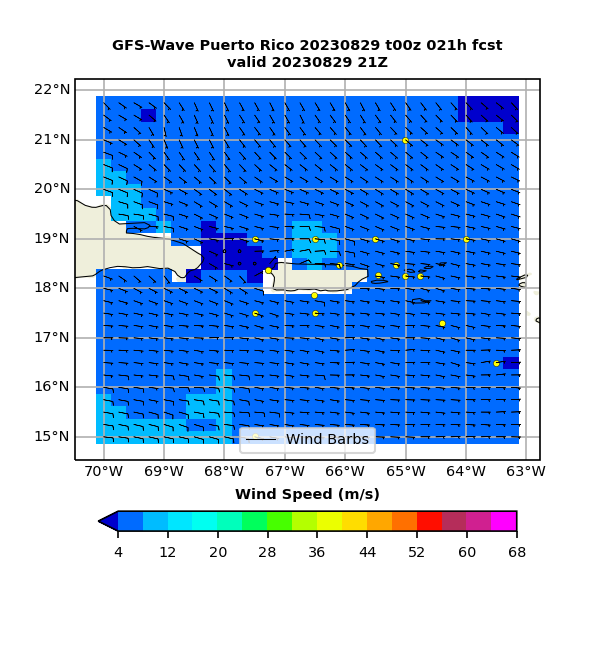
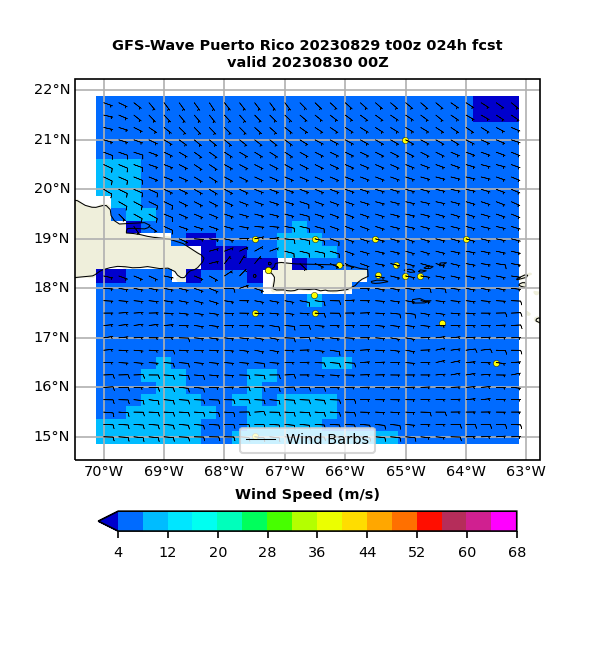
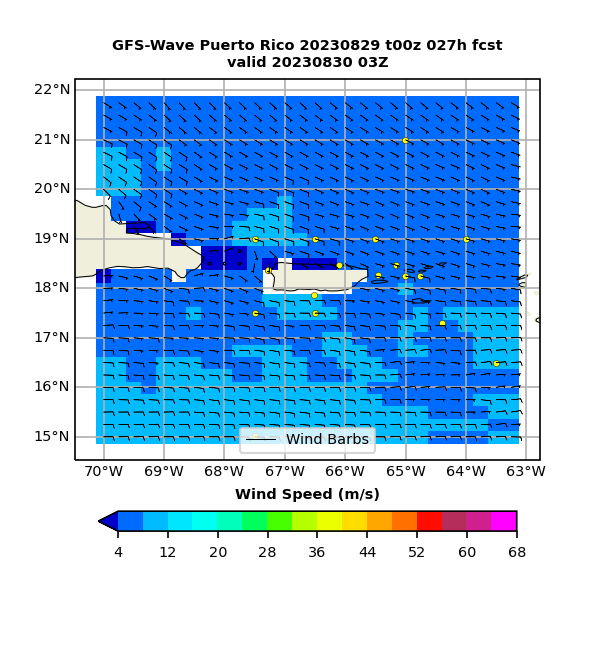
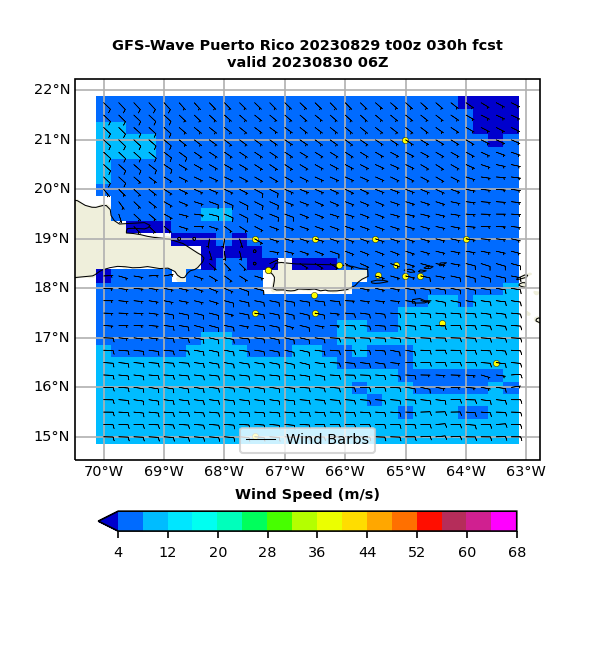
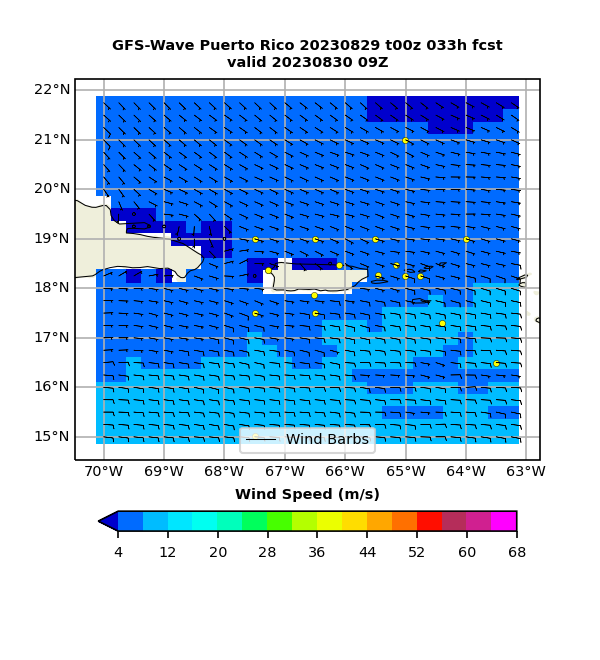
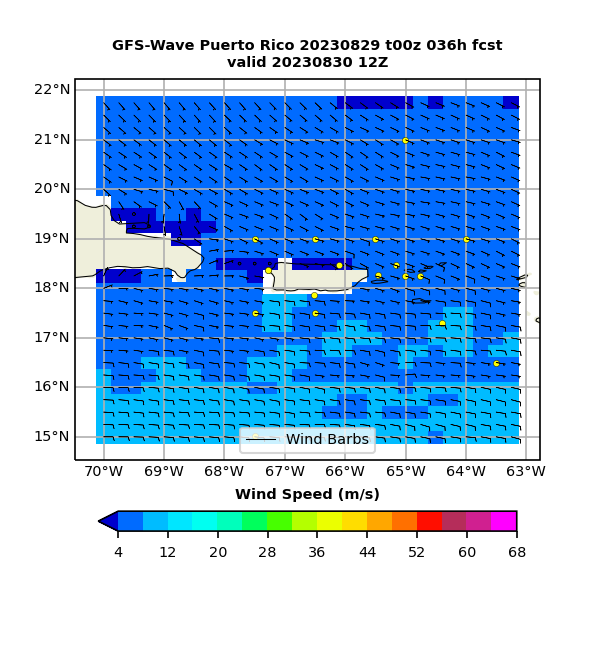
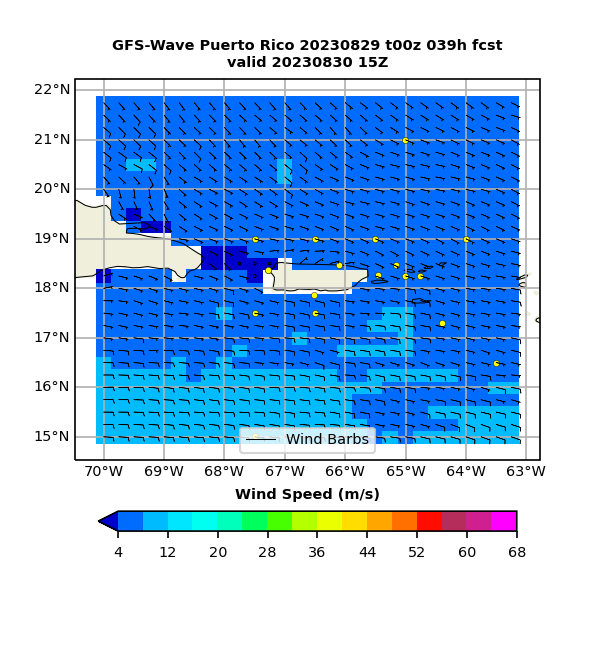
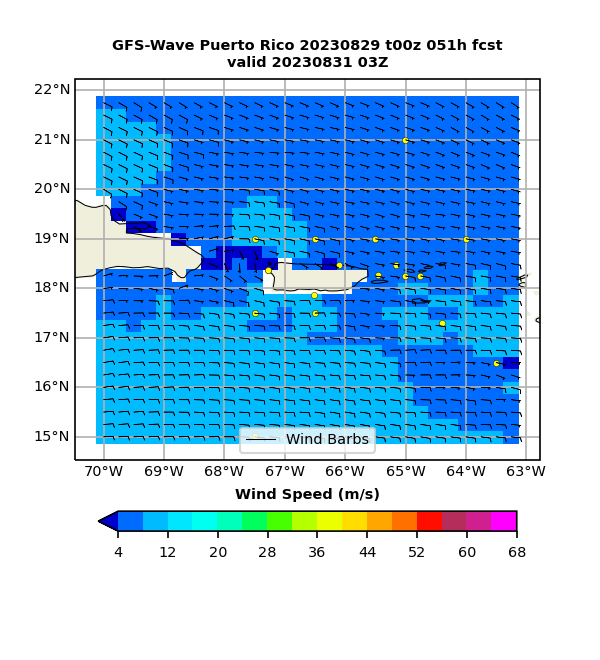
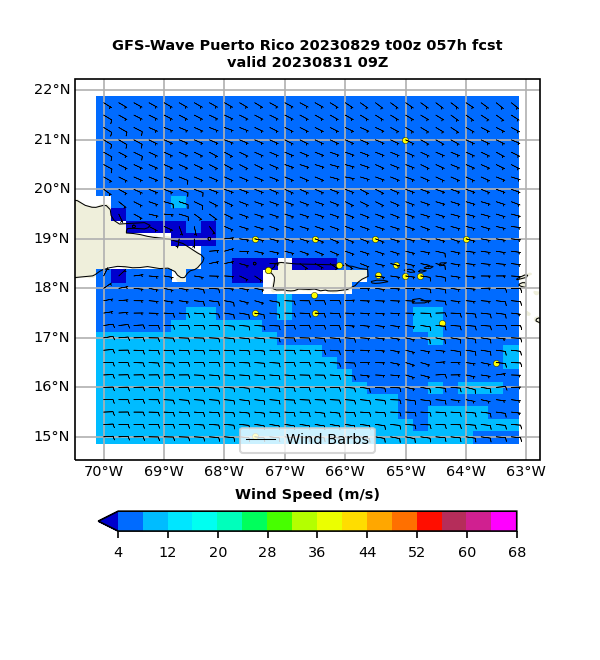
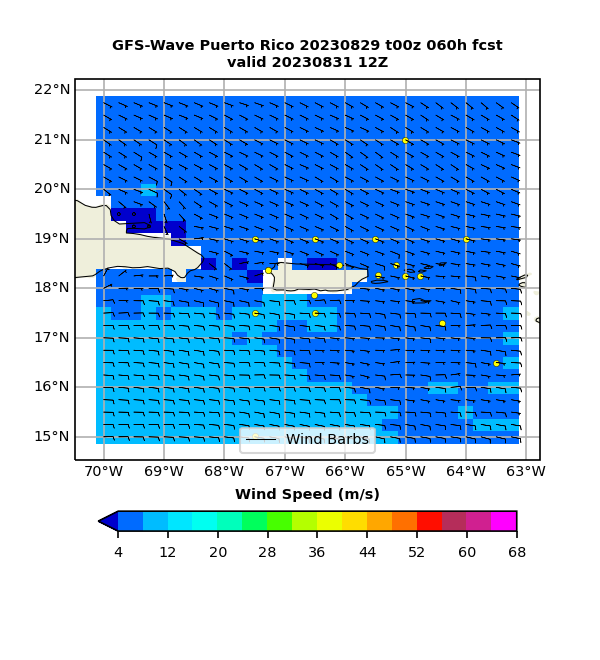
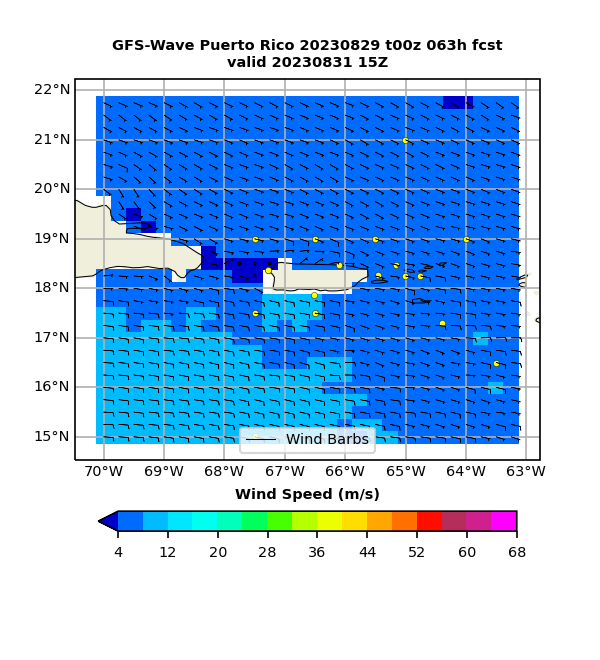
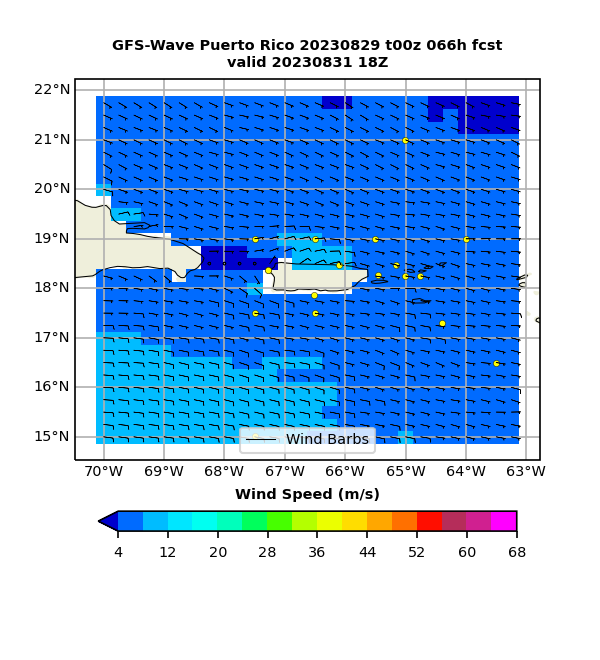
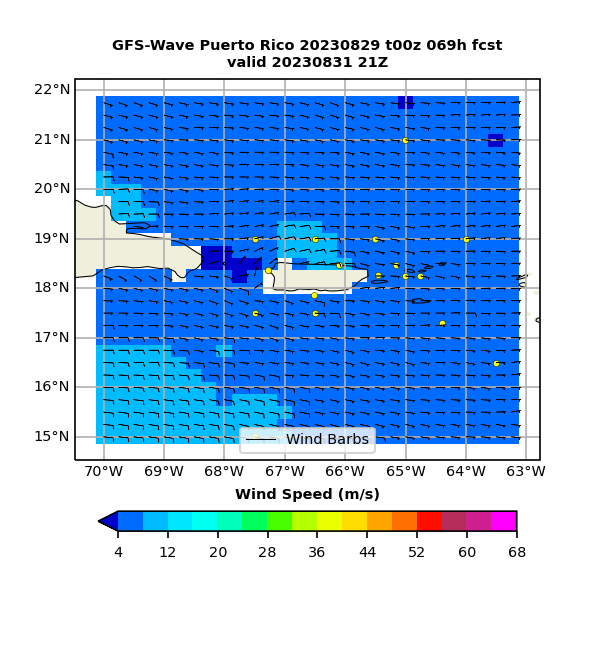
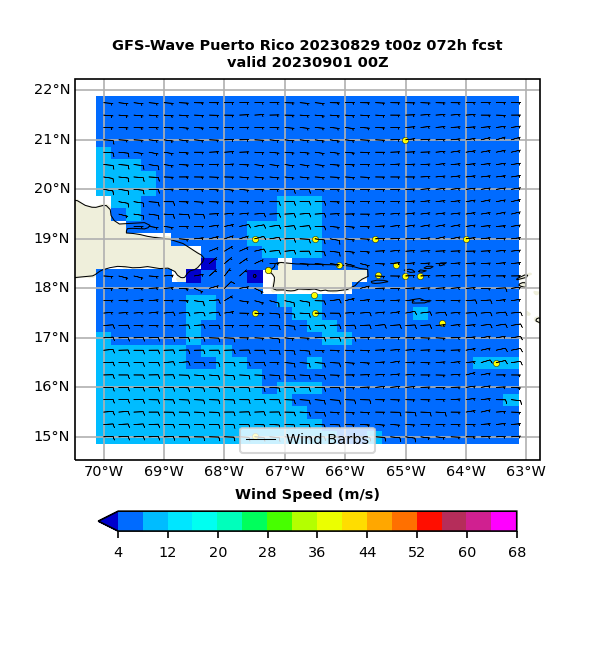
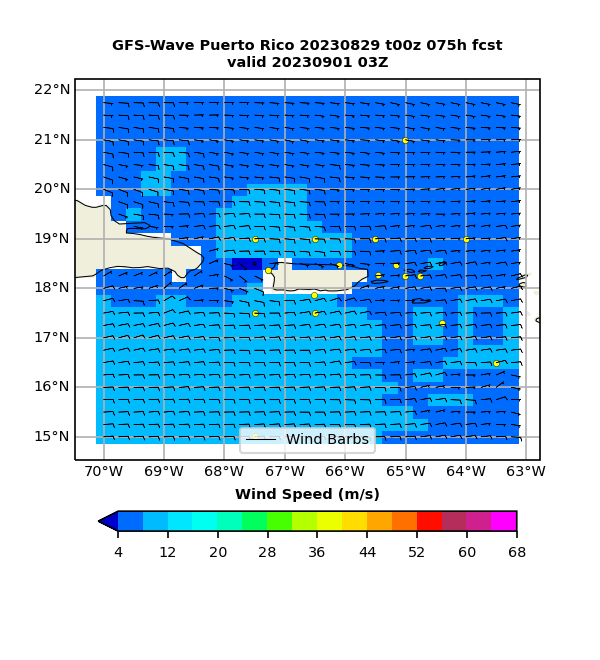
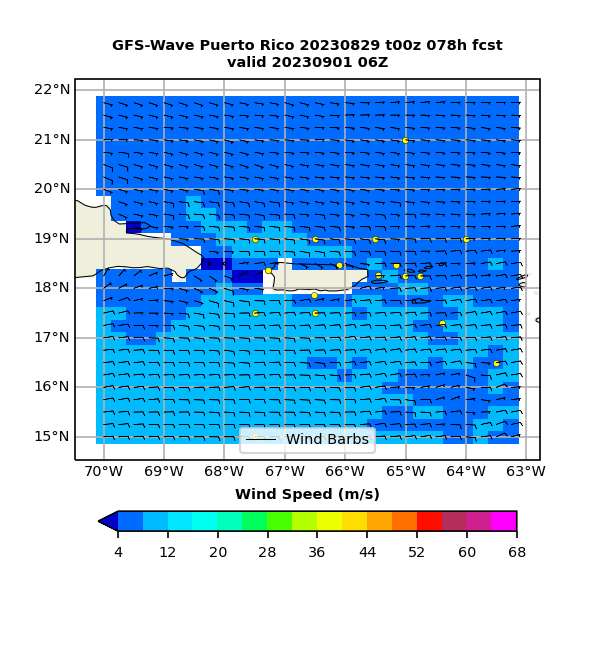
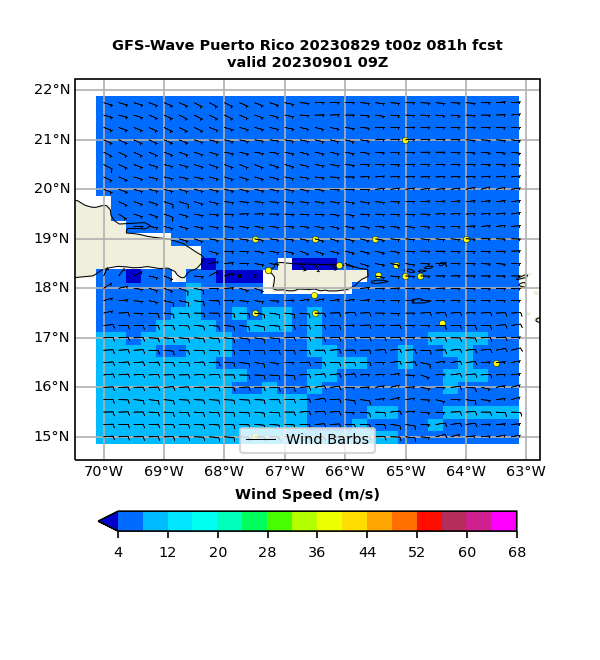
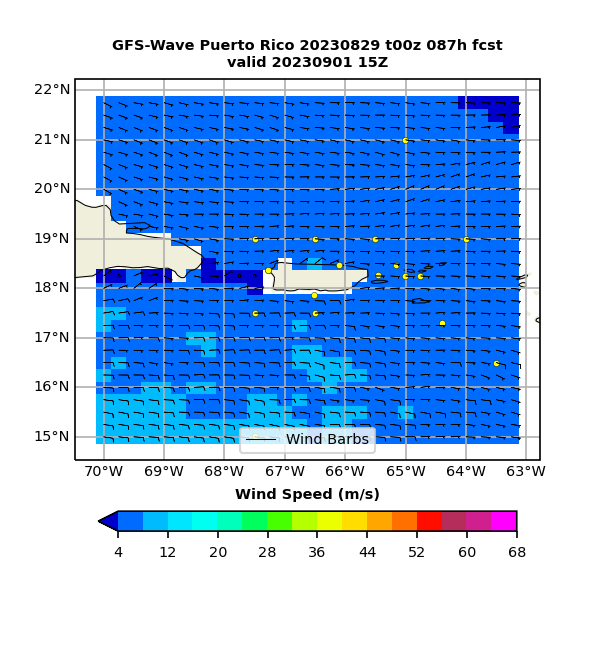
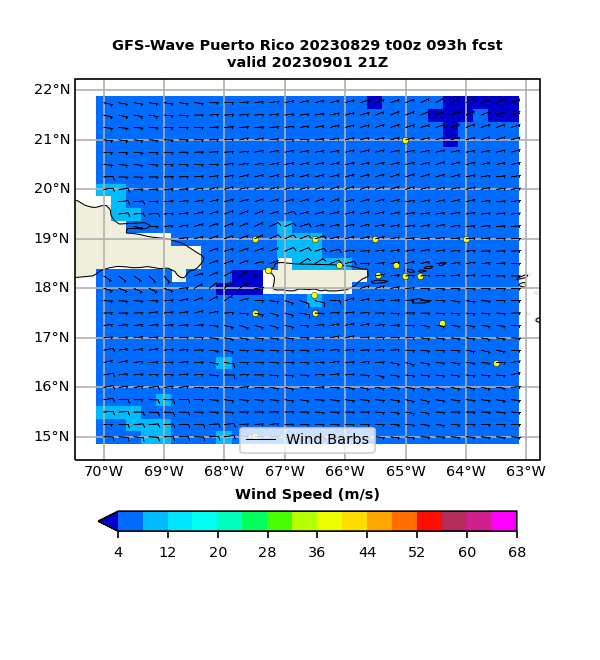
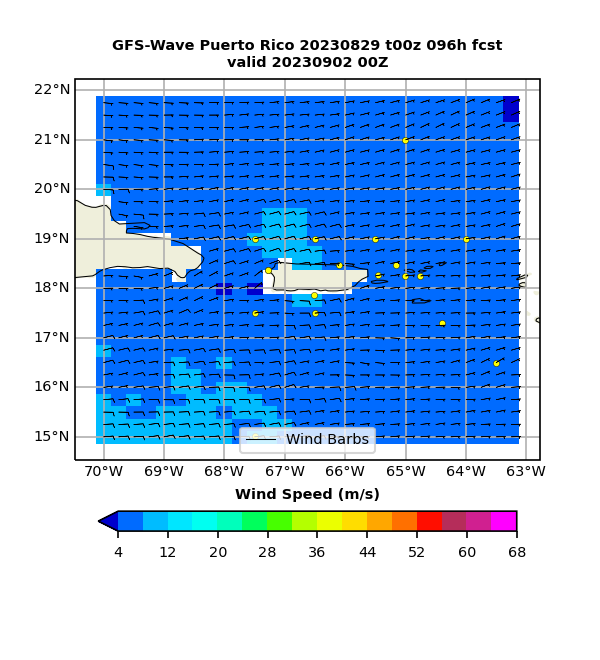
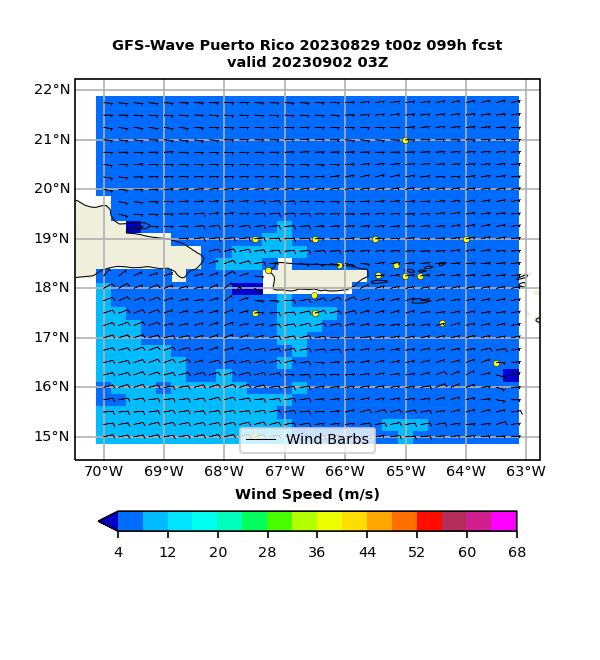
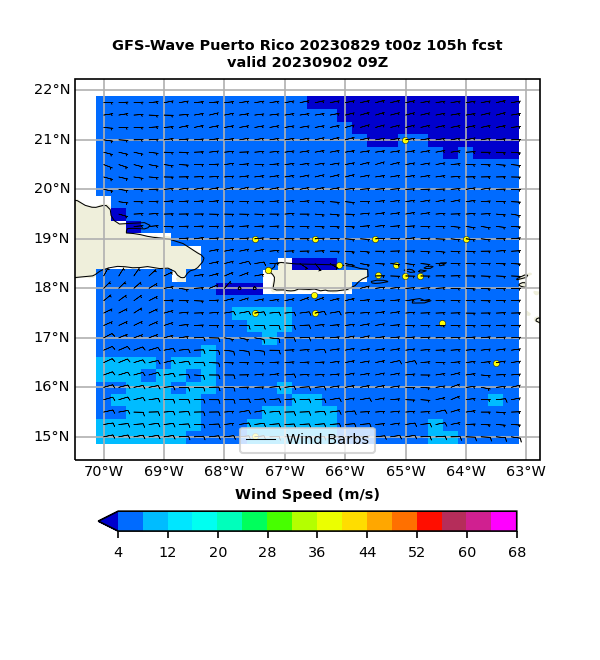
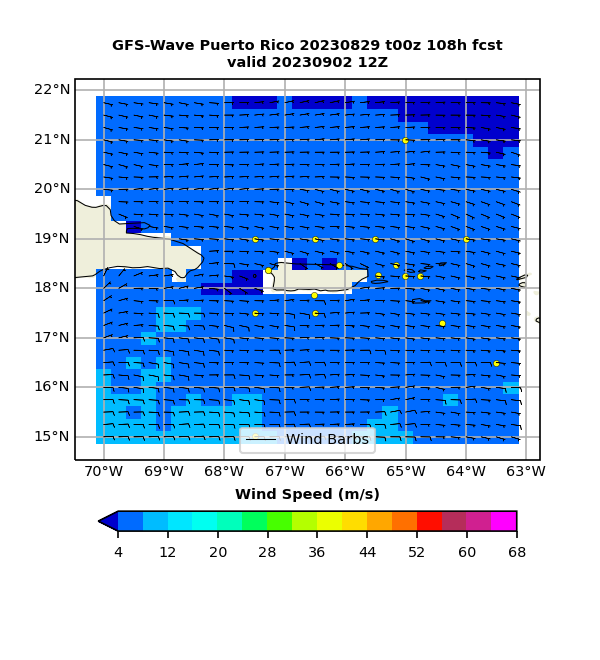
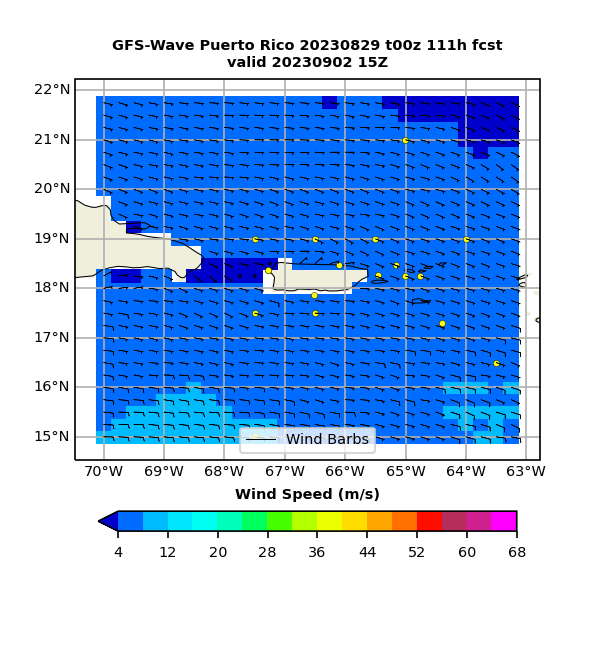
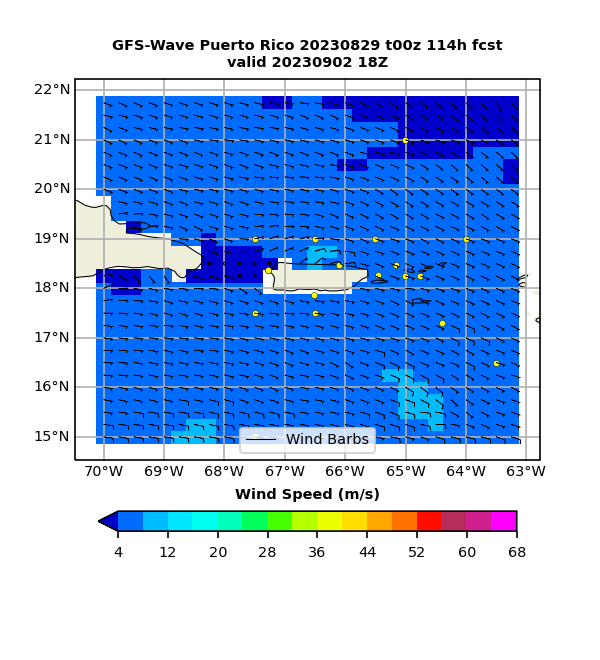
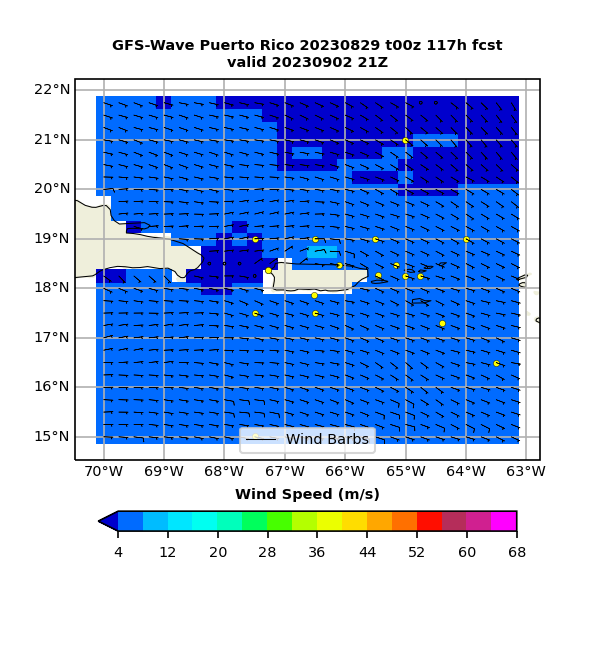
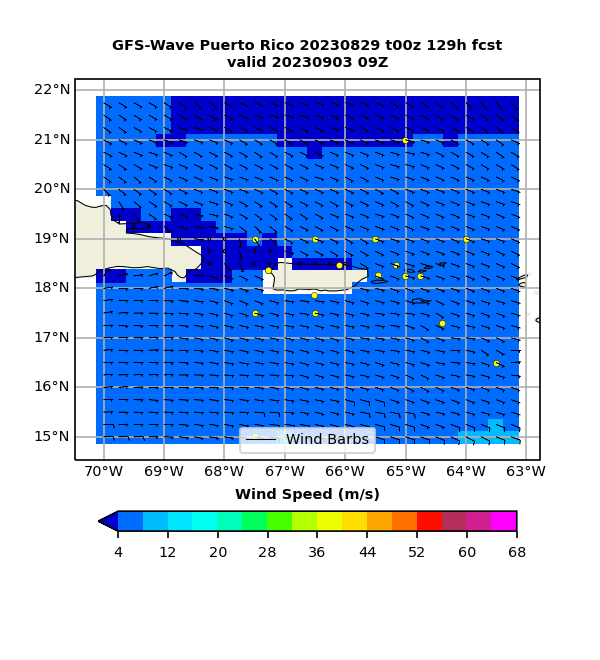
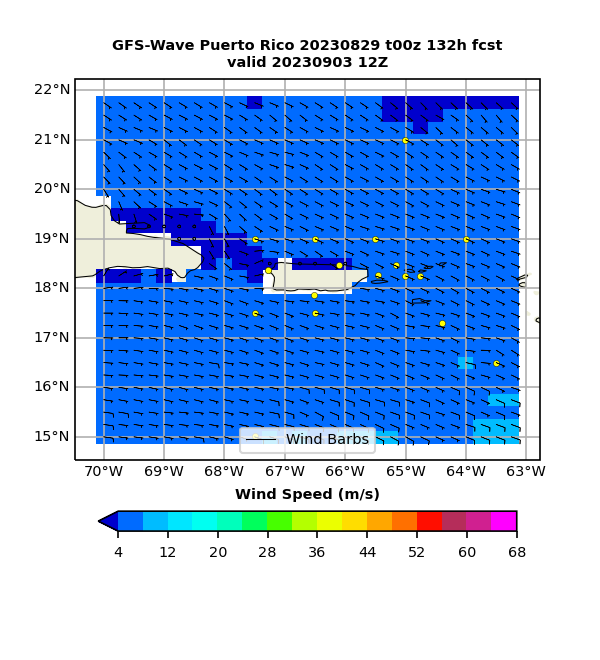
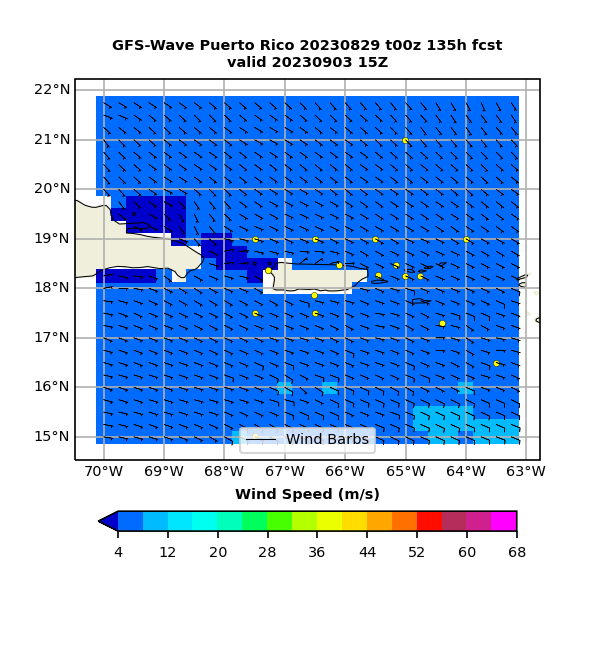
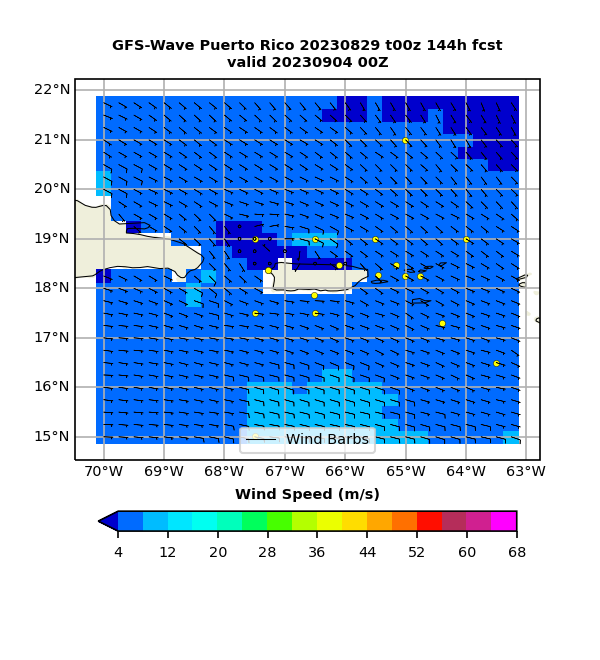
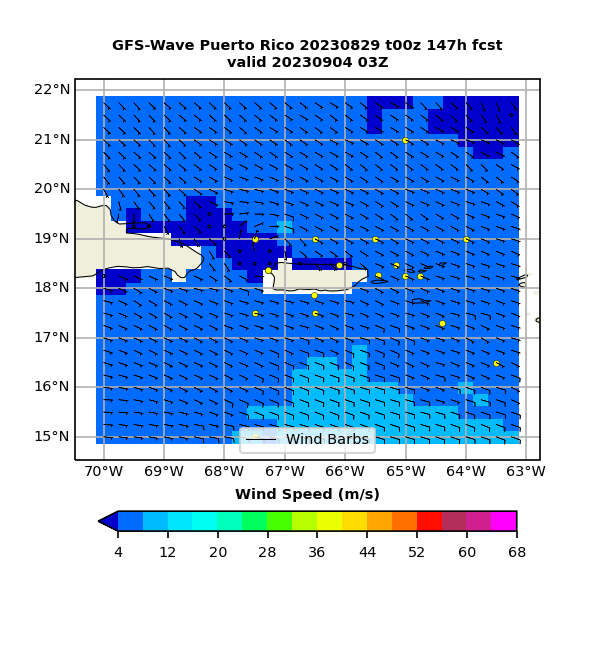
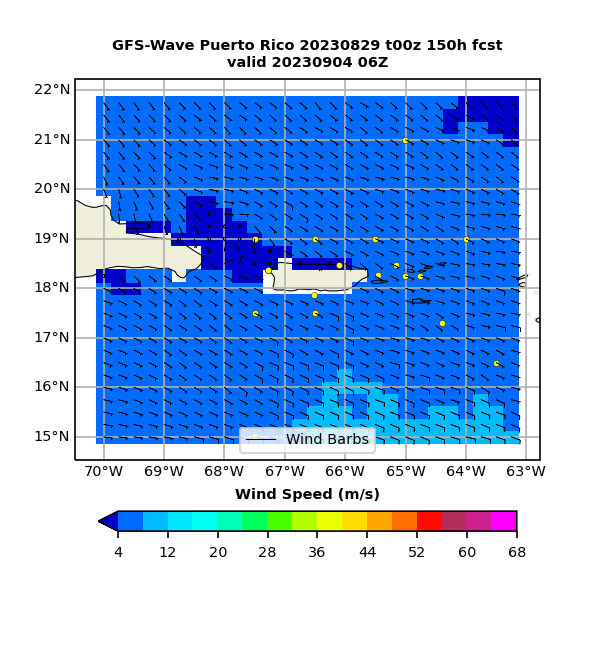
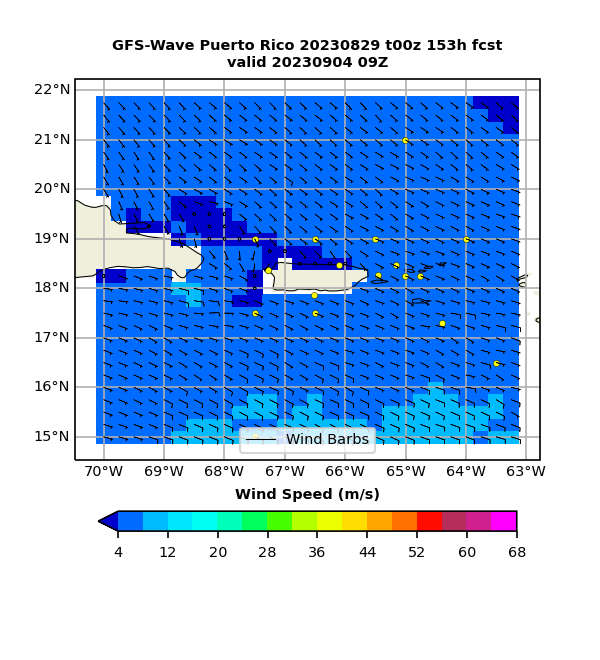
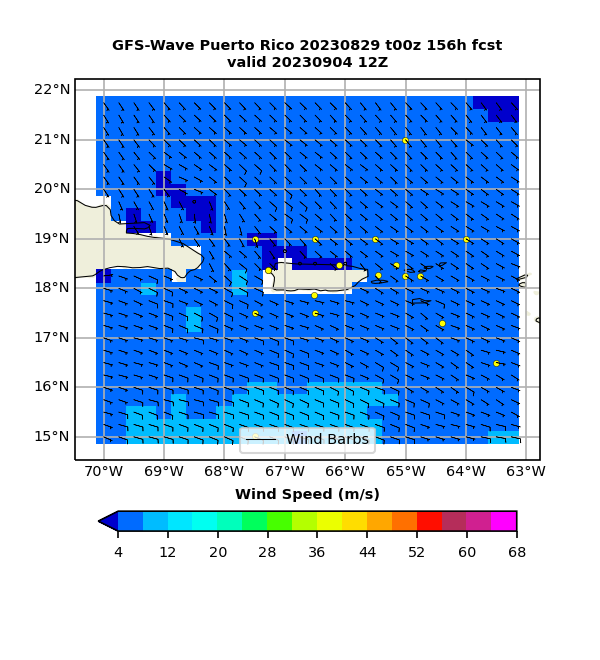
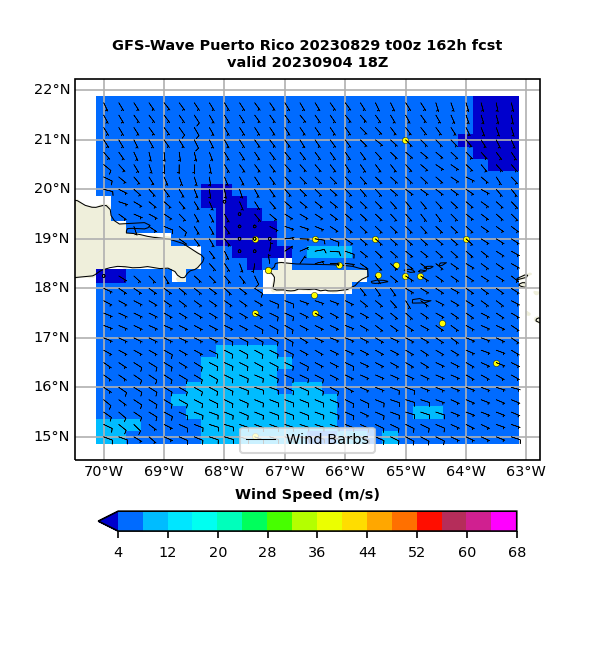
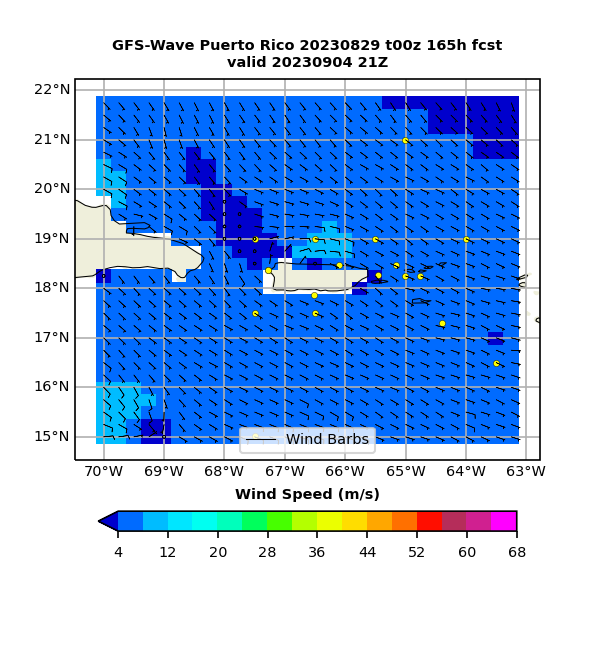
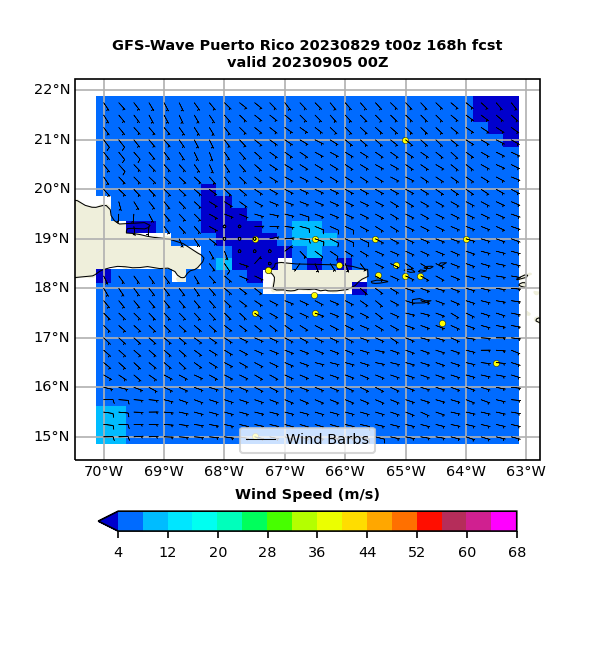
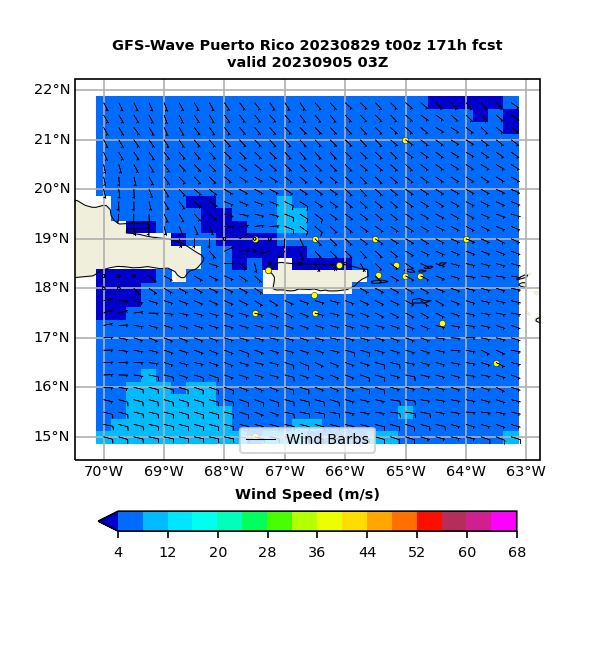
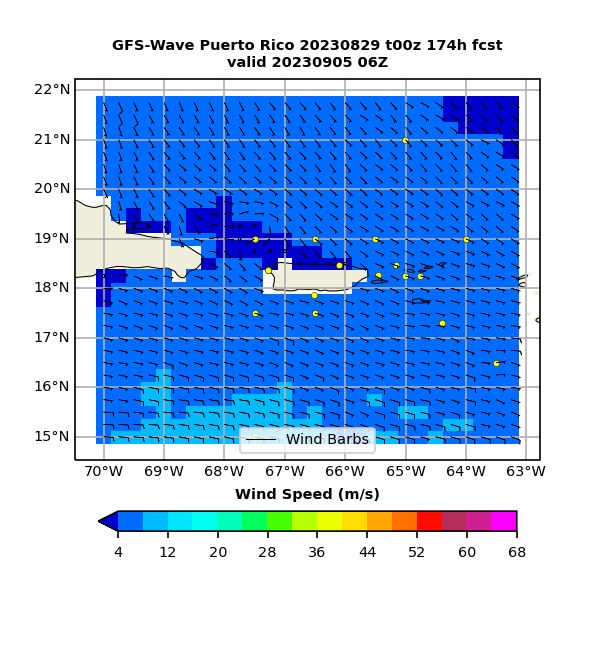
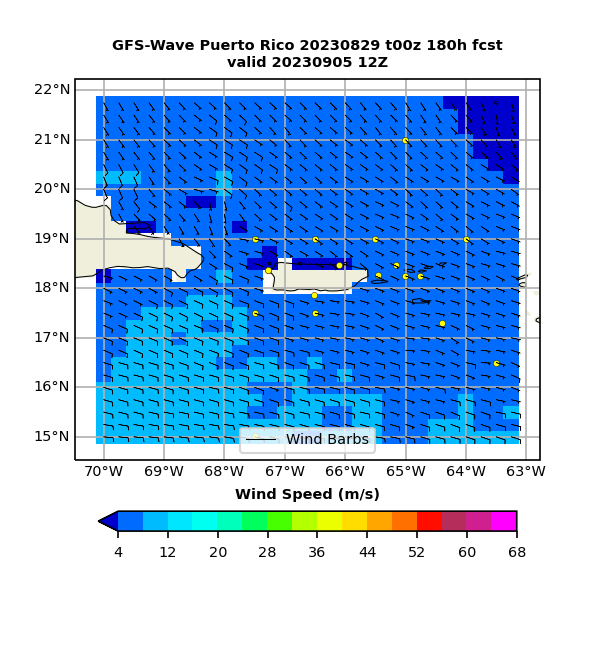
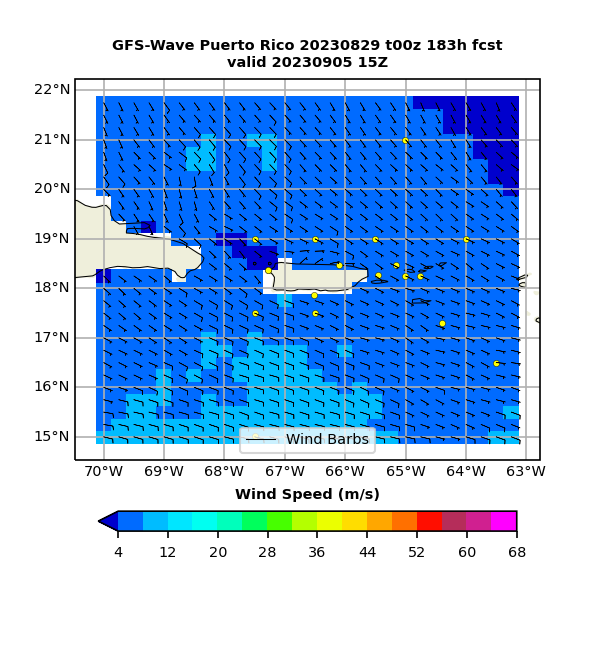
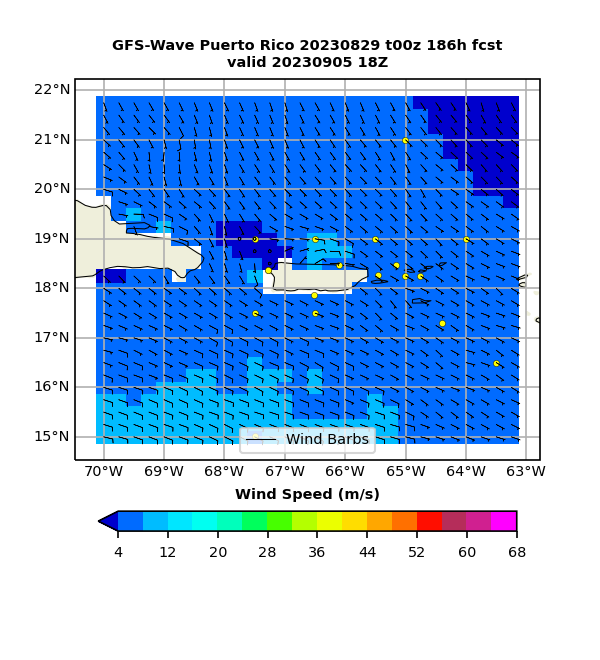
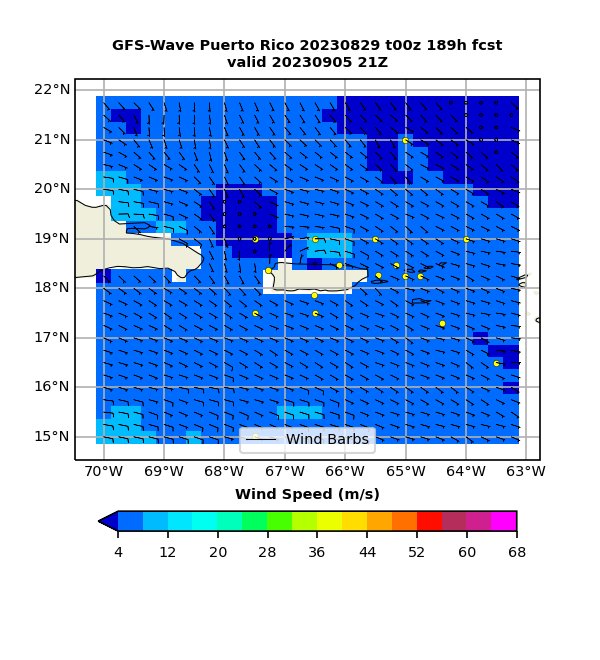
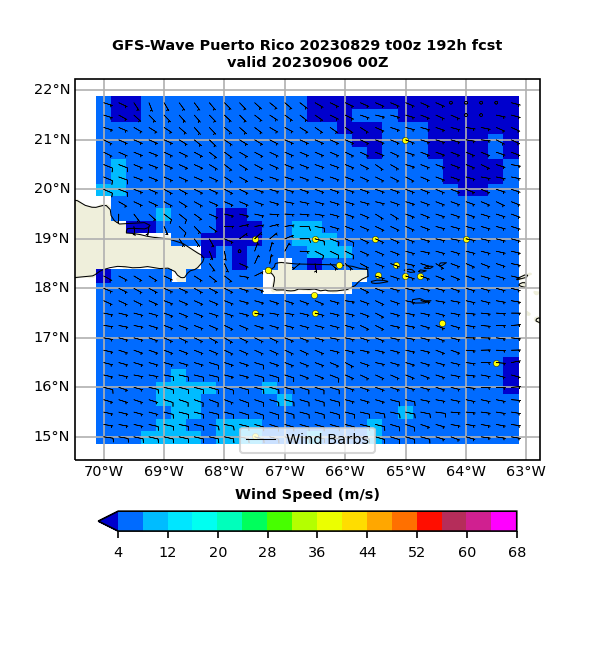
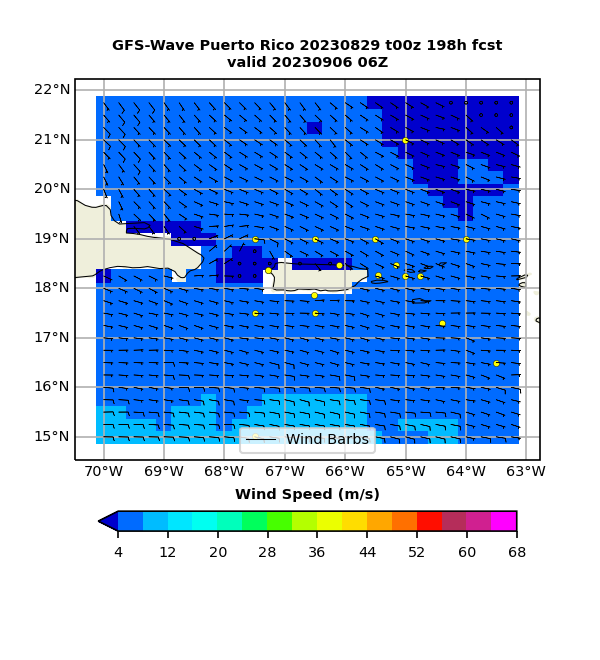
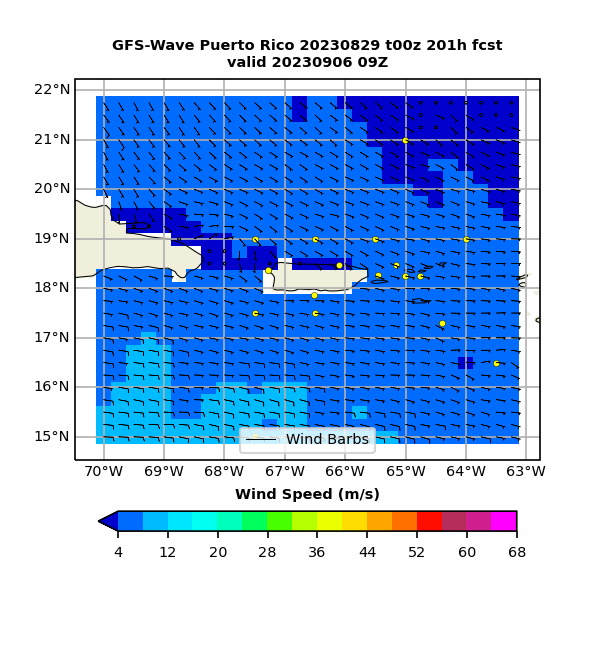
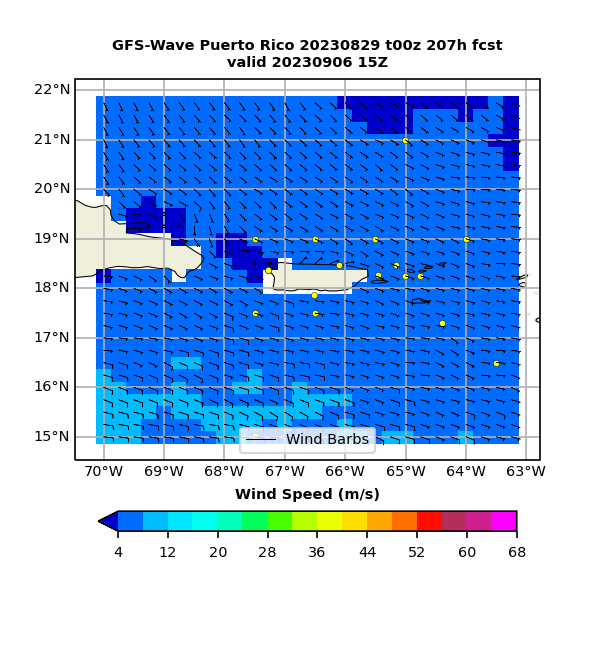
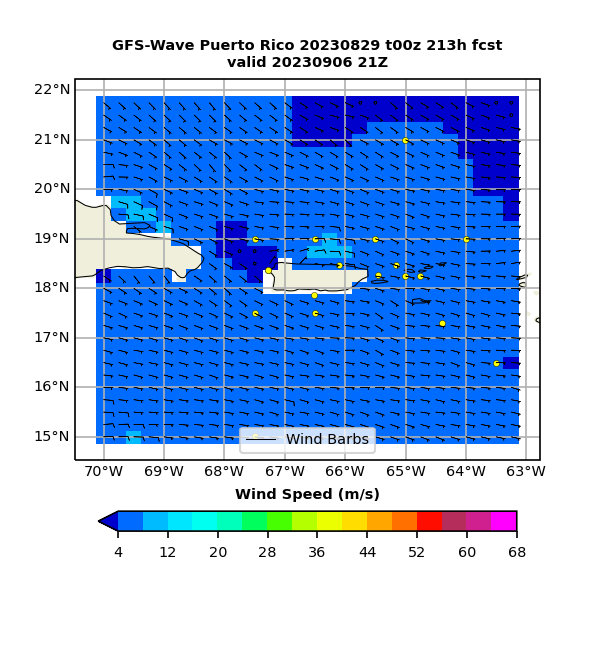
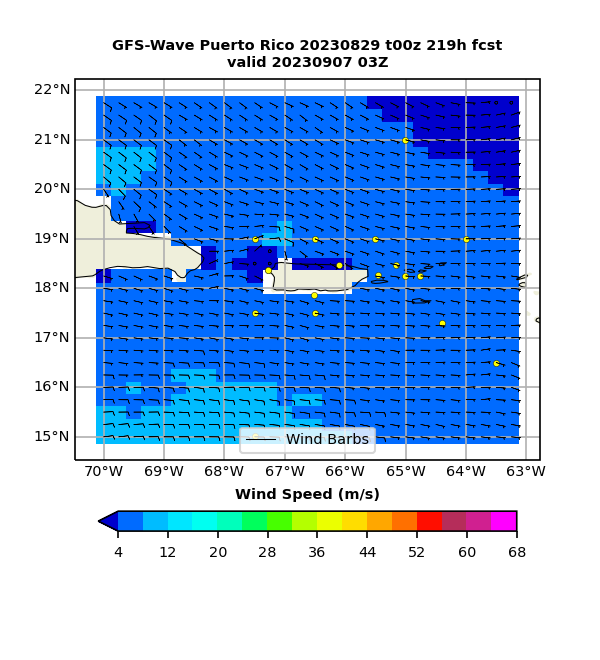
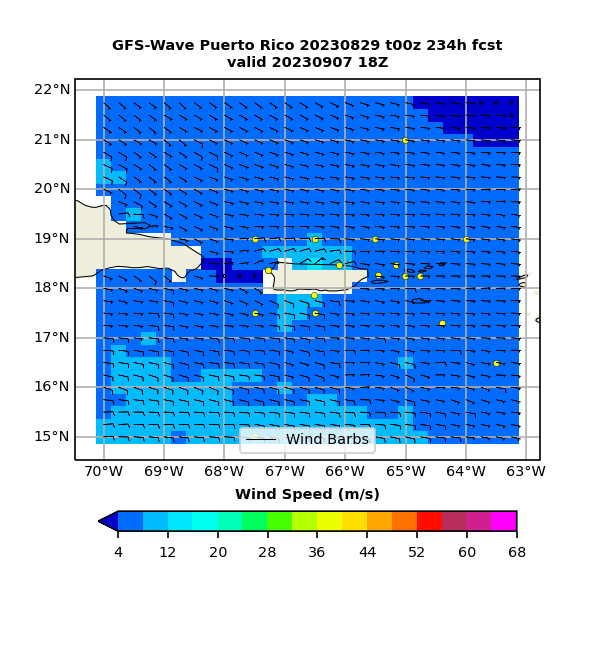
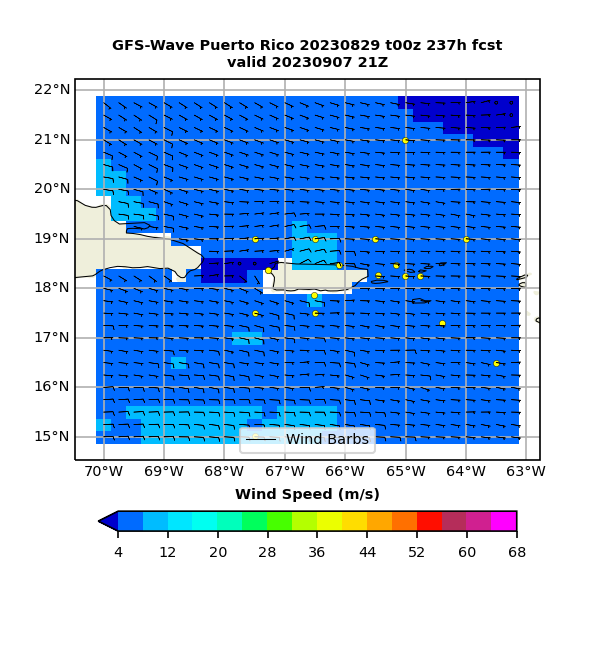
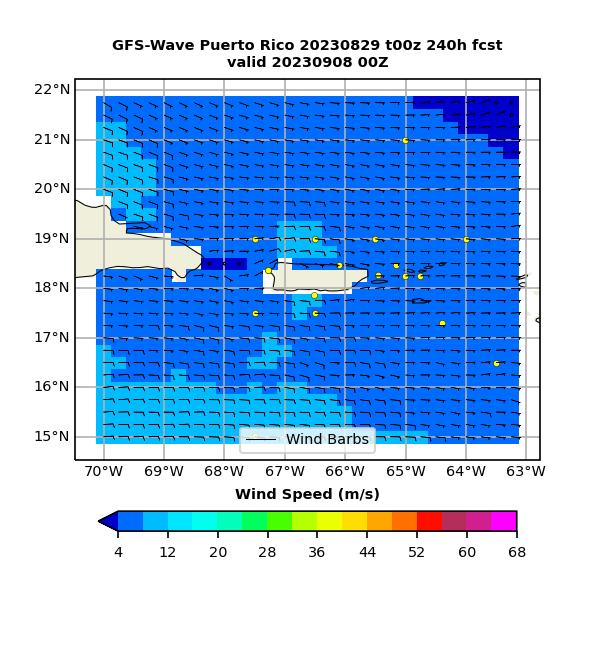
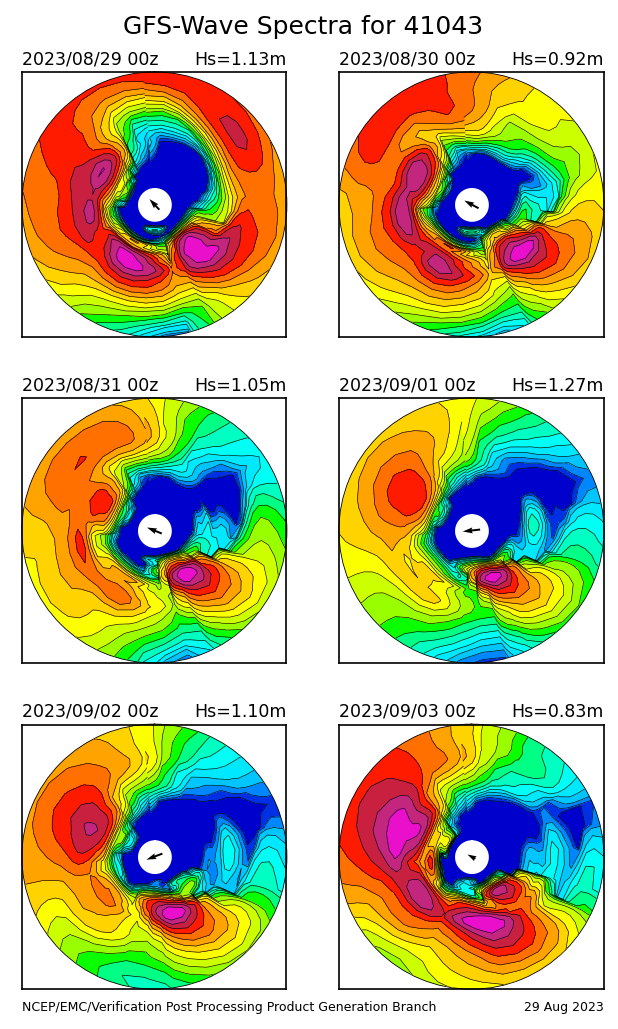
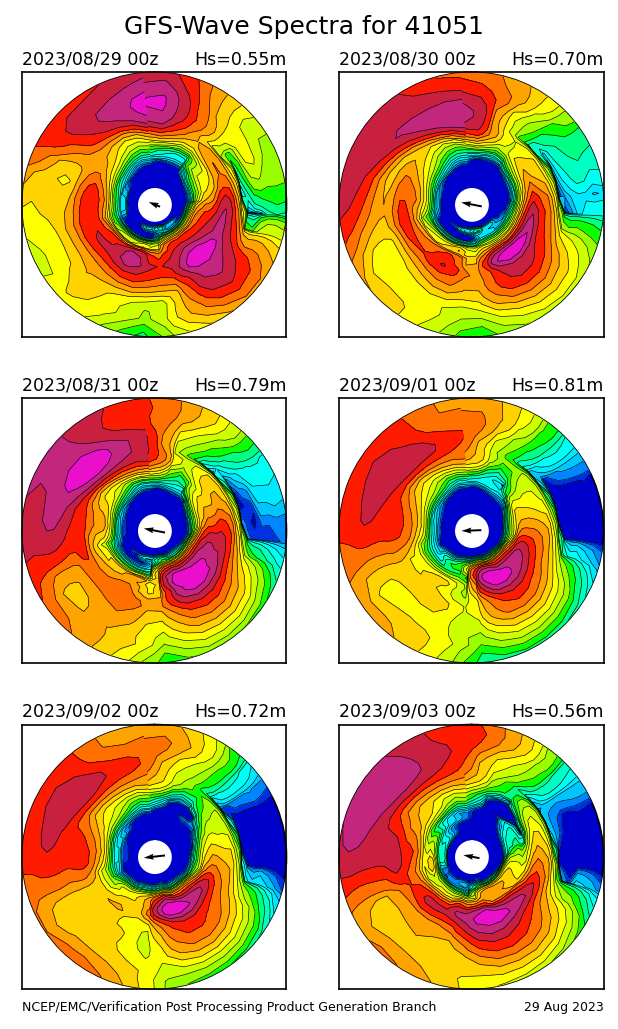
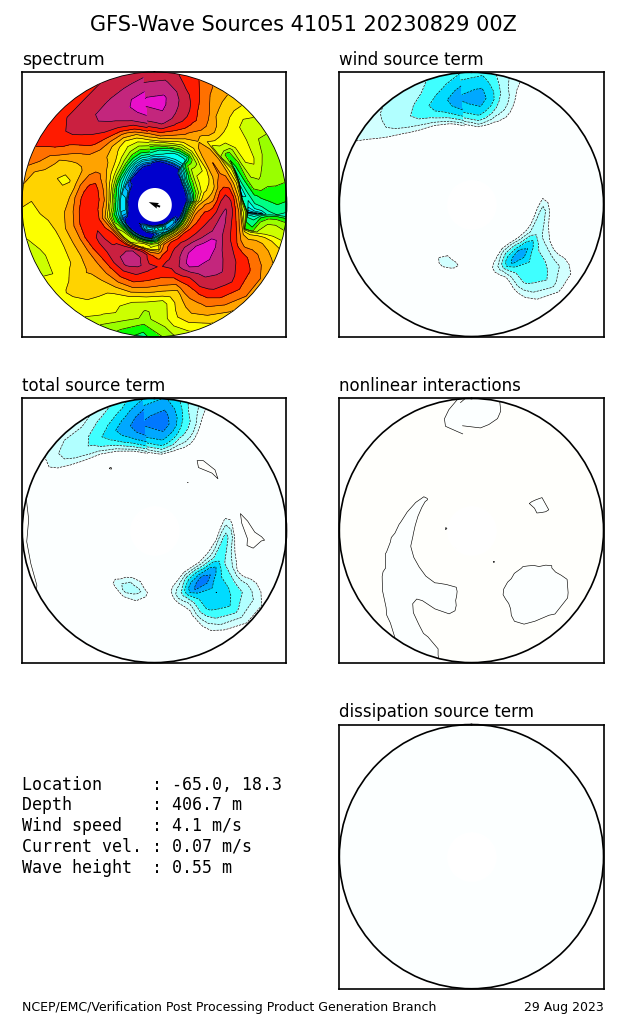
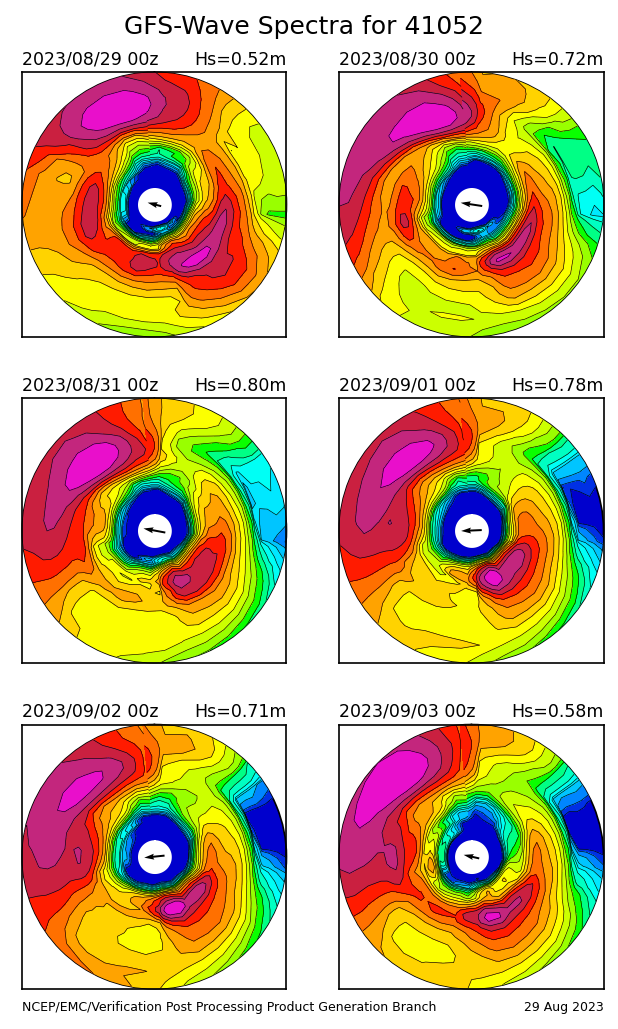
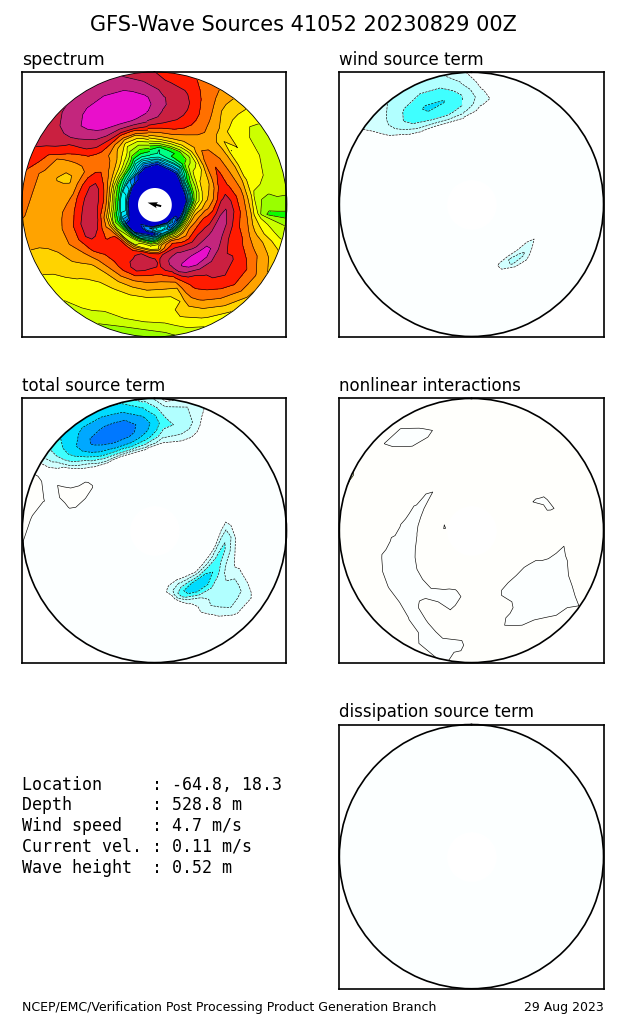
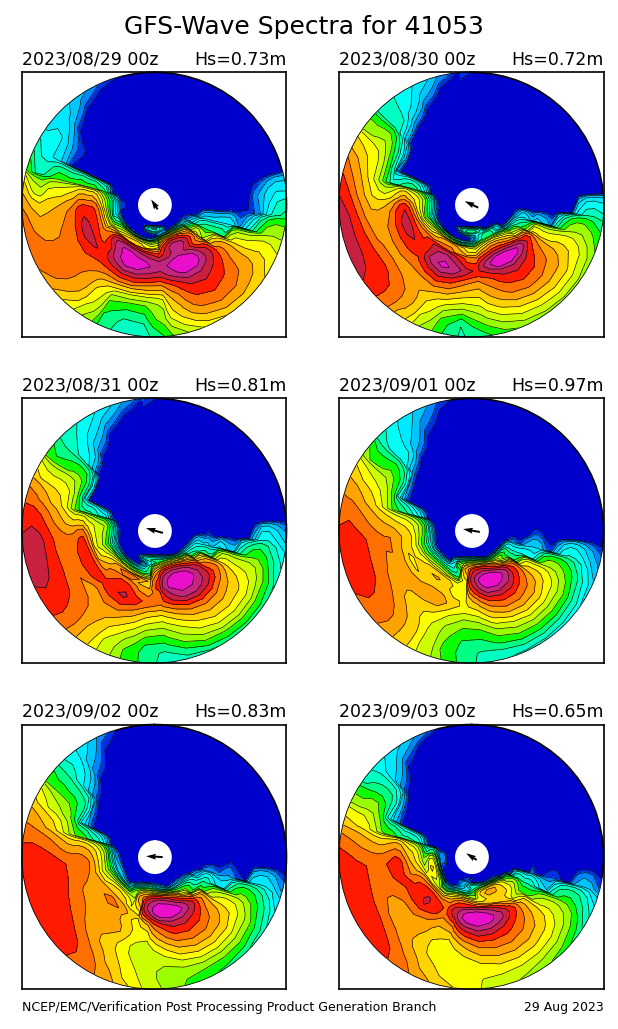
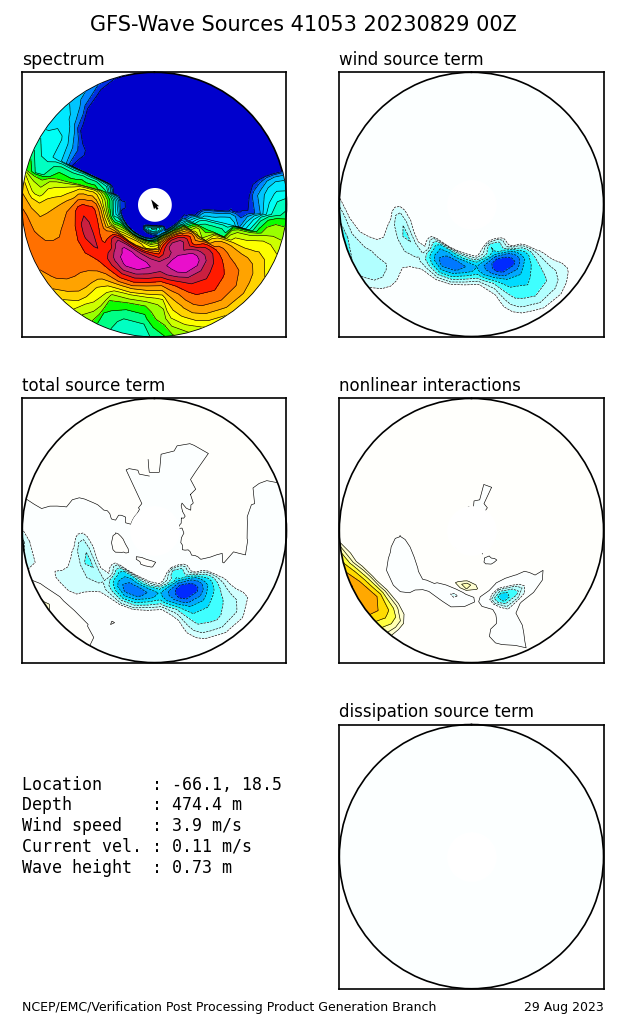
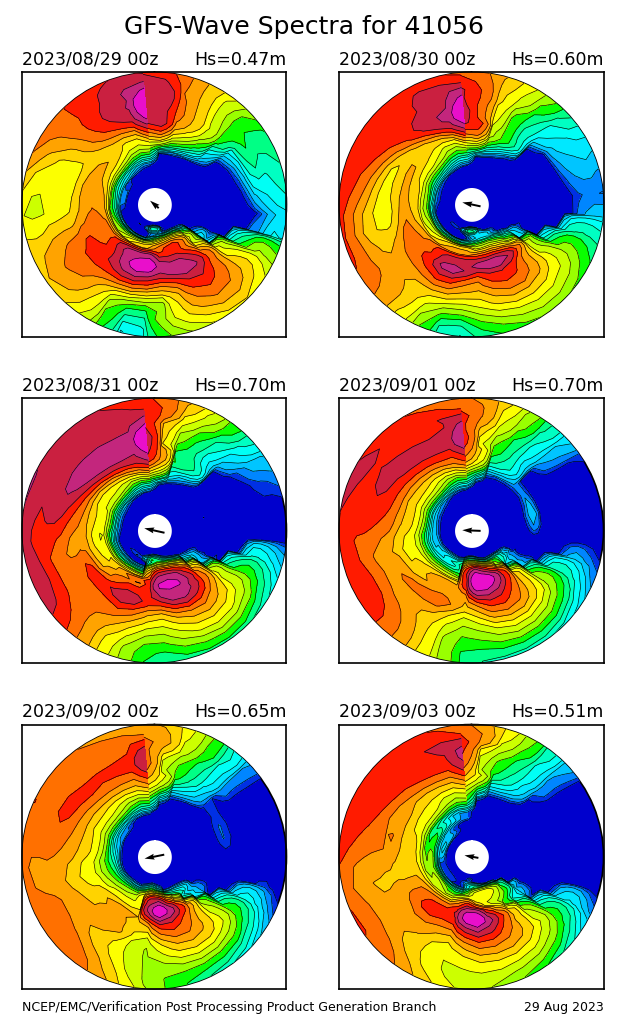
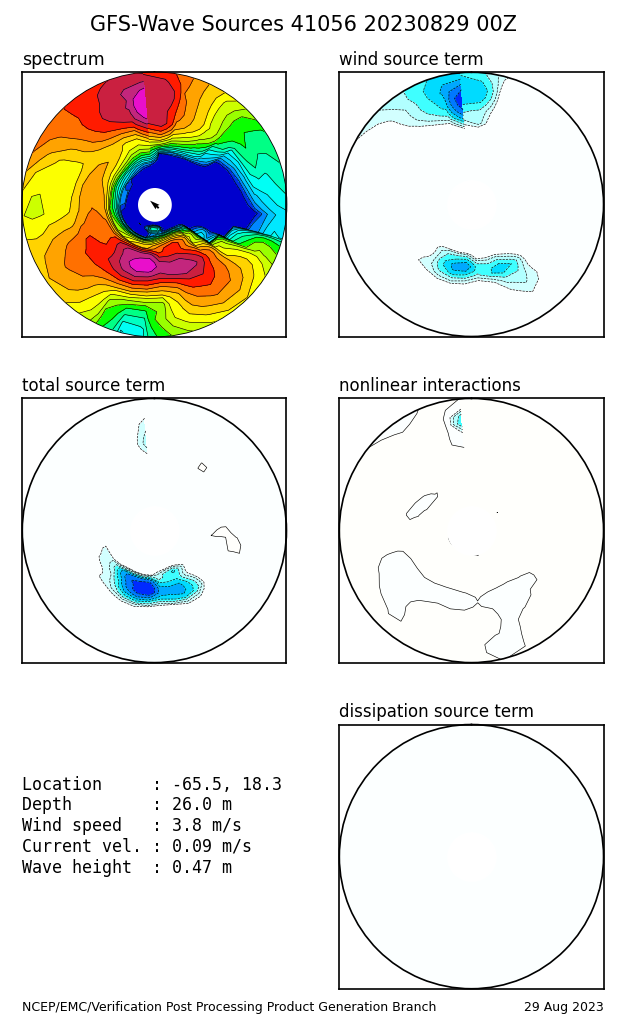
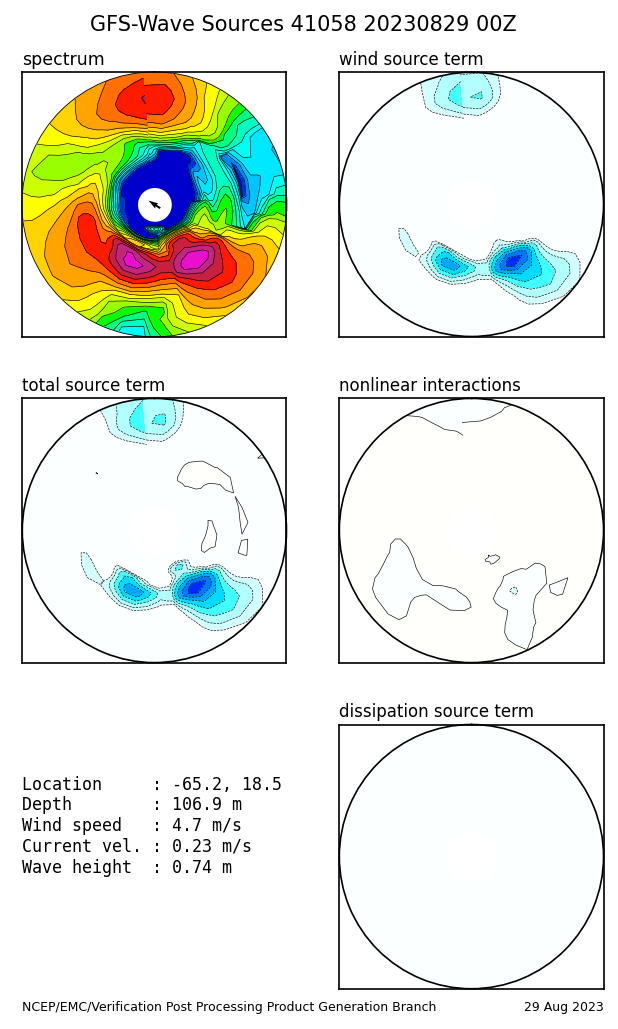
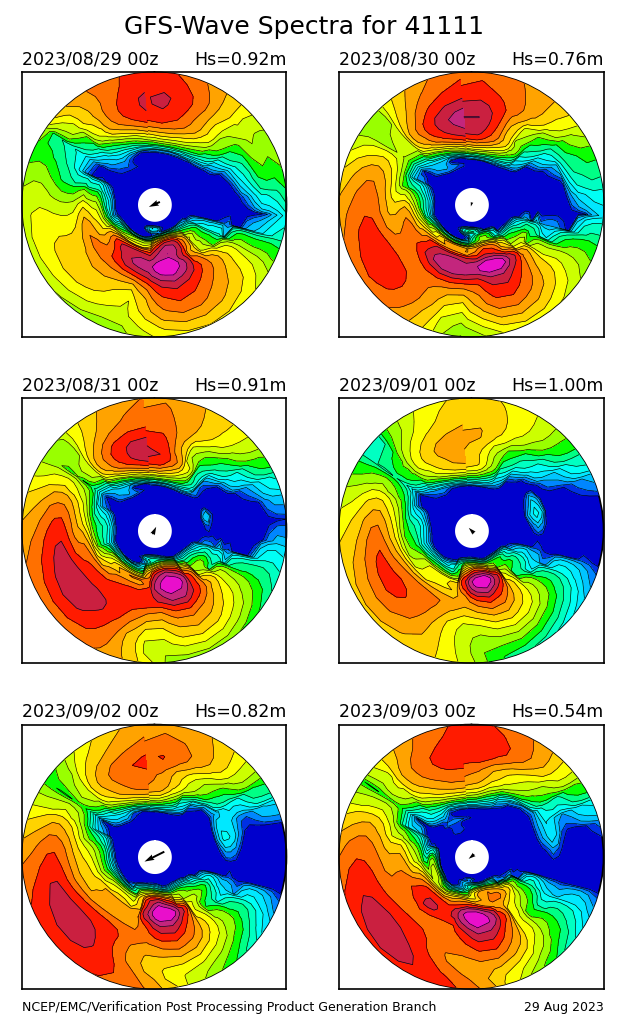
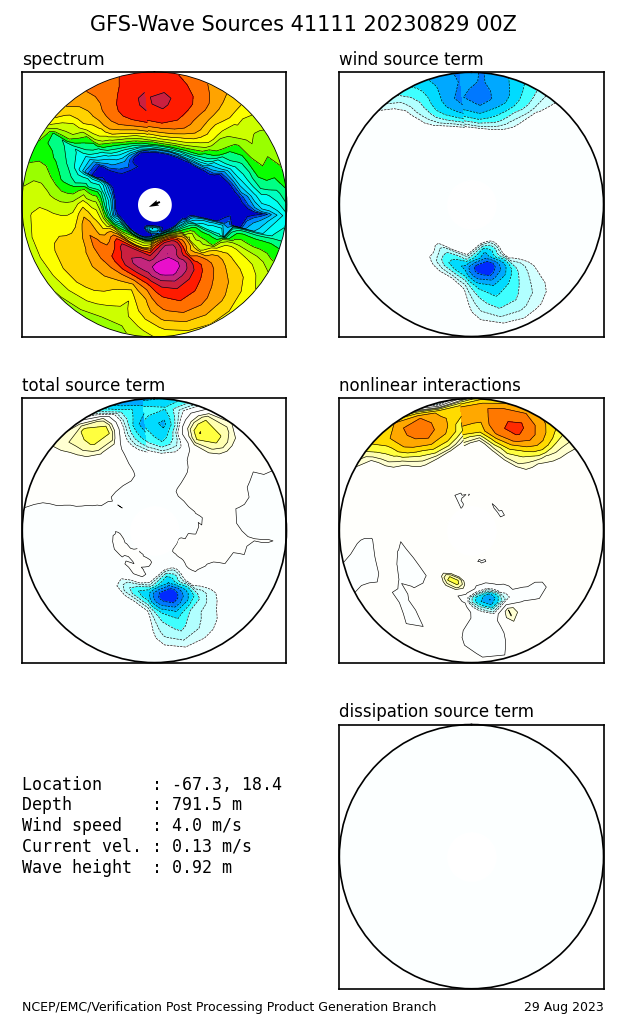
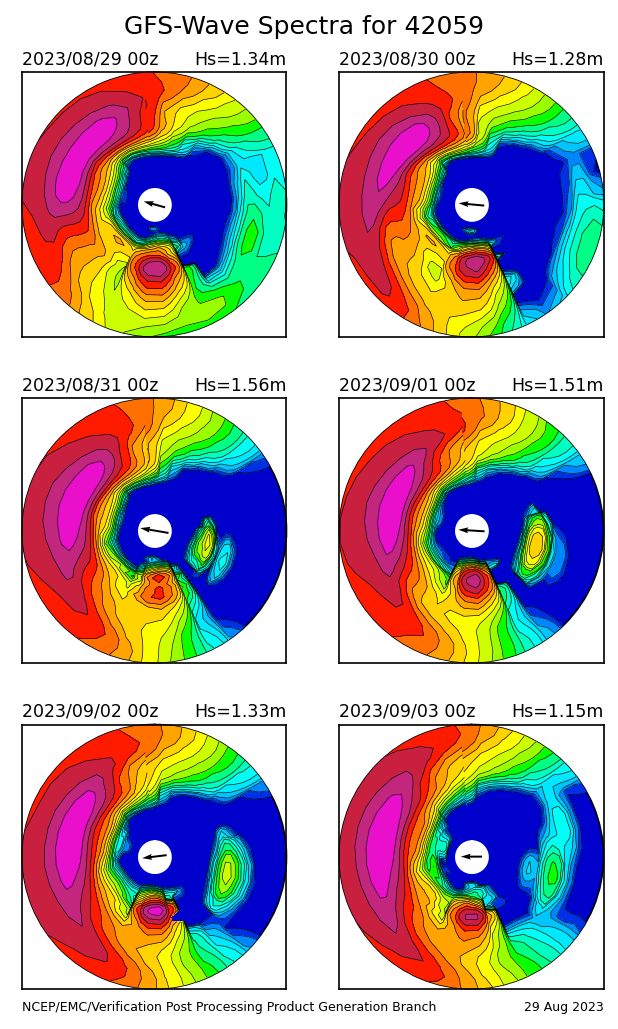
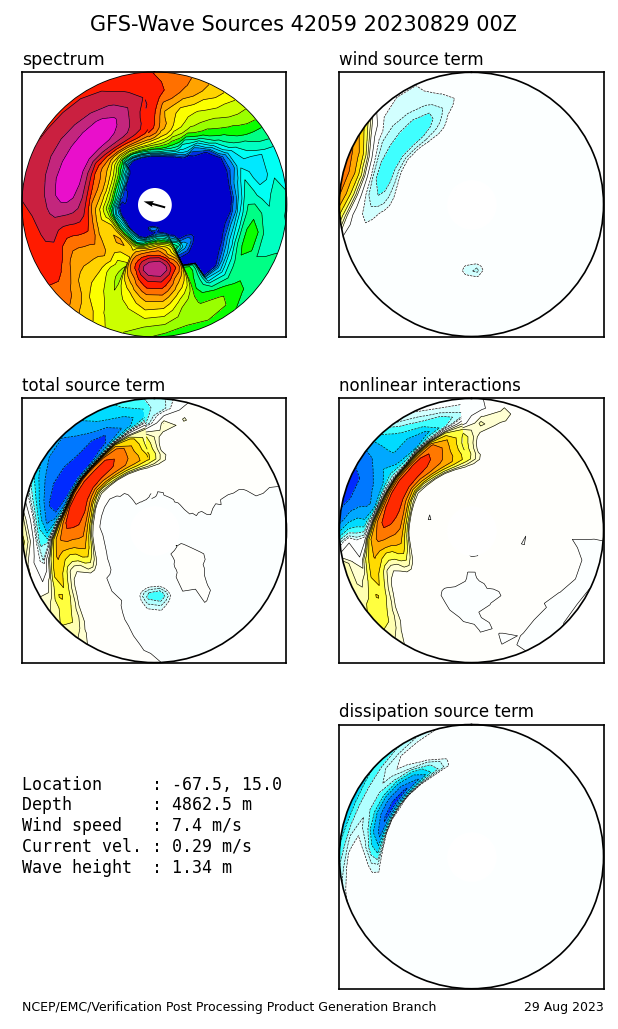
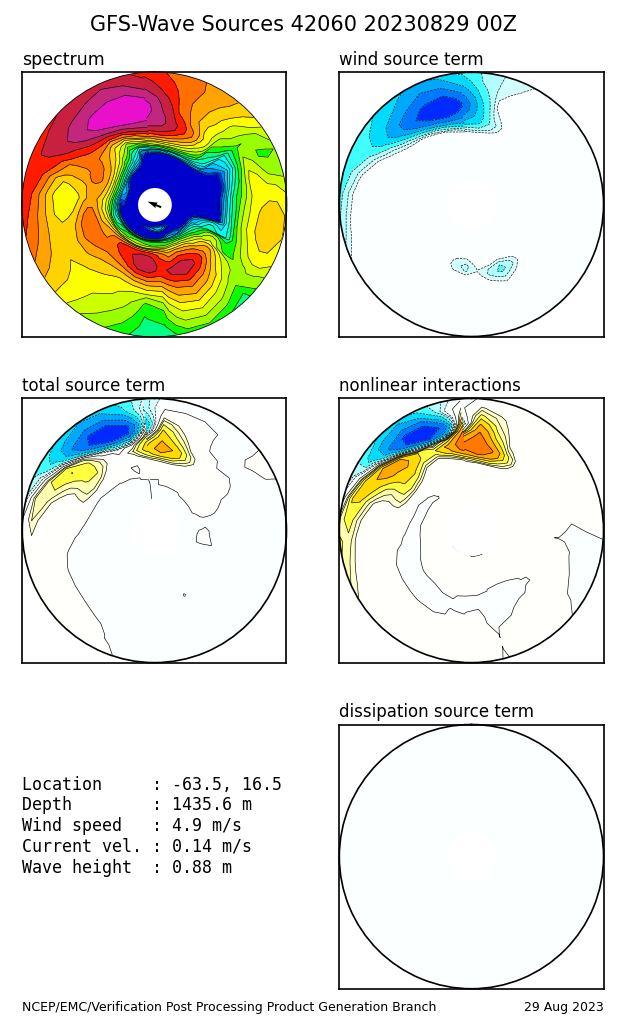
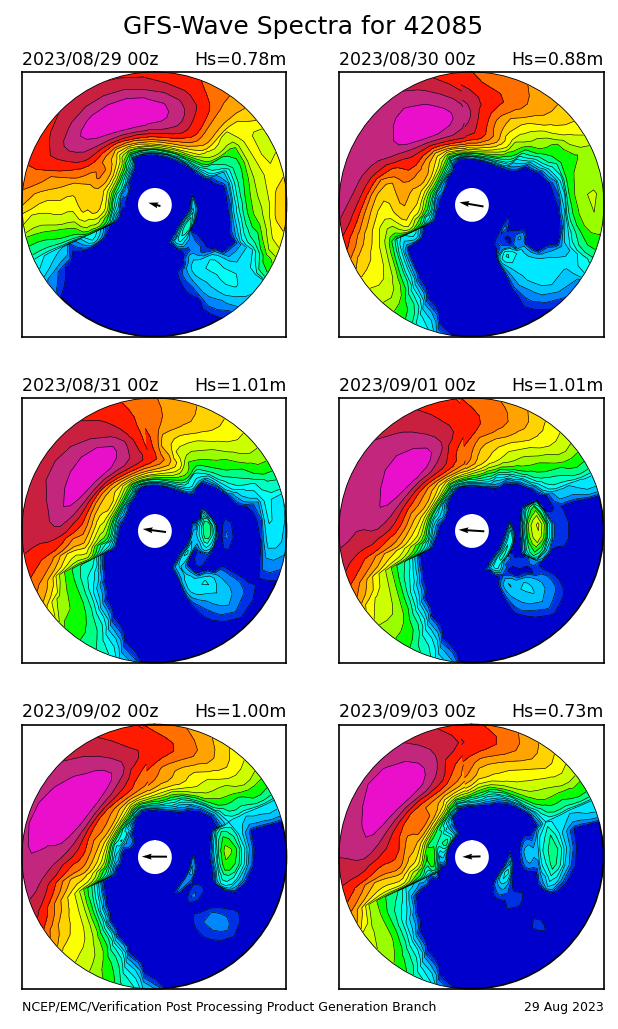
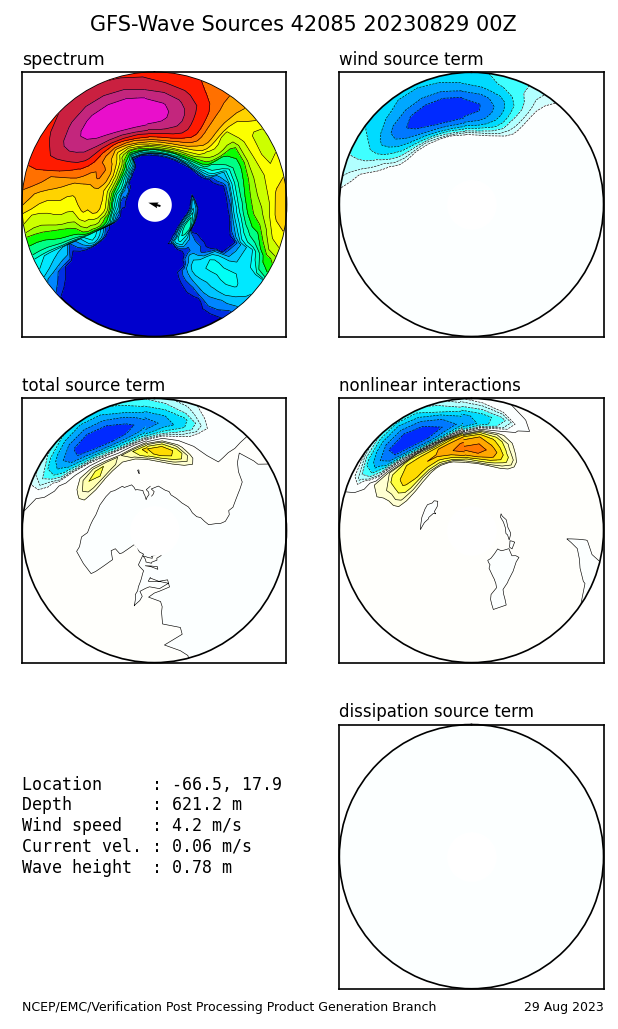
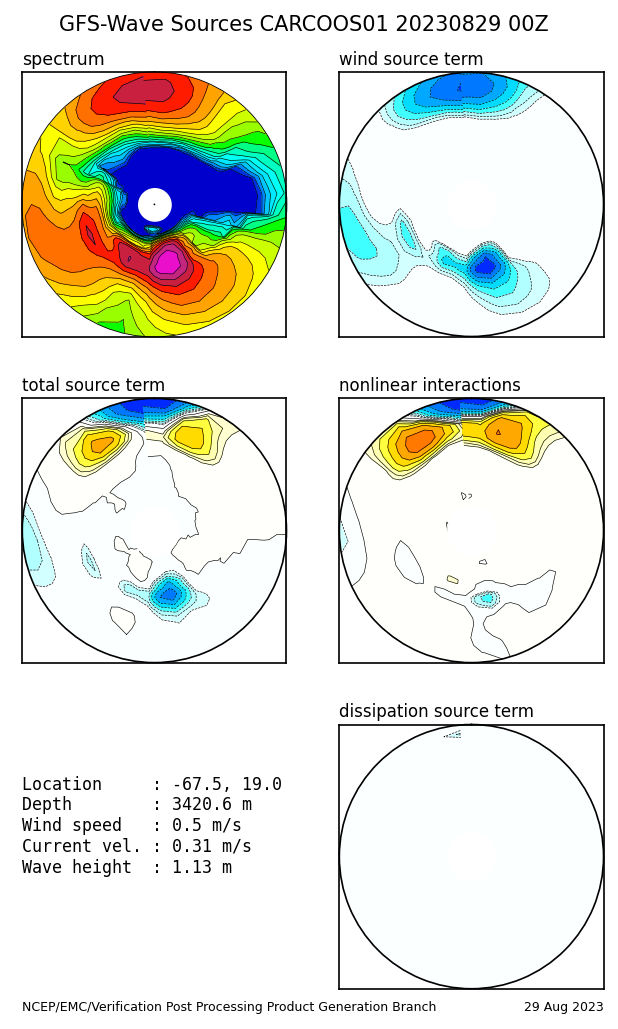
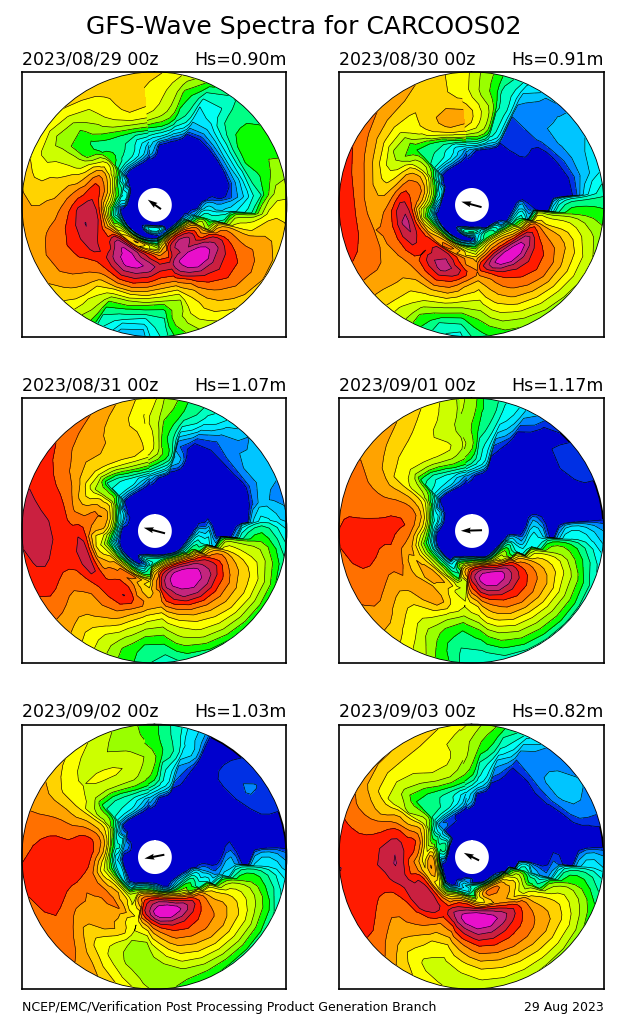
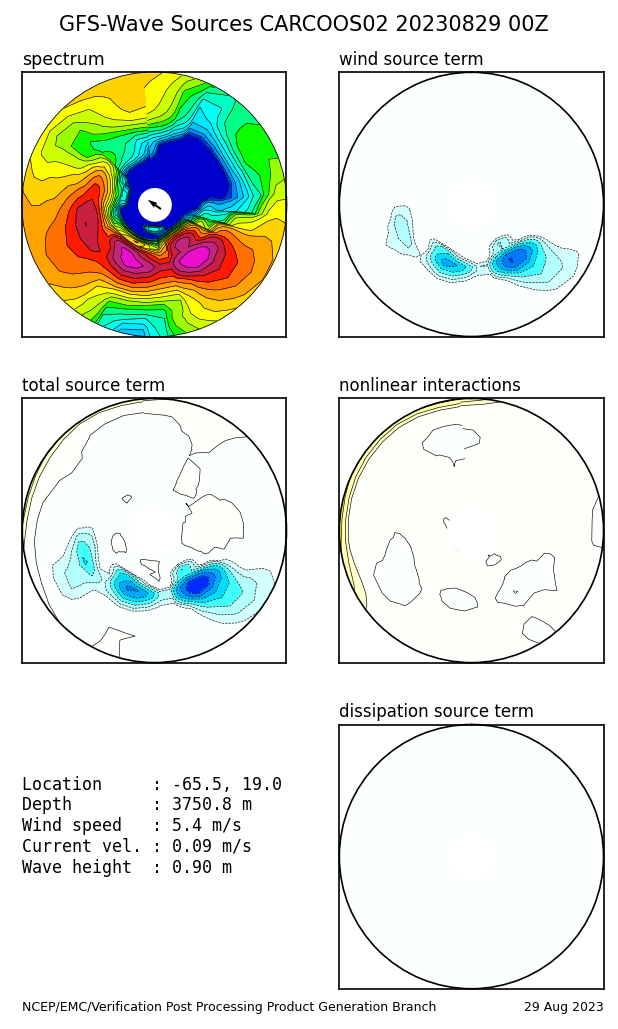
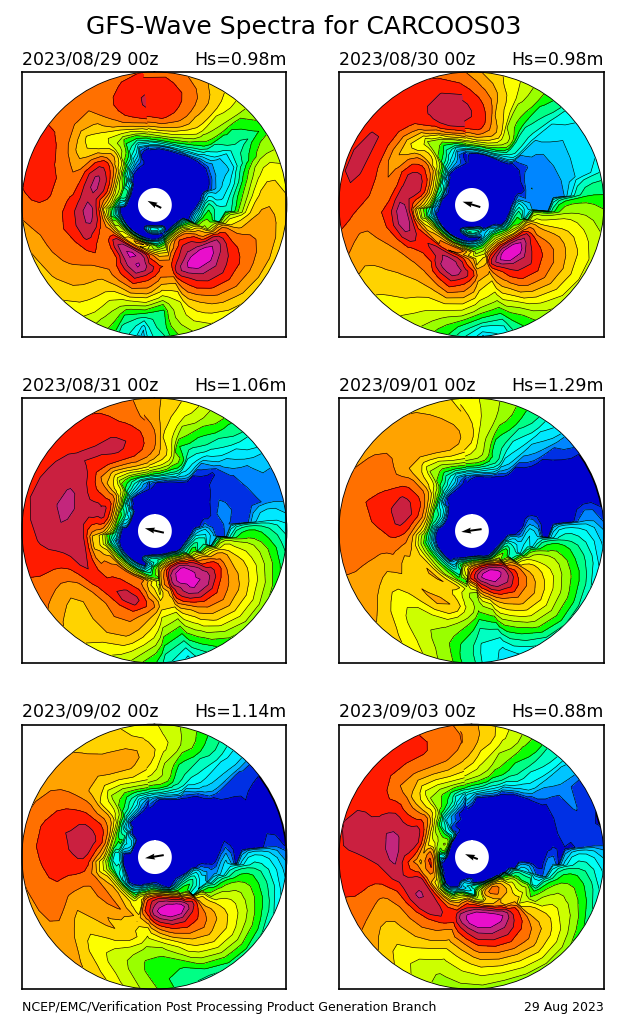
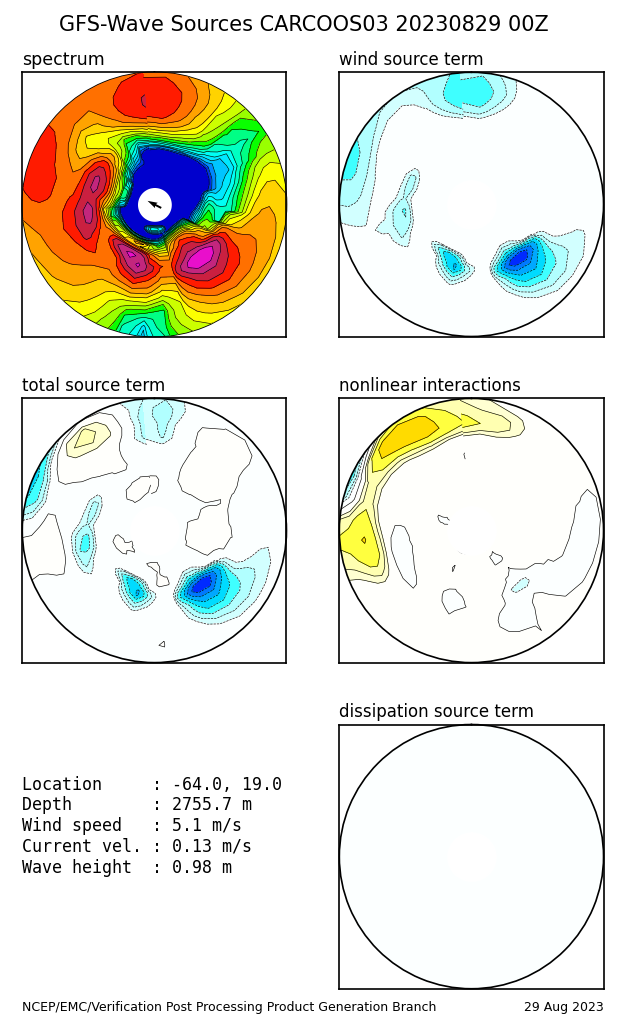
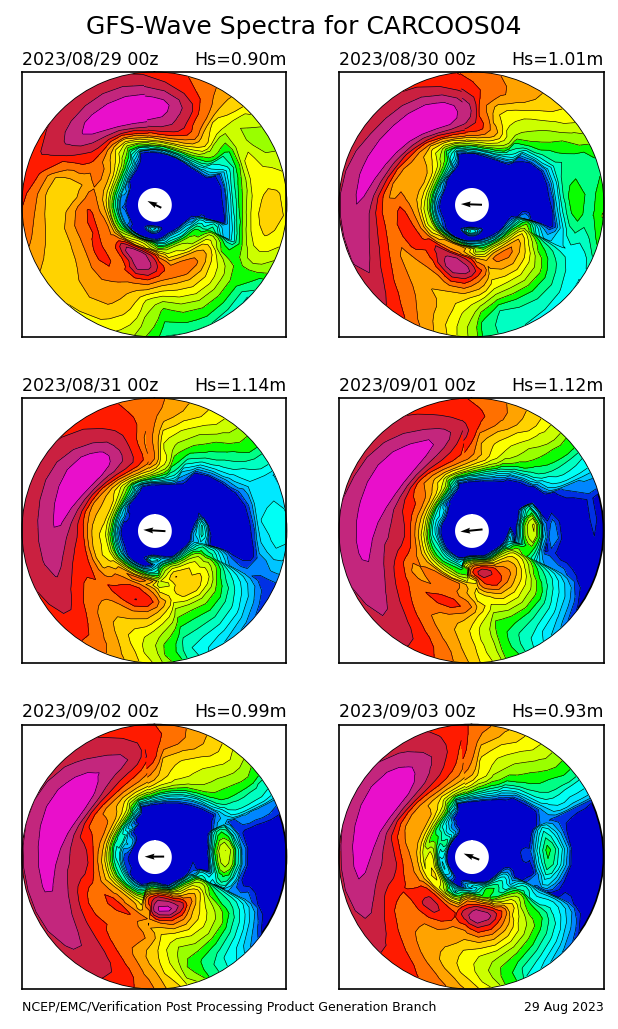
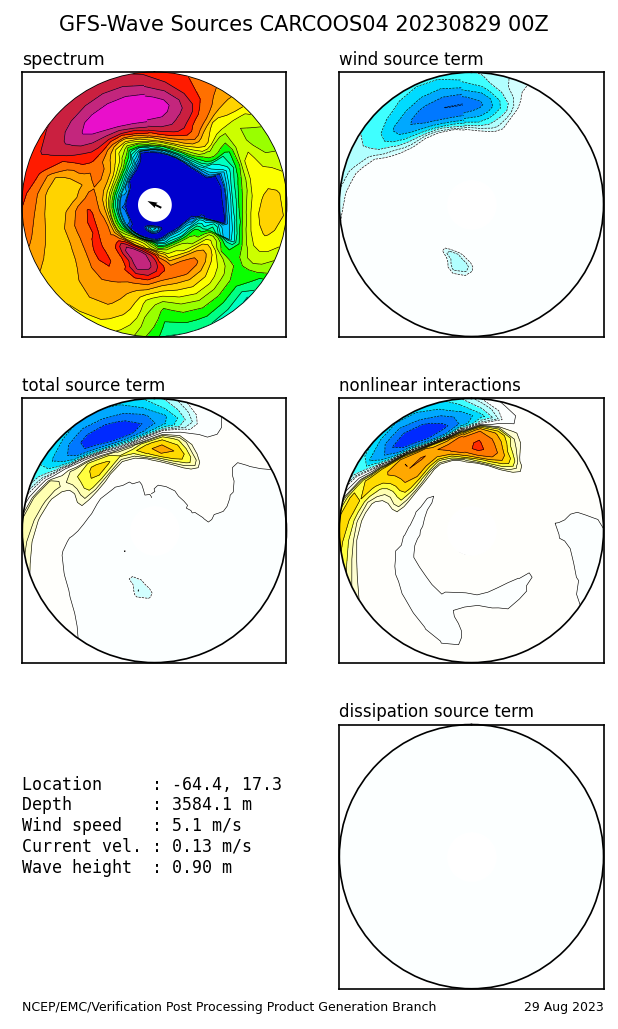
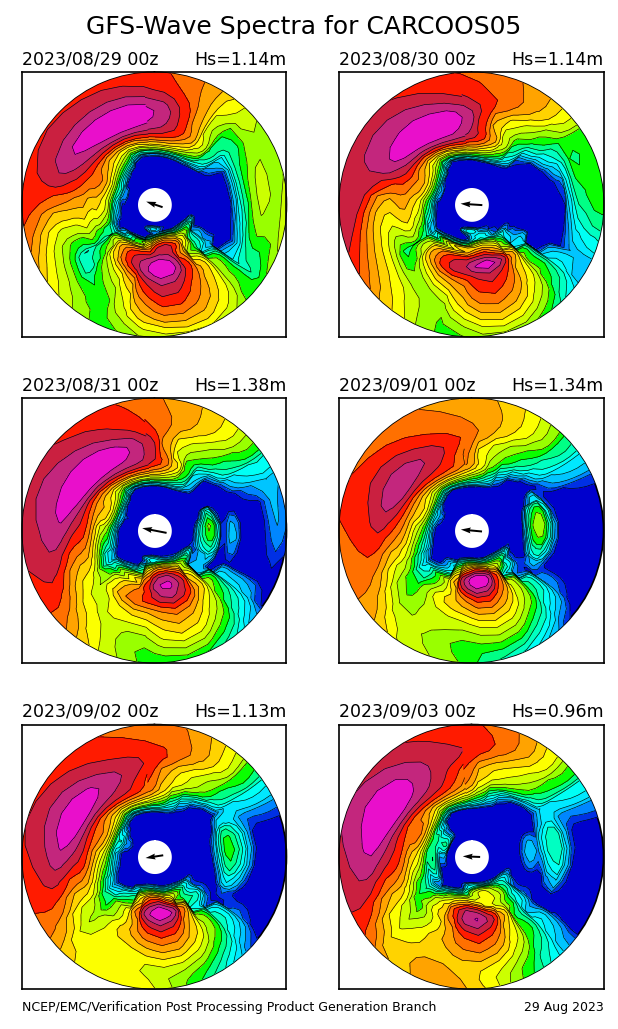
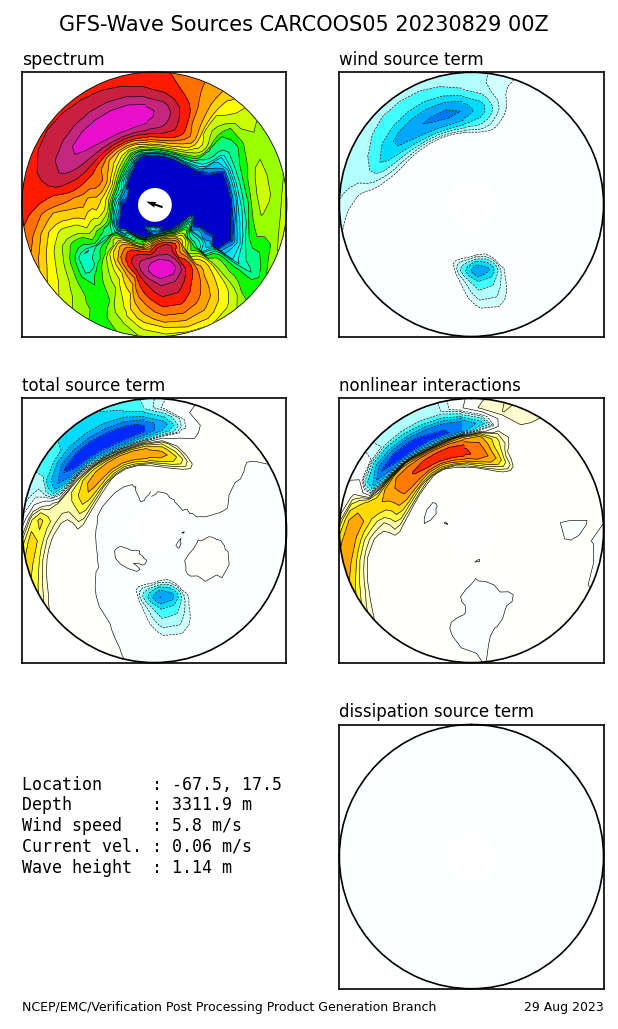
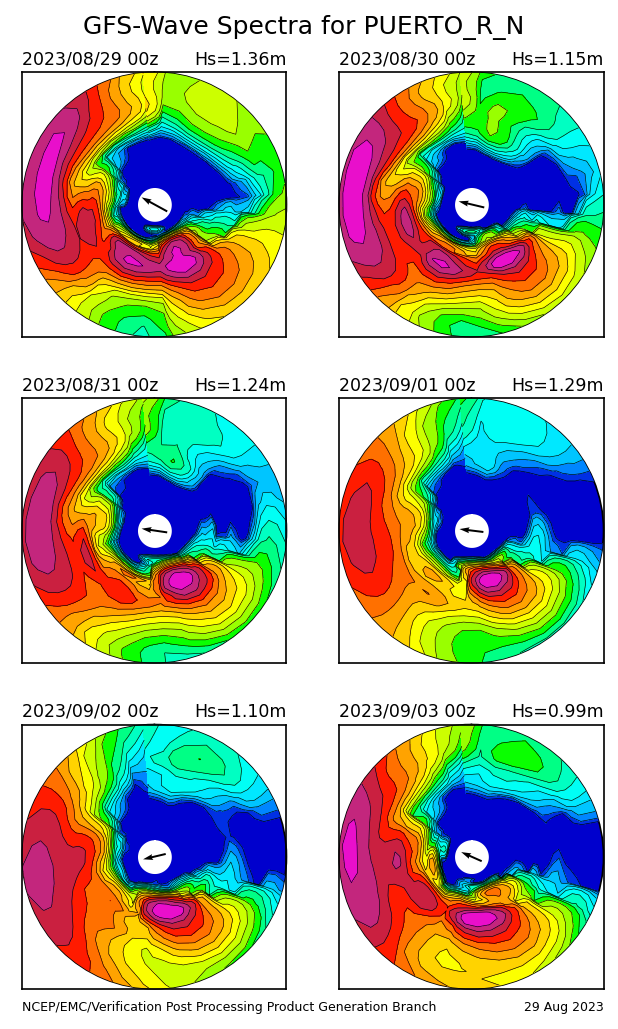
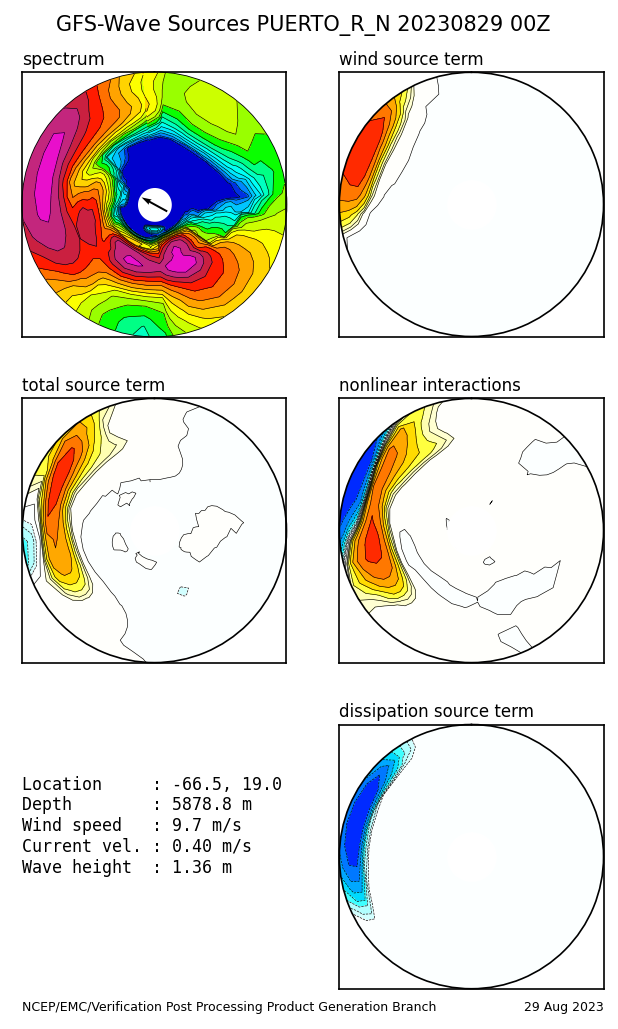
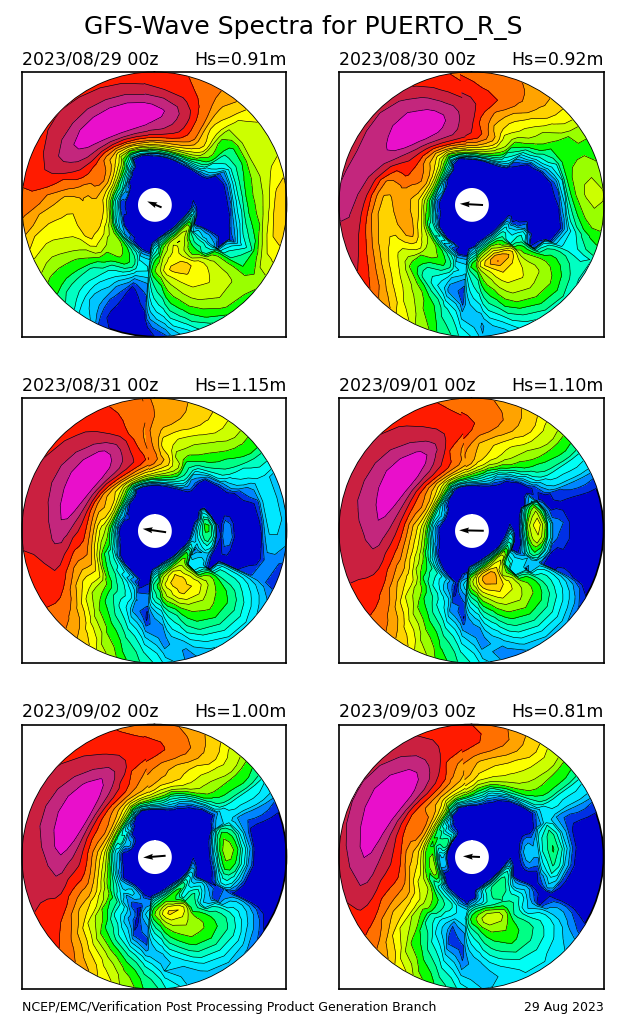
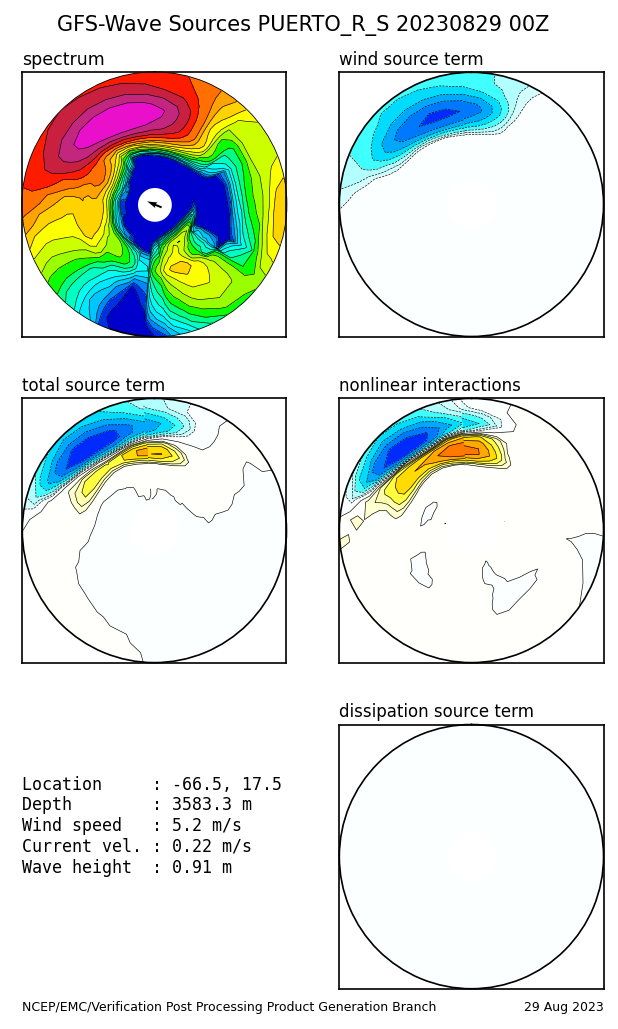
Here you can view any of the individual WAVEWATCH III® graphic products generated during the last six model runs. Simply follow the steps and click to choose the Model, Forecast Zone, Model Run Time, Product, and then click on a Forecast Time (0 is the nowcast, negative times are hindcasts, positive times are forecasts). Buoy information for the selected region is also given in the form of spectral plots, source term plots, and Spectral Bulletins.
| GFS-Wave |
Great Lakes (NDFD Winds) |
| Latest run |
6 hours back |
12 hours back |
18 hours back |
24 hours back |
30 hours back |
| 0 | 3 | 6 | 9 | 12 | 15 | 18 | 21 | 24 | 27 | 30 | 33 | 36 |
| 39 | 42 | 45 | 48 | 51 | 54 | 57 | 60 | 63 | 66 | 69 | 72 | 75 |
| 78 | 81 | 84 | 87 | 90 | 93 | 96 | 99 | 102 | 105 | 108 | 111 | 114 |
| 117 | 120 | 123 | 126 | 129 | 132 | 135 | 138 | 141 | 144 | 147 | 150 | 153 |
| 156 | 159 | 162 | 165 | 168 | 171 | 174 | 177 | 180 | 183 | 186 | 189 | 192 |
| 195 | 198 | 201 | 204 | 207 | 210 | 213 | 216 | 219 | 222 | 225 | 228 | 231 |
| 234 | 237 | 240 |
About Us
About the MMAB -
Mission -
Other NCEP Centers -
MMAB Personnel -
NOAA Locator
NOAA/
National Weather Service
National Centers for Environmental Prediction
Environmental Modeling Center
Marine Modeling and Analysis Branch
5200 Auth Road
Camp Springs, Maryland 20746-4304 USA
Comments/Feedback
Disclaimer
Privacy Policy
Page last modified: Friday, 03-Sep-2021 15:10:09 UTC