![[NCEP Logo]](/mmab/images/ncep80.gif)
Daily Ensemble Verification of the RTG_SST_HR analysis with independent data
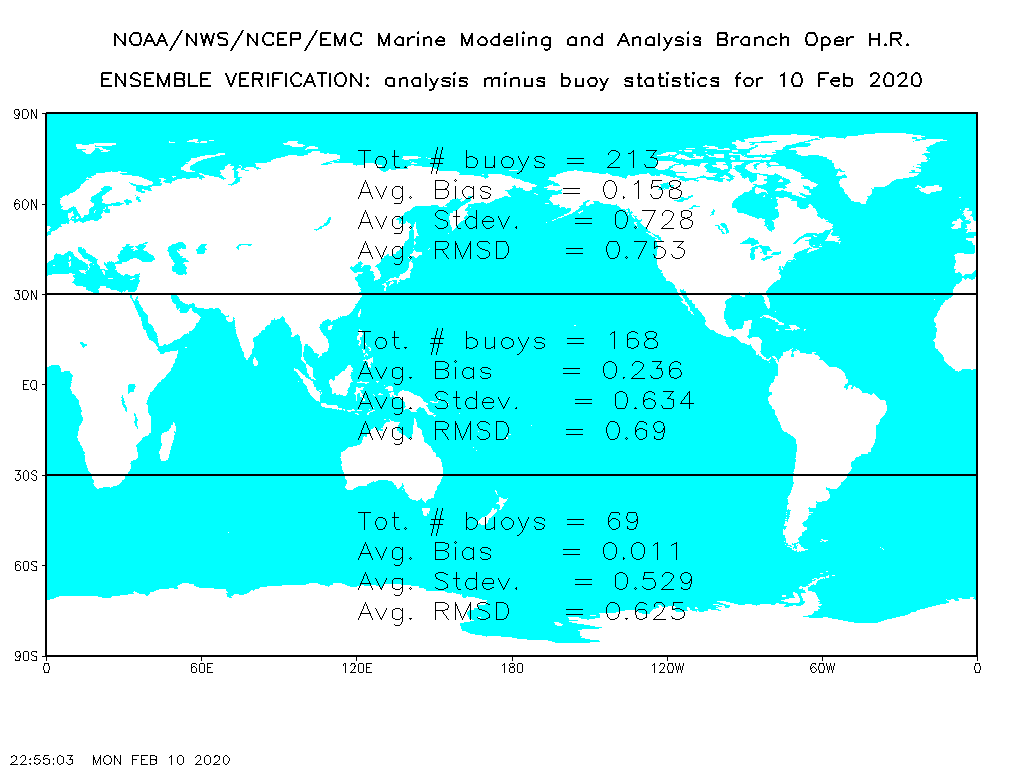
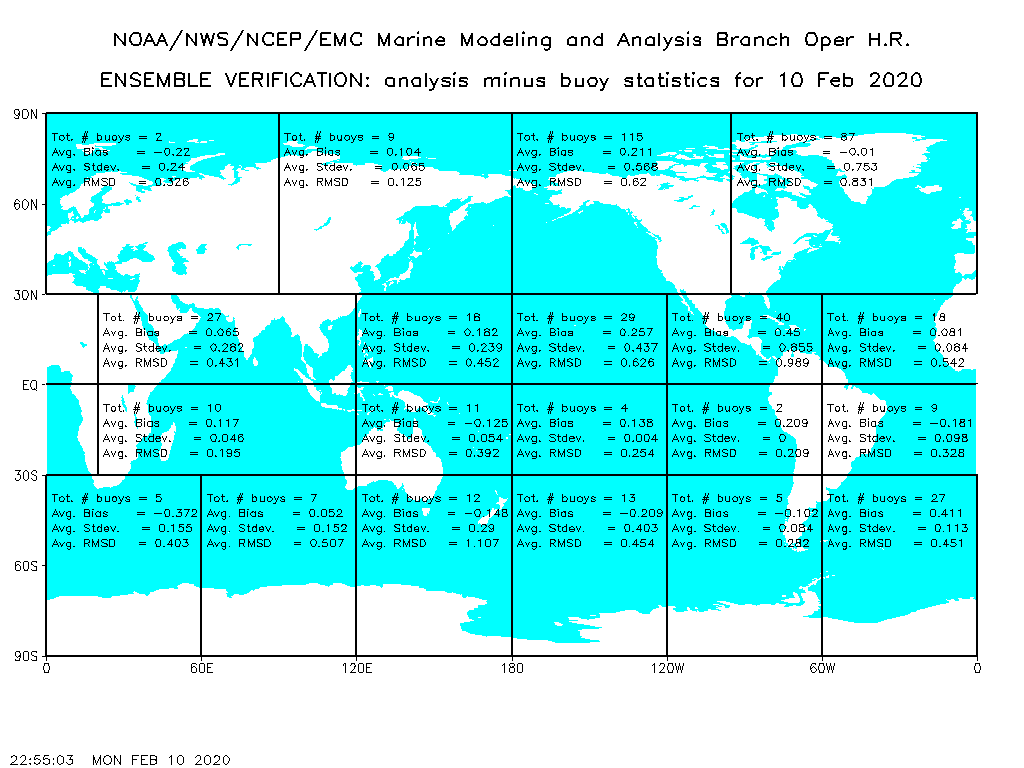
EVALUATION STATISTICS:
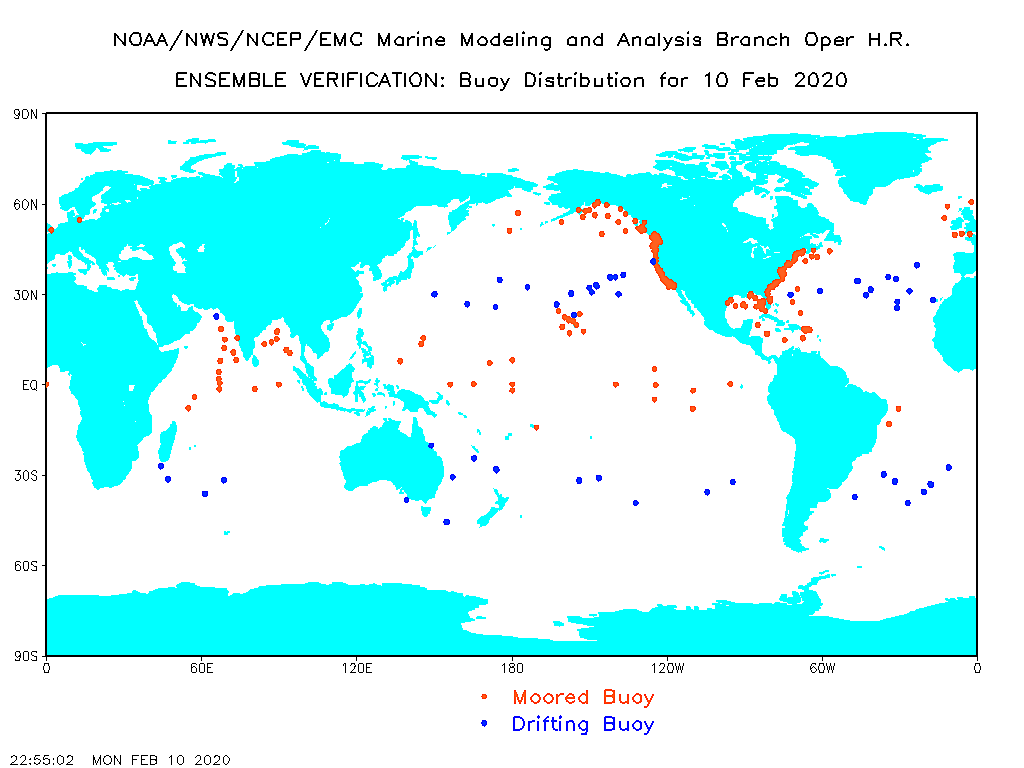
BUOY DISTRIBUTION:
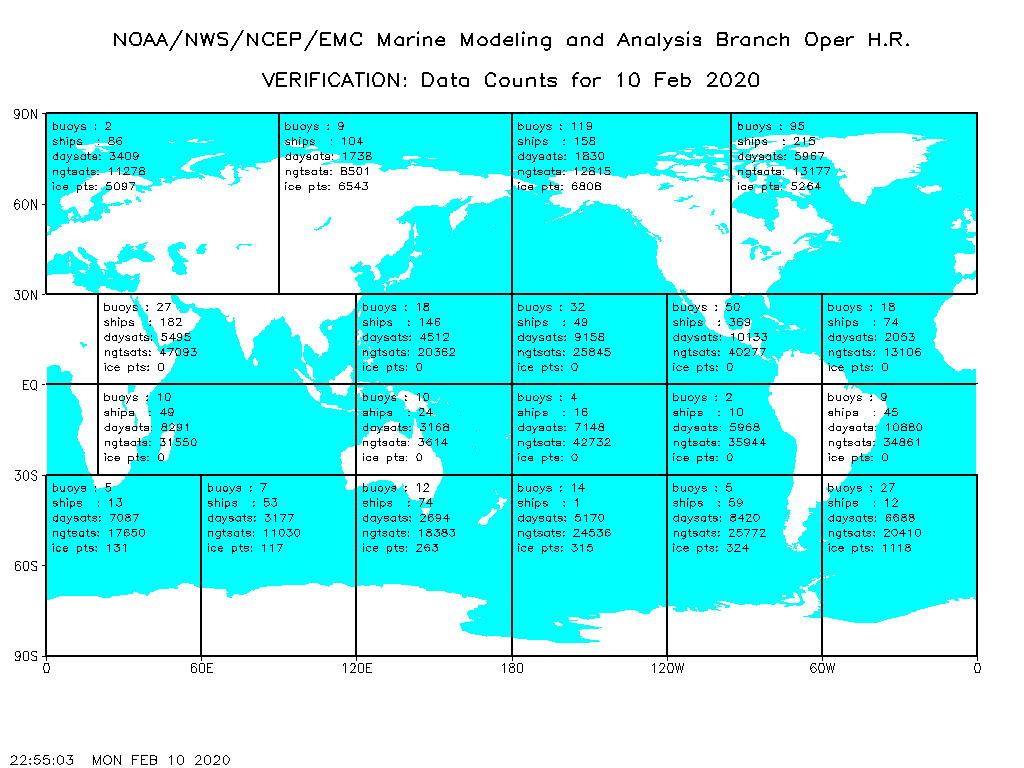
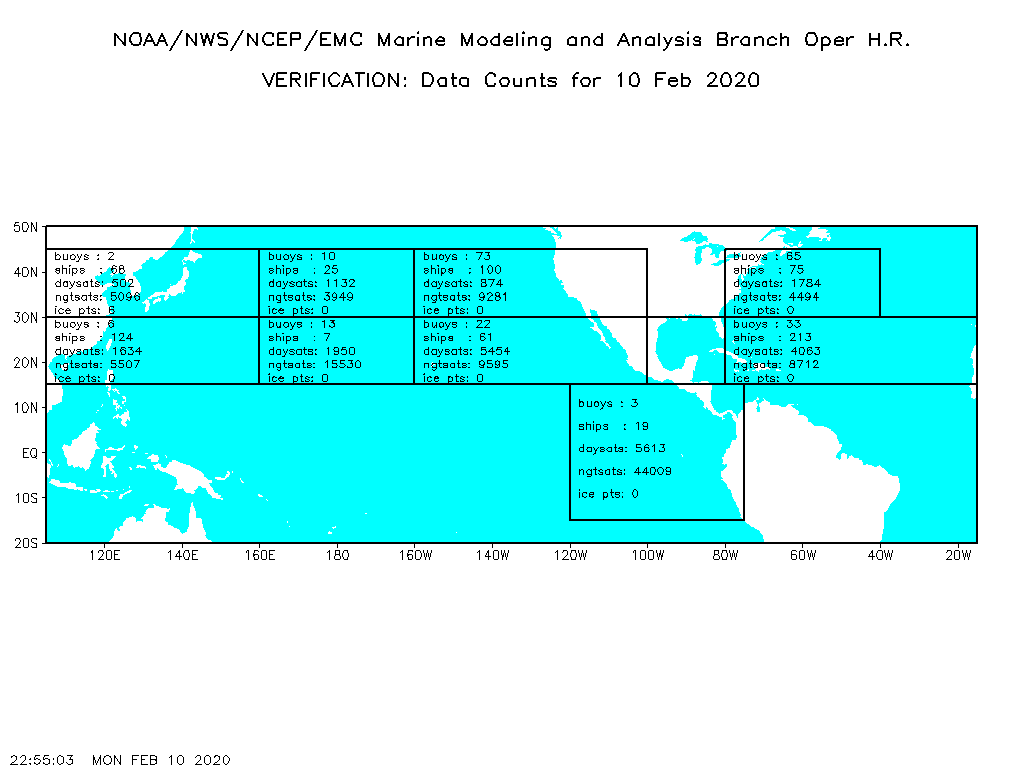
DATA COUNTS:


Verification of the real-time, global, sea surface temperature high-resolution analysis (the RTG_SST_HR), using independent data, is a routine element of the daily analysis production suite.
Verification statistics are generated with five "parallel runs" of the high-resolution analysis. The data quality control, satellite bias correction and SST analysis algorithms of the parallels are identical to those of the high-resolution run. Also, each parallel ingests identical in situ and satellite SST reports, except for the specific subset of buoy reports that is withheld and used for independent comparison of the product SST values at the locations of the withheld observations.
The buoys whose reports are withheld and used for verification in each of the five parallel analyses are determined by the final digit of the five-digit platform identifier: Those ending in 0 and 5, 1 and 6, 2 and 7, 3 and 8, and 4 and 9. This method of selecting independent data for verification of analysis products provides random-like geographic distributions of approximately 220 in situ platforms with the withheld buoys totaling about 20% of all moored and drifting buoys in the full database, for each parallel. Every buoy that passes data quality control is used for independent-data-verification in exactly one parallel and is included in each of the other four.
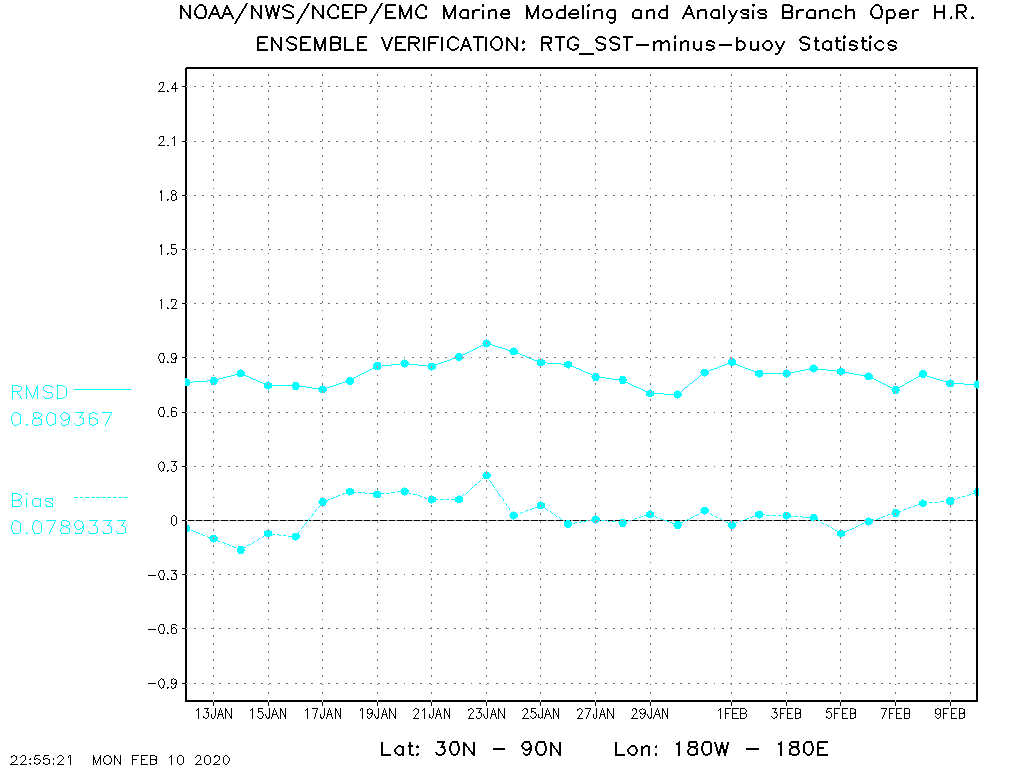
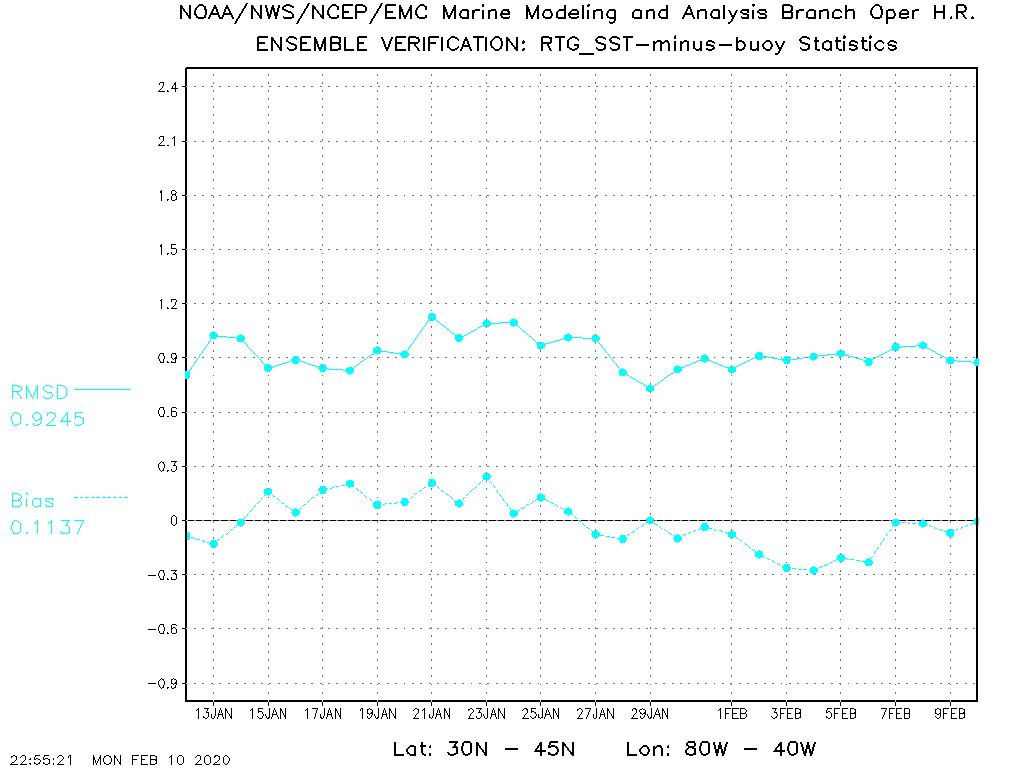
Statistics calculated for each parallel analysis include the number of analysis-independent quality-controlled buoy observations used for verification, in addition to the bias, standard deviation of the bias and root-mean-square-difference (RMSD) between analysis and buoy values. The latter are calculated by differencing collocated values of the global SST analysis product field with the SST values from the independent buoy reports. Bias, standard deviation of the bias and RMSD "ensemble statistics" are calculated by averaging these statistics over the five parallel analyses.
The ensemble statistics are computed daily, for each of 33 sub-regions; their values are printed within the (latitude, longitude)-delineated sub-regions, in three, global displays. Click on the thumbprints of the verification graphics in the margin of this page to view the latest statistics. In addition, a daily, buoy-distribution map is provided to show the geographic distribution of all moored and drifting buoys: open circles indicate locations of moored buoys and solid circles the locations of drifting buoys.
Daily analysis-data-inventories enumerate the numbers of day- and night-satellite super-observations, the numbers of SST values from buoys and ships, and the numbers of 1/12 o x 1/12 o gridded sea-ice values ingested by the high-resolution analysis, within each region. Click on the thumbprints of the data-inventory graphics in the margin of the page to view these enumerations for the latest RTG_SST_HR analysis.
Time series of the bias and RMSD statistics are updated daily for selected regions. To view a time series for a region of interest, click on its descriptor in the following menu:
Extra-tropical northern hemisphere
Tropics
Extra-tropical southern hemisphere
North Atlantic region
Northwest Atlantic region
For additional information: Robert.Grumbine@noaa.gov.