|
NOTICE:
As of March 14, 2017, the National Centers for
Environmental Prediction (NCEP) discontinued the North
Atlantic Basin Real Time Ocean Forecasting System (RTOFS
Atlantic). This system has been superseded by the Global Real
Time Ocean Forecasting System (RTOFS Global), which became
operational October 2011.
More information is available here.
Additional documentation on using NOMADS/DODS to obtain Atlantic RTOFS model data is listed below. You may need to
install the free
Acrobat® Reader to view them.
In addition to the full-field data sets available from the MMAB FTP
and NCEP NOMADS (GDS/DODS) servers several additional subregions are available through the NOMADS
server. These are surface fields derived from the full-field
data interpolated to a regular lat/lon grid.
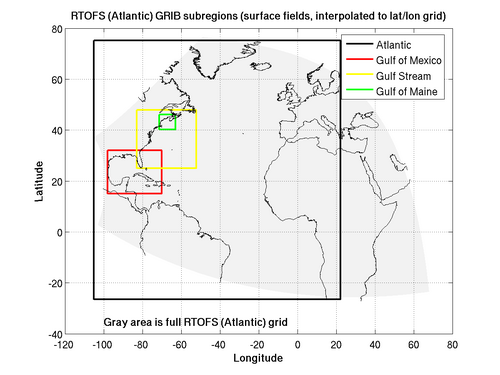 A map of the surface field subregions interpolated to
a regular lat/lon grid.
A map of the surface field subregions interpolated to
a regular lat/lon grid.
Click on image to enlarge.
The GRIB file name format is:
ofs_atl_t00z.YYMMDD.ffff.grb
- YYYY = year
- MM = month
- DD = day
- ffff (nowcast/forecast) =
- N000 (nowcast)
- F024 (24-hour forecast)
- F048 (48-hour forecast)
- F072 (72-hour forecast)
- F096 (96-hour forecast)
- F120 (120-hour forecast)
Model Data Description
The full-field data sets on NOADS and the FTPPRD server are
in the model's native orthogonal
curvilinear coordinates in the horizontal, and are interpolated to 40
pressure levels in the vertical.
Here is a list of the interpolated depths.
The following fields are included in the GRIB files:
Daily three-dimensional fields (40 pressure levels)
- Salinity (psu)
- In-Situ Temperature (C)
- Horizontal Velocities (m/sec)1
- Vertical Velocity (m/sec)
- Mixed Layer Depth (m)
- Sea Surface Height (m, relative to geoid)
1Note that the u and v horizontal
velocities are in the frame of reference of the model grid, not rotated into
lat/lon coordinates. Rotation routines in Fortran and MATLAB are
available here.
Hourly surface fields
- Sea Surface Height (m, relative to geoid)
- Sea Surface Salinity (psu)
- Sea Surface Temperature (C)
- Sea Surface Horizontal Velocities (m/sec)1
- Mixed Layer Thickness (meters)
1Note that the u and v horizontal
velocities are in the frame of reference of the model grid, not rotated into
lat/lon coordinates. Rotation routines in Fortran and MATLAB are
available here.
|


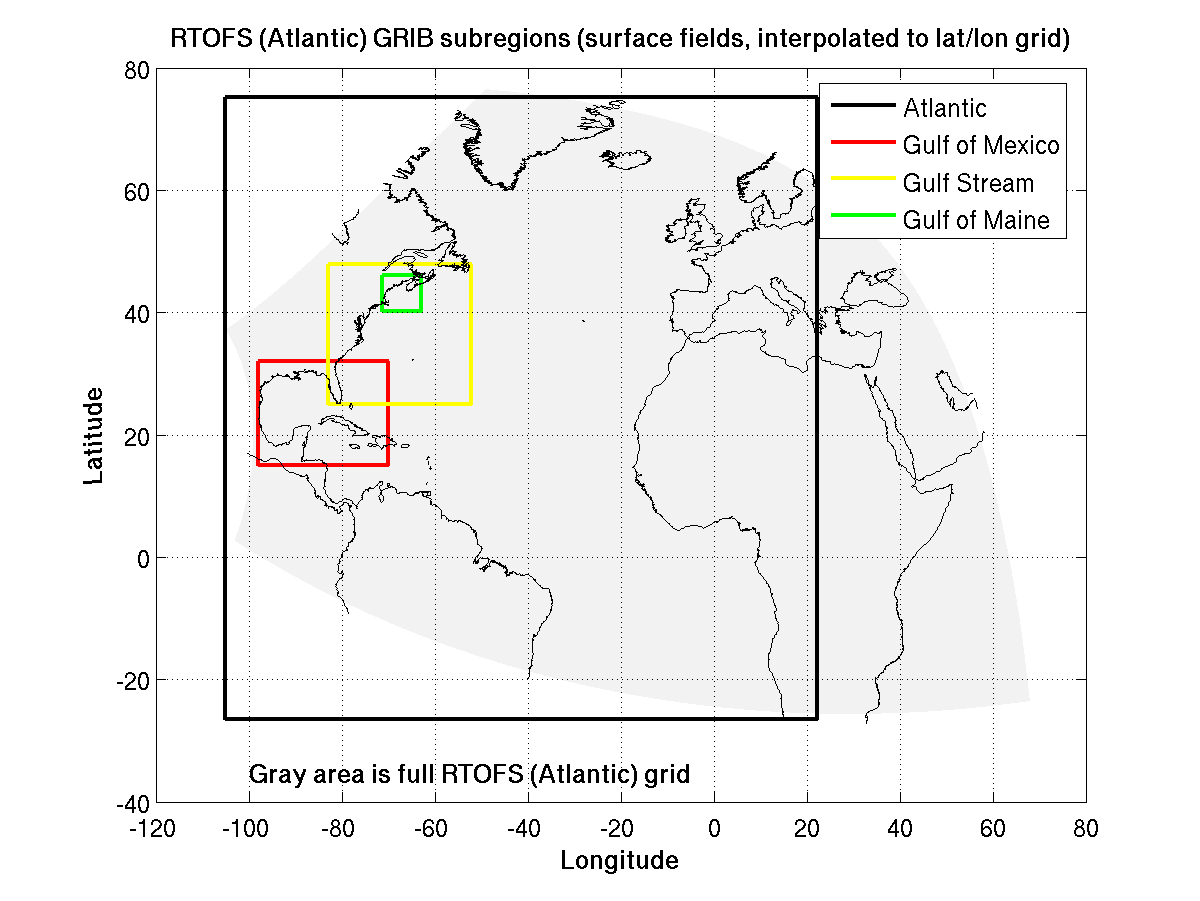 A map of the surface field subregions interpolated to
a regular lat/lon grid.
A map of the surface field subregions interpolated to
a regular lat/lon grid.