Series No. 453
Subject: Ocean Surface Waves
SIGNIFICANT CHANGES FROM LAST BULLETIN ON THIS SUBJECT NO. 426
Created 08/17/1999; superceded 05/25/2003.
W/NP21:HSC, LDB
This bulletin, prepared by Dr. H. S. Chen, Mr. L. D. Burroughs, and H. L. Tolman of the Ocean Modeling Branch (OMB), Environmental Modeling Center (EMC), National Centers for Environmental Prediction (NCEP), describes automated global ocean wave guidance provided in graphic, alphanumeric, and GRIB formats. This guidance is scheduled for internal implementation in May 1999 and for operational implementation after the new IBM RS/6000 SP computer is relocated to Bowie, Maryland sometime in the late Fall 1999.
The NOAA/WAM will be replaced with the NOAA WAVEWATCH III (NWW3). The NWW3 is a third generation model, but differs in many respects from the NOAA/WAM: it accounts for wave dispersion within a discrete spectral bin by adding diffusion terms to the propagation equation (Booij and Holthuijsen 1987); it uses the Chalikov and Belevich (1993) formulation fori wave generation and the Tolman and Chalikov (1996) formulation for wave dissipation; it employs a third order finite difference method by utilizing a split-mode scheme with a Total Variance Diminishing limiter to solve wave propagation; its computer code has been optimized to fully utilize the MPP structure of the new IBM R/S 6000 SP; it uses a higher spatial resolution (1.25o x 1.00o lon./lat. grid instead of 2.5o x 2.5o), a slightly larger domain in north-south extension (78oN - 78oS rather than 77.5oN - 67.5 oS), and a higher directional resolution (24 directions in place of 12).
The bulletins and graphics of the new guidance follow the same formats shown in TPB No. 426 (Chen, 1995), except for the following differences :
(1) The full NWW3 resolution and domain are used for AWIPS, while the NOAA/WAM resolution and domain are used for AFOS and facsimile products.
(2) The current set of AFOS and facsimile products will remain until there is no longer a need for them. The data used to produce them will come from the NWW3. The AWIPS GRIB products should become available in AWIPS as a part of software Build 4.2.
(3) The following wind and wave parameters are available in GRIB format at the web site above, on Family of Services (FOS), and AWIPS: Hs, Dm, Tm, peak wave period and direction, wind sea peak wave period and direction, wind speed and direction, and u- and v-wind components. Note, however, that significant wind sea height, significant swell height, and mean swell period and direction are no longer provided. The overall peak period and direction replaces the swell period and direction for a large part of the domain.
(4) Spectral text bulletins for the NWW3 are available at http://polar.ncep.noaa.gov/waves. These files are in ASCII and are available by anonymous ftp from the directory ftp://polar.ncep.noaa.gov/pub/waves/date.cycle, where date represents the date in yyyymmdd format and cycle represents the run cycle identifier (t00z or t12z, respectively). These bulletins will be implemented on AWIPS as soon as headers can be derived for them.
The ocean wave guidance will continue to be generated twice daily out to 72 hours based on the 0000 and 1200 UTC cycles of the Aviation (AVN) run of the Global Spectral Atmospheric Model, but using data supplied by the (NWW3).
Technical Procedures Bulletin No. 426 is now operationally obsolete.
OCEAN SURFACE WAVES(1)
by H. S. Chen, L. D. Burroughs, and H. L. Tolman(2)
1. INTRODUCTIONIn late Fall 1999, the NOAA version of the Wave Model (WAM) (NOAA/WAM; Chen 1995) is scheduled to be replaced by the NOAA WAVEWATCH III (NWW3) model (Tolman 1999a, b, and c) as the current National Centers for Environmental Prediction (NCEP) operational global wave model.
During the last five decades, wind wave forecasts have improved significantly from the empirical approaches based on Sverdrup and Munk (1947) and Bretschneider (1958) to the spectral approaches based on the radiative transport equation (e.g. SWAMP Group 1985). At present, the most advanced spectral model for research and forecast is the so-called third generation wave(3) model (WAMDI Group 1988) of which the NWW3 is an example. The Ocean Modeling Branch (OMB) has made systematic efforts to test and develop models based on prediction accuracy, computational efficiency and sound wave dynamics and to employ them to produce operational forecasts.
The NWW3, as noted above, is a third generation model, but differs in many respects from the NOAA/WAM: it accounts for wave dispersion within a discrete spectral bin by adding diffusion terms to the propagation equation (Booij and Holthuijsen 1987); it uses the Chalikov and Belevich (1993) formulation for wave generation and the Tolman and Chalikov (1996) formulation for wave dissipation; it employs a third order finite difference method by utilizing a split-mode scheme with a Total Variance Diminishing limiter to solve wave propagation; its computer code has been optimized to fully utilize the Massively Parallel Processing (MPP) structure of the new IBM RS/6000 SP; it uses a higher spacial resolution (1.25o x 1.00o lon./lat. grid instead of 2.5o x 2.5o), a slightly larger domain in north-south extension (78oN - 78oS rather than 77.5oN - 67.5oS), and a higher directional resolution (24 directions in place of 12).
This TPB briefly describes the NWW3 and the wave guidance products which are being disseminated. This guidance consists of significant wave height (Hs), which combines sea and swell; mean wave direction (Dm); mean wave period (Tm); and directional wave spectra at selected grid points. Guidance is available in graphic, alphanumeric, and GRIB formats. Note that other wave and wind parameters are also available in GRIB format, i.e., peak wave period and direction, wind sea peak wave period and direction, wind speed and direction, and u and v wind components, and are posted at http://polar.ncep.noaa.gov/waves on the web. The reader is referred to World Meteorological Organization (WMO) Report No.702 (second edition; 1998) for wave definitions, measurements and modeling.
The bulletins and graphics of the new guidance follow the same formats shown in TPB No. 426 (Chen, 1995), except for the following differences:
(1) The full NWW3 resolution and domain is used for AWIPS, while the NOAA/WAM resolution and domain is used for AFOS and facsimile products.
(2) The current set of AFOS and facsimile products will remain until there is no longer a need for them. The data used to produce them will come from the NWW3. The AWIPS GRIB products should become available in AWIPS as a part of software Build 4.2.
(3) The following wind and wave parameters are available in GRIB format at the web site above, on Family of Services (FOS), and AWIPS: Hs, Dm, Tm, peak wave period and direction, wind sea peak wave period and direction, wind speed and direction, and u- and v-wind components. Note, however, that significant wind sea height, significant swell height, and mean swell period and direction are no longer provided. The overall peak period and direction replaces the swell period and direction for a large part of the domain.
(4) Spectral text bulletins for the NWW3 are available at http://polar.ncep.noaa.gov/waves. These files are in ASCII and are available by anonymous ftp from the directory ftp://polar.ncep.noaa.gov/pub/waves/date.cycle, where date represents the date in yyyymmdd format and cycle represents the run cycle identifier (t00z or t12z, respectively). These bulletins will be implemented on AWIPS as soon as headers can be derived for them. The format for these bulletins is discussed below.
2. NOAA WAVEWATCH III (NWW3) OCEAN WAVE FORECAST MODEL
Global ocean wave forecasts are operationally generated at the NCEP by using the NWW3 model. Fields of directional frequency spectra in 24 directions and 25 frequencies are generated at hourly intervals up to 72 hours. The 24 directions begin at 90 degrees to the east and have a directional resolution of 15 degrees. Note that 12 directions were used in the NOAA/WAM. The 25 frequencies used by the NWW3 are given by bin in Table 1.
Wave spectral data are computed on a 1.25 by 1.00 degree longitude/latitude grid for ocean points between latitude 78.0 degrees North to 78.0 degrees South. Wind fields are the only driving force used in the model. They are constructed from spectral coefficients of the lowest sigma layer winds from the NCEP analysis and aviation version of the global forecast system (AVN) (Kanamitsu et al. 1991; Caplan et al. 1997) with no interpolation to the model grid required. The winds are then adjusted to a height of 10 m by using a logarithmic profile corrected for stability with air-sea temperature differences. Analyzed wind fields from the previous 12 hours at 3-h intervals are used for a 12-h wave hindcast. Winds from thei AVN at 3-h intervals out to 72 hours are used to produce wave forecasts out to 72-h which are produced twice daily for the 0000 and 1200 UTC cycles.
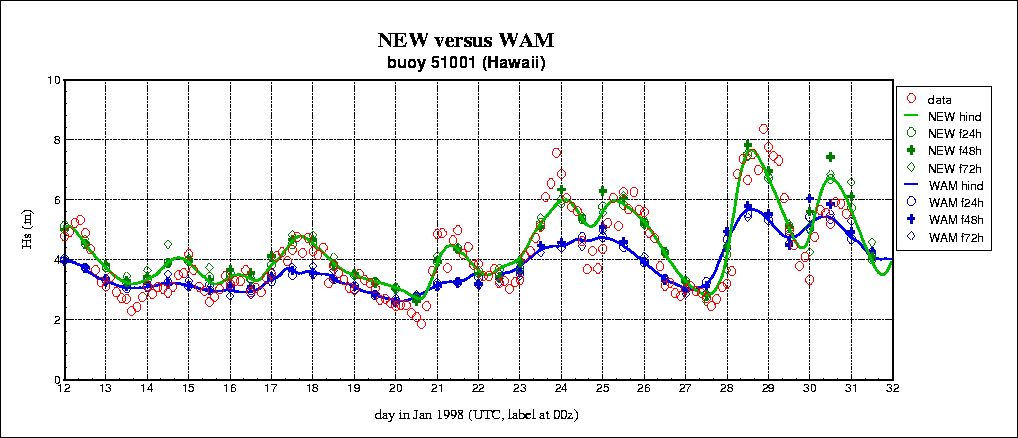
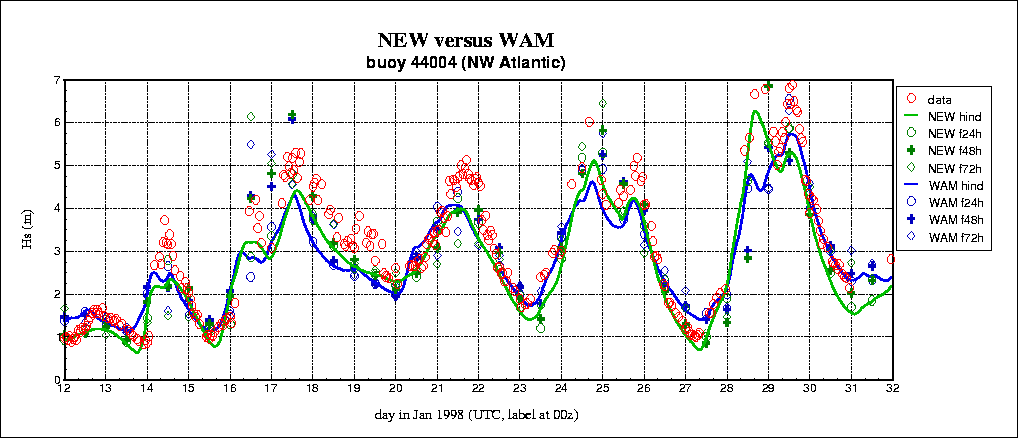
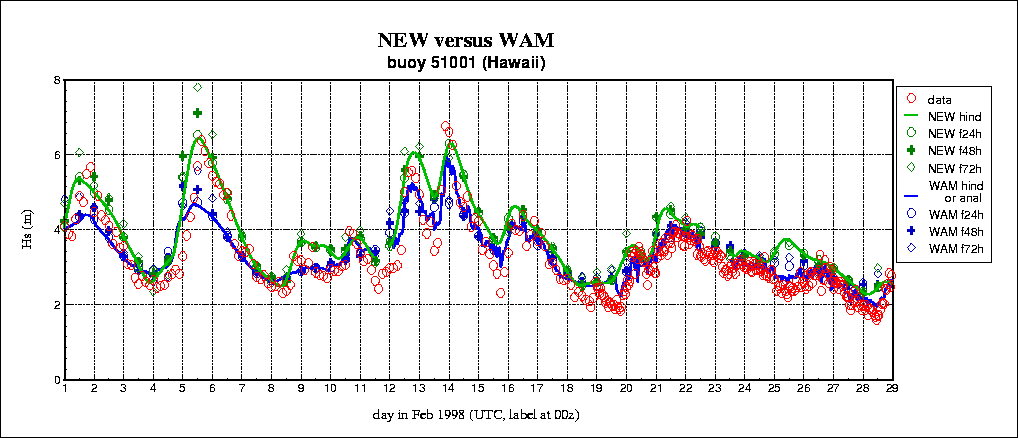
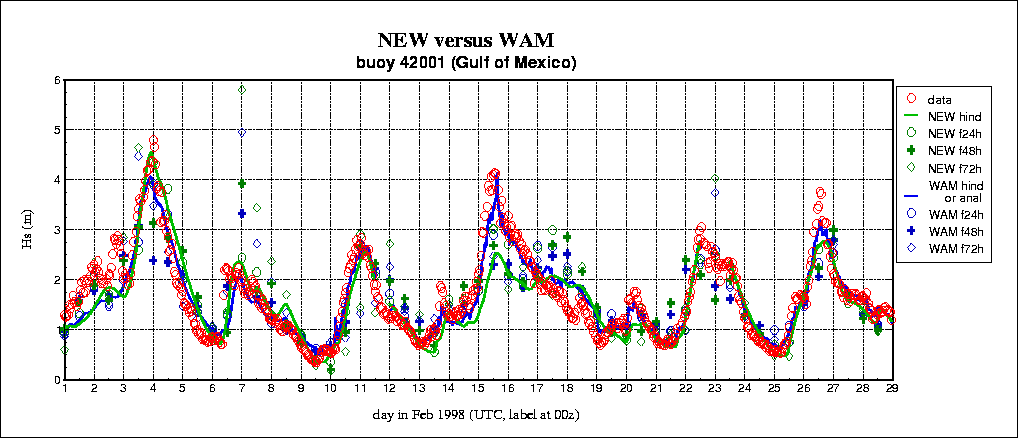
Typical comparisons of significant wave heights for the NWW3 and the NOAA/WAM are shown in Figs. 1a, 1b, 1c, 1d, 1e, and 1f. Figures 1a - 1c show wave heights for NDBC buoy locations 51001 (panel a, Hawaii) 42001 (panel b, Gulf of Mexico) and 44004 (panel c, U.S. east coast) for the second half of January 1997. Figures 1d, 1e, and 1f show similar figures for February 1997. Note that assimilation of this buoy data along with the ERS2 altimeter data into NOAA/WAM started at February 9, 1997.
In January at locations 51001 and 42001 NWW3 shows a more realistic description of the wave height variability than NOAA/WAM, capturing both high and low extreme values better. This appears to be fairly representative for locations with significant swell systems present, and for enclosed basins which are better resolved by the higher spatial resolution of NWW3. At location 44004, the models behave fairly similar, which appears representative for locations where the wave field is generally dominated by wind seas.
In February, the hindcast results for NOAA/WAM become much better due to the assimilation of the wave data (Fig. 1d , 1e, 1f). Not surprisingly, the NOAA/WAM hindcasts/analysis compares better to the assimilated buoy than the NWW3 hindcasts, in which these data are not used. The improvement due to the assimilated data is lost from the NOAA/WAM after 6 to 12-h of forecasting, and the comparison between NOAA/WAM and NWW3 becomes similar to the comparison for January.
3. AVAILABLE PRODUCTS AND DISSEMINATION
The ocean surface waves are calculated for grid points covering the whole globe, excluding land, the North and South pole areas, and inland water bodies, such as Great Lakes, Chesapeake Bay, Mediterranean Sea, etc. The calculated waves are disseminated graphically via AFOS, AWIPS, Family of Services (FOS) and facsimile for selected areas, in alphanumeric format via AFOS and AWIPS for selected grid points, and in GRIB format via AWIPS and FOS.
a. AFOS Graphics
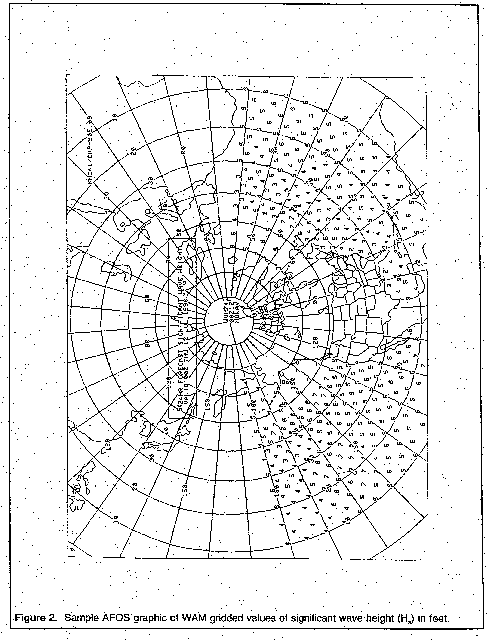
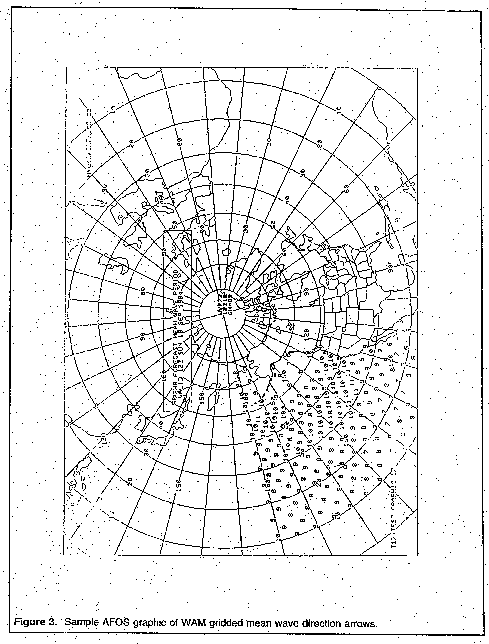
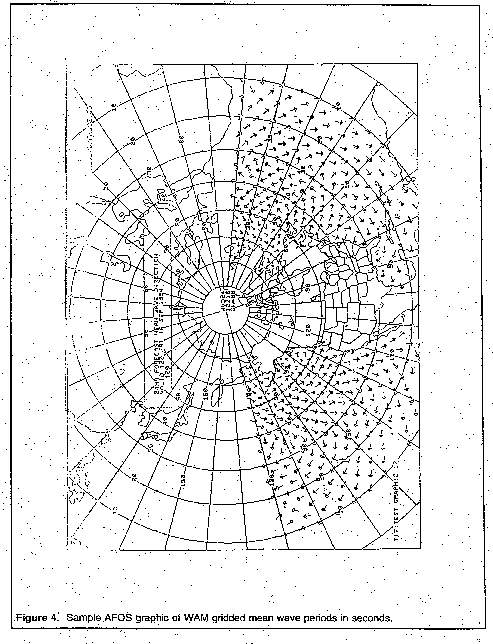
Gridded charts of Hs, mean wave direction, and mean wave period are disseminated on AFOS, the AFOS Graphics Service of the FOS, and to AWIPS. The data are displayed on a Northern Hemisphere map background (AFOS map background B01). The charts extend from 10 degrees to 70 degrees North latitude and 20 degrees to 180 degrees West longitude for Hs and mean wave direction. Mean wave periods are transmitted for only the Pacific portion of these latitudes and longitudes.
To avoid crowding and to reduce the size of the graphic products, information is plotted at every other model grid point. Numeric values of Hs (to the nearest foot) and mean wave period (to the nearest second) are given, and arrows show the wave direction. The size of the characters and length of the arrows are somewhat reduced above 50 degrees North latitude.
Hs is a measure of the combined sea and swell wave height. It is a statistical quantity defined as the average of the highest one-third of the waves in a given wave record. Since the human eye biases toward the higher waves in a confused sea, visual estimates correspond to an approximation of this definition. It has been shown that the Hs is related to the sum of the frequency-directional components in a wave energy spectrum (Neumann and Pierson 1966).
The direction reported is the mean wave direction averaged over the all spectral wave components. In the absence of a wind sea at a location due to very light local winds, the arrow will indicate the direction of the mean swell. The period reported is the mean wave period averaged over the all spectral wave components. Period is the reciprocal of the frequency. Charts are produced for the 12-, 24-, 48-, and 72-h wave forecasts for 0000 and 1200 UTC. Table 2a shows the product identifiers and titles of the AFOS graphics. Figures 2, 3 , and 4 show examples. These products have been converted to AWIPS graphics products and the Pacific graphics have been expanded to the west. The product identifiers are given in table 2b
b. Alphanumeric spectral message
Directional spectral bulletins are transmitted for 10 selected grid points, four locations in the Atlantic and six in Pacific (refer to >Table 3) and have a total of 60 alphanumeric messages at 0000 UTC and 26 alphanumeric messages at 1200 UTC. At 0000 UTC, bulletins AGPZ41 KWBC (AFOS PIL NMCOSWSP1) and AGPZ42 KWBC (AFOS PIL NMCOSWSP2) containing directional spectra for Pacific locations (47.5oN, 125.0oW) and (45.0oN, 125.0oW) respectively provide forecasts at 6 hourly intervals from 0- to 48-h plus the 60-h projection. Bulletins of wave directional spectra at the other locations provide forecasts every 12 hours from 12- to 60-h. At 1200 UTC, bulletins for the two Pacific locations provide forecasts at 6 hourly intervals from 0- to 24-h. Bulletins at the other locations provide forecasts at 12- and 24-h.
Currently, the alphanumeric bulletins are sized to use a maximum of 15 frequencies. To reduce the number of frequencies from 25 to 15, the two highest and lowest frequencies were not used and other frequencies were combined to give the frequencies found in Table 4.
The format of the alphanumeric spectral bulletin gives the variance in each of the frequency/period bands and directional bands in the body of the message . The variance values are in meters squared x 1000. An example of a spectral bulletin generated from the NWW3 in NOAA/WAM format is depicted in Fig. 5.
The first line of the message header below the WMO header line gives the AWIPS identifier; the third line presents the model run date/time (YYMMDDHH), the latitude and longitude of the model grid point, the model cycle time (0000 or 1200 UTC), the model run date, and the projection (TAU).
Row and column headings are shown on the far left and top, respectively, of Fig. 5a. Rows or columns with all zero values are omitted (again to reduce the volume of the transmission). The row headings are the (logarithmic) center period of the band in seconds. The column headings are the center direction of the directional band. Frequency spectral densities can be obtained by dividing the variances by the corresponding band width (in Hz) in Table 4.
Spectral text bulletins are presented for numerous points of NWW3. These bulletins are in ASCII and are available on the INTERNET at present, and, when AWIPS headers are asigned, they will be available to the field in AWIPS. The line length of the table is 130 characters by 100 lines (see Fig. 5b). The header of the table identifies the output location, the generating model and the run date and cycle of the data presented. At the bottom of the table, a legend is printed. The table consists of 8 columns. The first column gives the time of the model results with a day and hour (the corresponding month and year can be deduced from the header information). The second column presents the overall significant wave height (Hs, the number of individual wave fields identified with a wave height greater that 0.05 m (n), and the number of such fields with a wave height over 0.15 m that could not be tracked in the remainder of the table (x). Individual wave fields in the spectrum are identified using a partitioning scheme similar to that of Gerling (1992). In the remaining six columns individual wave fields are tracked with their height (Hs), peak wave period (Tp) and mean wave direction (dir, direction in which waves travel relative to North). Generally, each separate wave field is tracked in its own column. Such tracking, however, is not guaranteed to work all the time. An asterisk in a column identifies that the wave field is at least partially under the influence of the local wind, and, therefore, most likely part of the local wind sea. All other individual wave fields are pure swell.
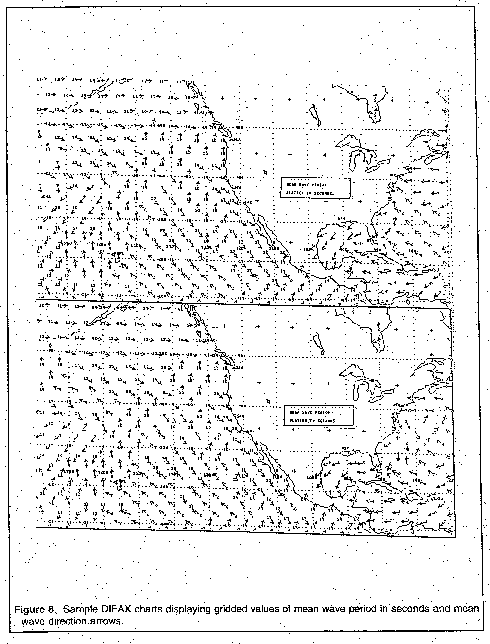
c. Facsimile graphics
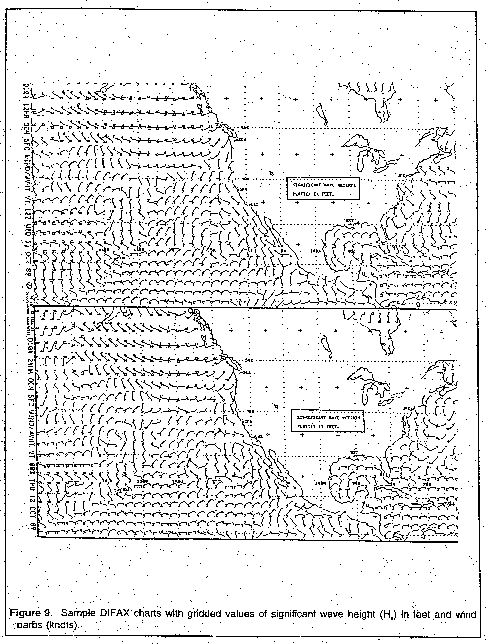
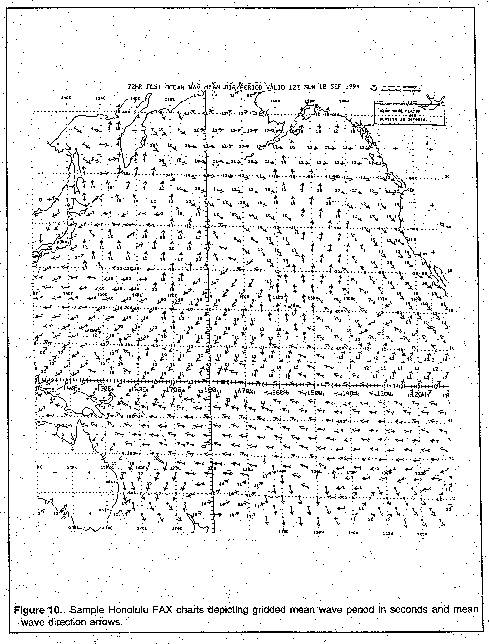
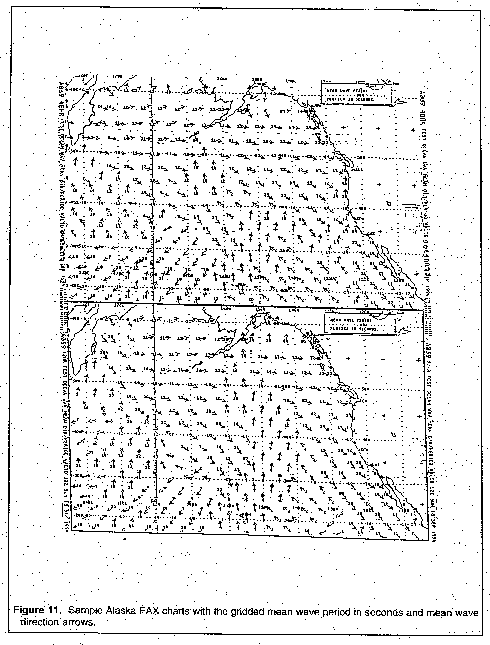
Two Mercator charts containing wave information are distributed over the facsimile circuits. One chart displays gridded wind barbs and values of Hs in feet; the second chart displays arrows showing the mean wave direction and the mean wave period in seconds. The charts cover different geographical areas and are disseminated over the corresponding circuits as shown in Table 5.
Charts for 12-, 24-, 48-, and 72-h are transmitted for 0000 and 1200 UTC. Two panel charts (12-/24-h and 48-/72-h) are displayed per facsimile slot except for the Honolulu circuit, which displays a single panel chart per slot. Examples of these charts are given in Figs. 6, 7, 8, 9, 10, and 11. As in the AFOS charts, the mean wave directions and mean periods are shown in the figures. When there is no wind sea, the mean direction and mean period of the swell are shown.
d. GRIB bulletins
GRIB bulletins are available for use in AWIPS and for transmission on the Numerical Data Service of FOS. Table 6 gives the bulletin headers and their meaning. Bulletins are available at 6-h intervals from 00- through 72-h. Available parameters are Hs, m, Tm, peak wave direction and period, wind sea peak wave direction and period, and u and v components of the wind velocity. A 1.25 o x 1.00o lon./lat. grid is used with a domain from 0 o - 360oE and 78oN to 78oS.
4. EVALUATION
Extensive evaluation of the NOAA/WAM and the NWW3 model wasi carried out from January through July 1998 by comparing with buoy data and ERS2 altimeter data. These results are available at http://polar.ncep.noaa.gov/waves/NEW-WAM.html. Typical results from the buoy comparisons are shown in Figs. 1a, 1b, 1c, 1d, 1e, and 1f. Comments from the high seas forecasters at NCEP, WFO Honolulu, and WFO Guam as well as other educational and commercial users indicate the overall wave patterns are more realistic as well.
5. REFERENCES
Booij, N. and L.H. Holthuijsen, 1987: Propagation of ocean waves in discrete spectral wave models. J. Comput. Phys., 68, 307-326.
Bretschneider, C.L., 1958: Revisions in wave forecasting: Deep and shallow water. Proc. 6th Int. Conf. Coastal Eng. , ASCE, 30-67.
Caplan, P., J. Derber, W. Gemmill, S.-Y. Hong, H.-L. Pan and D. Parish, 1997: Changes to the NCEP operational medium-range forecast model analysis/forecast system. Wea. Forecasting, 12, 581-594.
Chalikov, D.V. and Belevich, M.Y., 1993: One-dimensional theory of the boundary layer. Boundary-Layer Meteor., 63 , 65-96.
Chen, H.S., 1995: Ocean surface waves. NWS Technical Procedures Bulletin No. 426, NOAA, U.S. Department of Commerce, 17 pp. [OBSOLETE]
Gerling, T.W., 1992: Partitioning sequences and arrays of directional wave spectra into component wave systems. J. Atmos. Ocean. Techn., 9, 444-458.
Kanamitsu, M., J.C. Alpert, K.A. Campana, P.M. Caplan, D.G. Deaven, M. Iredell, B. Katz, H.-L. Pan, J.E. Sela and G.H. White, 1991: Recent changes implemented into the global forecast system at NMC. Wea. Forecasting, 6, 425-435.
Neumann, G. and W.J. Pierson, 1966: Principles of physical oceanography. Prentice-Hall, Inc., New York, 571 pp.
Sverdrup, H.U. and W.H. Munk, 1947: Wind, sea and swell: Theory of relations for forecasting. Publication 601, Hydrographic Office, U.S. Navy, 50 pp.
The SWAMP Group, 1985: Ocean Wave Modeling . Plenum Press, New York, 256 pp.
Tolman, H.L. and Chalikov, D., 1996: Source terms in a third-generation wind-wave model. J. Phys. Oceanogr., 26, 2497-2518.
Tolman, H.L., 1999a: User manual and system documentation of WAVEWATCH-III version 1.18. Technical Note No. 166, Ocean Modeling Branch, NCEP, National Weather Service, NOAA, Department of Commerce, 110 pp. [Avaiable at http://polar.ncep.noaa.gov/waves/wavewatch/].
Tolman, H.L., 1999b: WAVEWATCH-III version 1.18.: Generating GRIB files. Technical Note No. 167, Ocean Modeling Branch, NCEP, National Weather Service, NOAA, Department of Commerce, 7 pp. [Avaiable at http://polar.ncep.noaa.gov/waves/wavewatch/].
Tolman, H.L., 1999c: WAVEWATCH-III version 1.18.: Post-processing using NCAR graphics. Technical Note No. 168, Ocean Modeling Branch, NCEP, National Weather Service, NOAA, Department of Commerce, 9 pp. [Avaiable at http://polar.ncep.noaa.gov/waves/wavewatch/].
The WAMDI Group, 1988: The WAM model - A third generation ocean wave prediction model. J. Phys. Oceanogr., 18, 1775-1810.
World Meteorological Organization, 1998: Guide to wave analysis and forecasting (second edition). WMO No. 702, Secretariat of the World Meteorological Organization, Geneva, Switzerland, 224 pp.
1. 1
OMB Contribution No. 173
2. 2
H. L. Tolman is a UCAR visiting scientist with OMB.
3. 3A
third generation wave model solves the radiative transfer equation by direct
integration of all its components without pre-assumed constraints to the
spectral shape. Previous models rely (partially) on assumed spectral shapes
and parameterizations of the integral effects of the physics of wave growth and
decay.