


In the July 2004 report of the NOAA Science Advisory Board on Ocean Modeling, NWS/NCEP was charged to become the “computational backbone” for operational physical ocean modeling within NOAA. In particular the response to the report states that the charge is
To develop a national backbone capability for ocean, coastal ocean and Great Lakes modeling as part of an integrated operational Earth System Model … [to] serve as the foundation for operational environmental prediction for a diverse array of customers and partners.
Within NOAA, the primary responsibility for (weather- and) basin-scale physical modeling resides with NWS/NCEP, whereas the responsibility for regional and coastal scales is shared by partners inside and outside NOAA (NOS, OAR, IOOS Regional Associations, etc.), with relevant modeling efforts to be transferred to NCEP operational super computing facilities. The primary responsibility for the integrated Ecosystem modeling resides within NOS, with individual responsibilities mainly residing within NOS and NMFS. These efforts can only succeed as a part of a national effort, with a strong partnerships with the Navy, NASA, USCG, USACE, academia and industry.
As a response to this charge and to build adequate ocean forecasting capability at NCEP, an operational global eddy resolving system is needed to provide initial and boundary conditions for other operational basin-wide, regional and coupled forecast systems. Efforts are ongoing to implement such a real-time global ocean forecast system in operations at NCEP/NWS/NOAA. This system will be based on an eddy resolving 1/12° global HYCOM model (Bleck, 2002; Chassignet et al., 2009) and will serve as part of a larger national backbone capability of ocean modeling at NWS in strong partnership with US Navy.
Based on the successful design of the existing operational RTOFS-Atlantic system (Mehra and Rivin, 2010), the global ocean forecast system will run once a day and produce a 8 day long forecast using the daily initialization fields produced at NAVOCEANO using NCODA, a 3D multi-variate data assimilation methodology (Cummings, 2005). The data types assimilated include in situ profiles of temperature and salinity from a variety of sources and remotely sensed SST, SSH and sea-ice concentrations. The operational ocean model configuration has 32 hybrid layers and a horizontal grid size of (4500 x 3298) . The grid has an Arctic bi-polar patch north of 47 deg N and a Mercator projection south of 47 N through 78.6 S ( Figure 1 below). The coastline is fixed at 10 m isobath with open Bering Straits. The potential temperature is referenced to 2000 m depth (sigma-2) and the first level is fixed at 1 m depth. The dynamic ocean model is coupled to a thermodynamic energy loan ice model and uses the KPP mixed layer formulation (Large et al., 1994). The forecast system is forced with 3-hourly momentum, radiation and precipitation fluxes from the operational Global Forecast System (GFS) fields.
Results include daily volume and 3 hourly surface fields in netCDF format with CF conventions. Some surface fields in GRIB format are also generated for internal use at NWS.
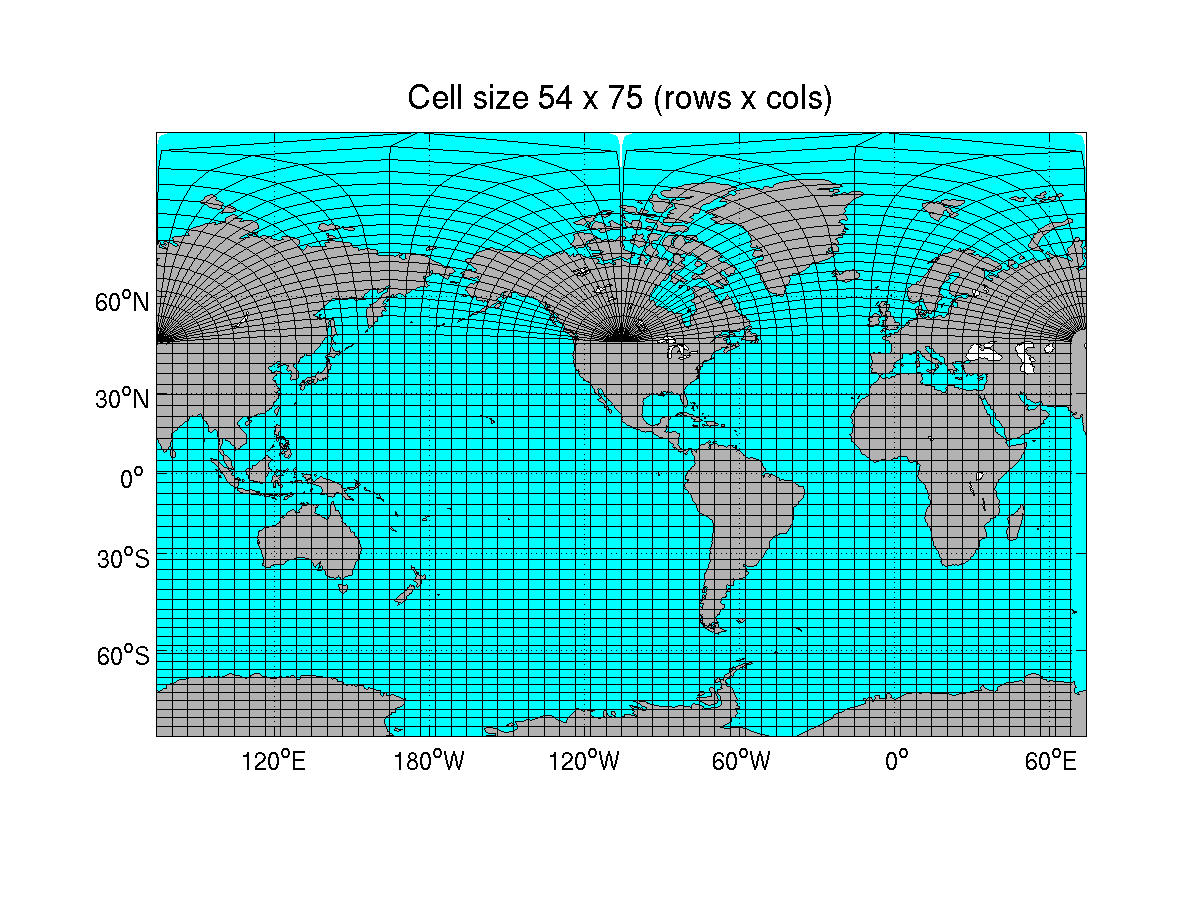 Figure 1: Grid for the global ocean forecast system with each cell
representing 54th row and 75th column of the grid.
Figure 1: Grid for the global ocean forecast system with each cell
representing 54th row and 75th column of the grid.
Preliminary monitoring and diagnostic evaluation of the results from this forecast system have begun and include representation of the Gulf Stream path with comparisons to dual US Navy analysis (see Figure 2). The Gulf Stream path is well defined in the forecast system and agrees with the envelope of the Navy’s frontal analysis based on IR imagery feature extraction. Daily SSH anomaly comparisons with the independent SSH analysis from AVISO’s SSALTO/DUACS (https://www.aviso.oceanobs.com) show some differences in the regions of large sea surface height variability (see Figure 3). For example, in the Indian Ocean basin, large differences are seen in the Agulhas Current region and in Celebes Sea (west of Borneo) and some of the coastal regions near the Arabian peninsula. To examine sub-surface water masses, comparisons with WOCE sections (https://www.nodc.noaa.gov/WOCE) can indicate drifts in the forecasts which would need to be corrected. One such comparison is shown in Figure 4. The low salinity cell centered around 30 N and between 500 and 1000 m depths is well represented on the meridional WOCE section P-14 across the central Pacific.
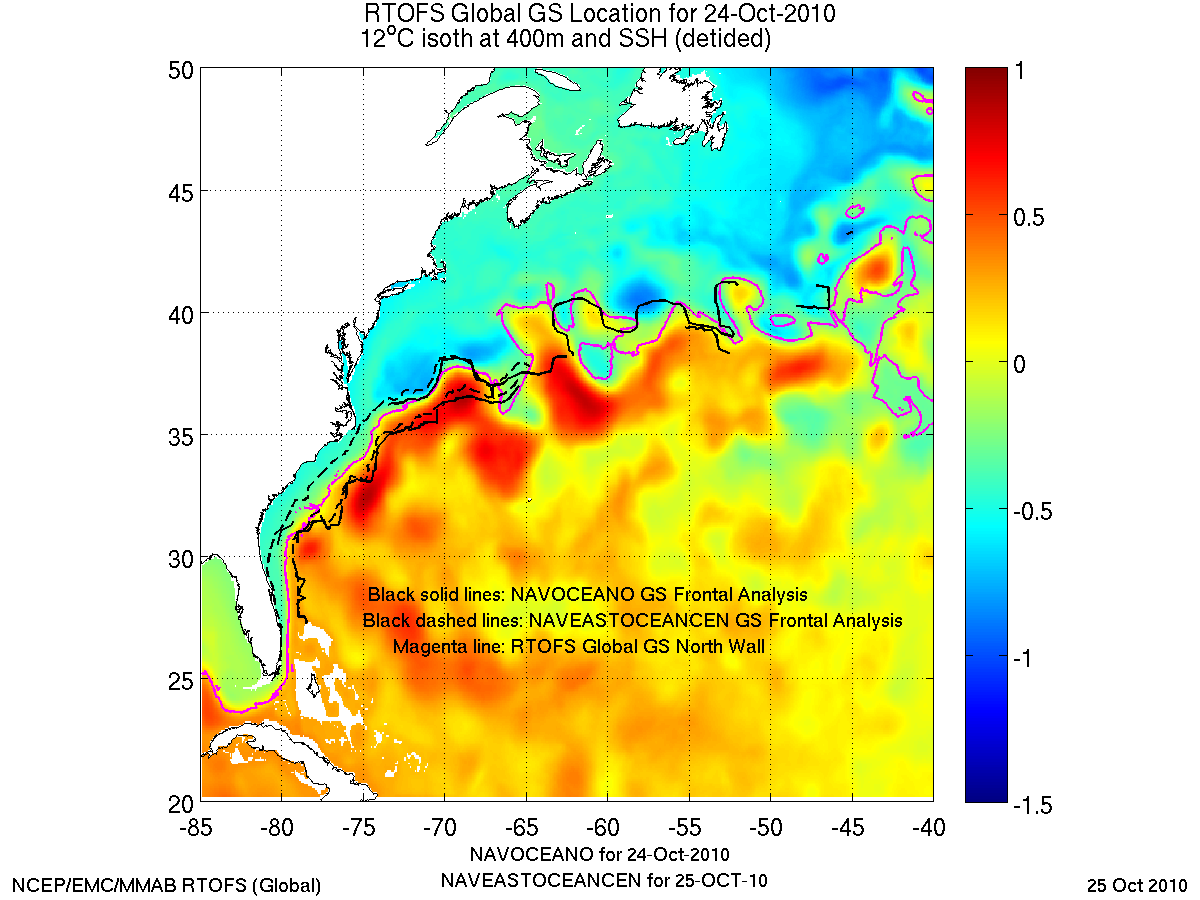 Figure 2: Location of the north wall of the Gulf Stream based on feature
detection from multiple sources including Global RTOFS.
Figure 2: Location of the north wall of the Gulf Stream based on feature
detection from multiple sources including Global RTOFS.
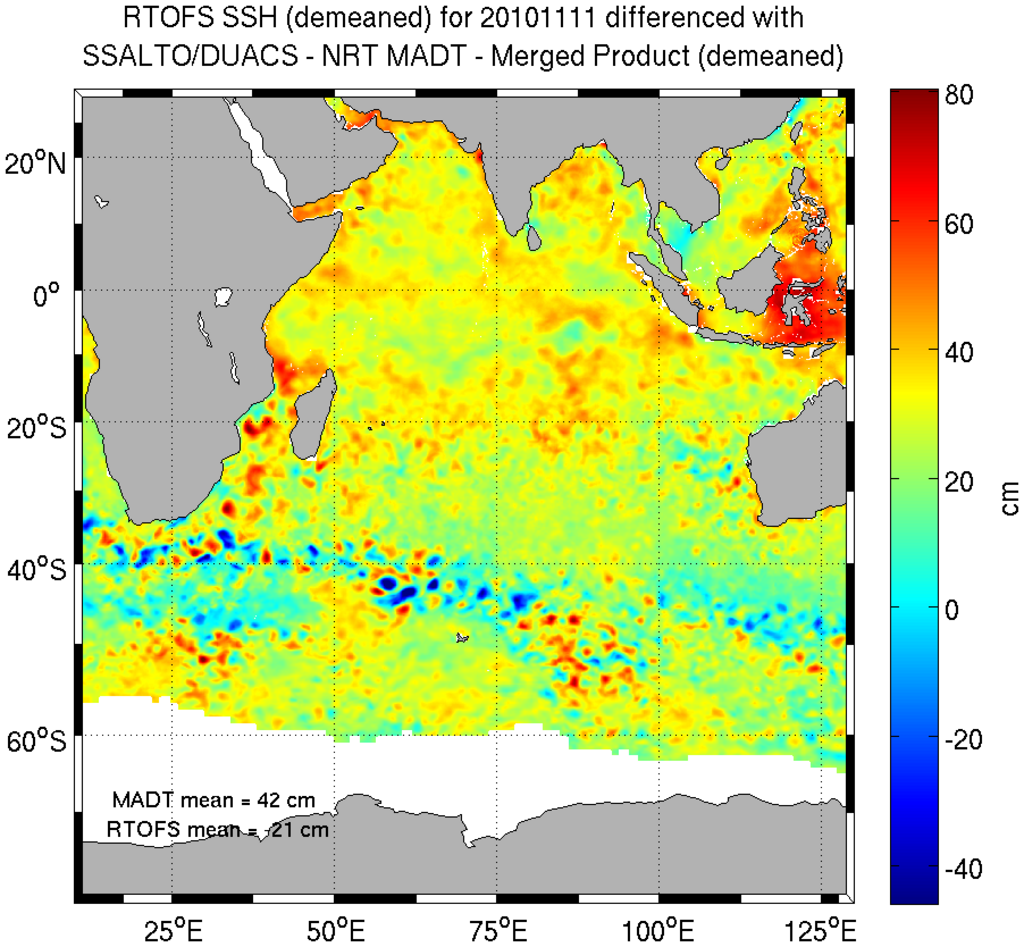 Figure 3: Differences in SSH anomalies in the Indian Ocean between RTOFS and
SSALTO/DUACS SSH analysis.
Figure 3: Differences in SSH anomalies in the Indian Ocean between RTOFS and
SSALTO/DUACS SSH analysis.
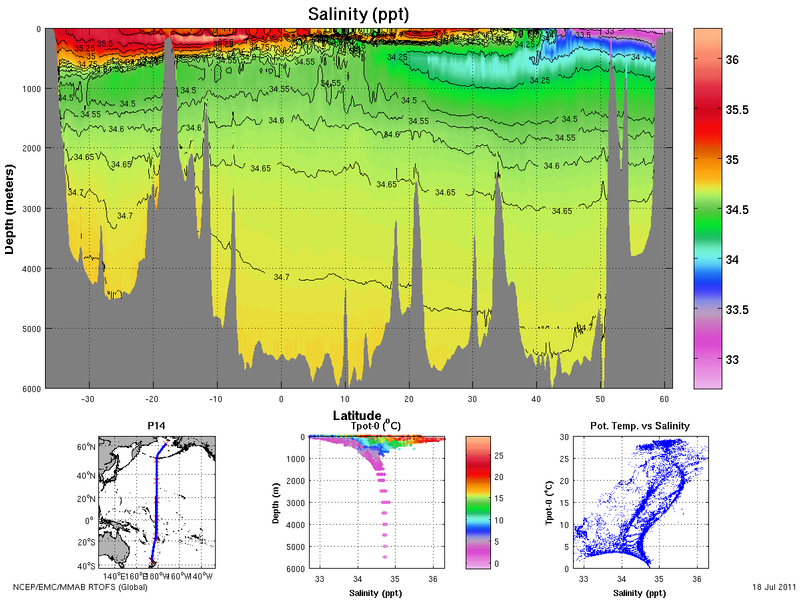 Figure 4: Salinity along the meridional P-14 WOCE section (top) compared
with the salinities along the same section from RTOFS.
Figure 4: Salinity along the meridional P-14 WOCE section (top) compared
with the salinities along the same section from RTOFS.
As a participant in GODAE OceanView program (https://www.godae-oceanview.org), results from RTOFS will be used for analysis of Class 4 metrics which are based on model-derived variables in observation space. These will include ARGO profiles, remotely sensed SSH and SST data and Sea-Ice concentration. A proposal has also been submitted to assess the impact of SSS on model initialization in the context of short term real time operational forecasts.
Current plans are to implement this system into operations by the end of fiscal year 2011. In-house analysis and initialization of this system at NCEP using a 3DVAR data assimilation scheme will be developed in time for the next machine (hardware) upgrade expected in 2014. Long term plans also include providing initial and boundary conditions to existing operational regional and coupled hurricane forecast systems at NCEP. A coarser version will also serve as the ocean component of a future climate forecast system.